Stress and strain analysis of Si-based III – V template fabricated by ion-slicing
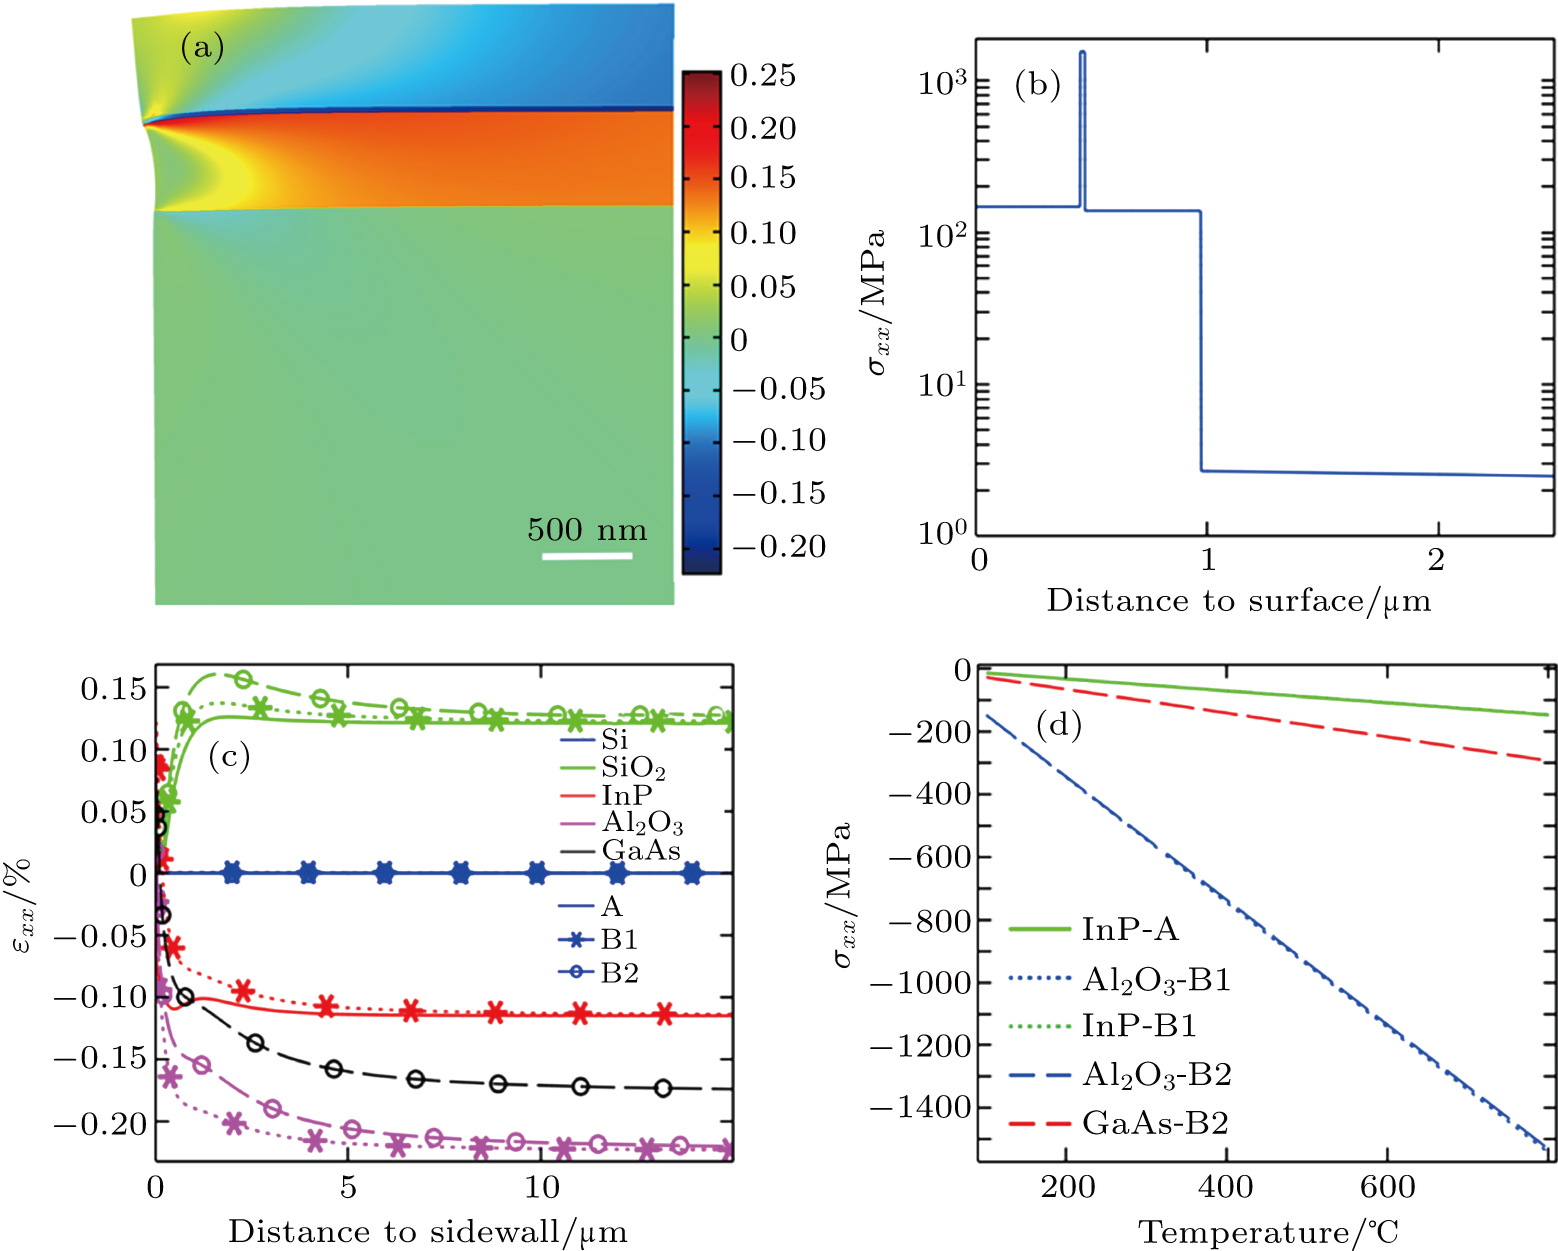
(a) A slice of εxx distribution close to the sidewall, extracted from the center plane of structure B1 at 600°C. The deformation is exaggerated for 50 times. (b) Vertical σxx profile adjacent to the surface, extracted from the center of structure B1 at 600°C. (c) Lateral εxx profile in the layers in different structures adjacent to the sidewall at 600°C. The layers are labeled by material and color, as follows, Si (blue), SiO2 (green), InP (red), Al2O3 (magenta), and GaAs (black); while the structures are differentiated by line style/markers, as follows, A (solid curve, no marker), B1 (dotted curve & star marker), and B2 (dashed curve & circle marker). (d) σxx in the III–V and Al2O3 layers in different structures versus temperature. Some curves of the same material in different structures almost overlap.