Tensile-strain induced phonon splitting in diamond
Pu Meifang1, Zhang Feng1, Liu Shan1, Irifune Tetsuo2, Lei Li1, †
Institute of Atomic and Molecular Physics, Sichuan University, Chengdu 610065, China
Geodynamics Research Center, Ehime University, Matsuyama 790-8577, Japan


† Corresponding author. E-mail: lei@scu.edu.cn

Abstract
Abstract

The first-order Raman spectroscopy of diamond exhibits splitting and redshift after the burst of high-pressure (160–200 GPa) and high-temperature (∼2000 K). The observed longitudinal optical (LO) and the transverse optical (TO) splitting of Raman phonon is related to the tensile-strain induced activation of the forbidden or silent Raman modes that arise in the proximity of the Brillouin zone center.

1. Introduction

Raman scattering can provide important information on lattice vibrational properties of the chosen materials of interest. For intrinsic crystals, only phonon modes in the proximity of the Brillouin zone (BZ) center are observed owing to the phonon wave vector selection rule. However, for the conservation of momentum, relaxation of the selection rule would be expected in small grain size, defect, impurity, vacancies, and local structural disorder.[1] Diamond has unique properties, such as wide bandgap, high bulk modulus, and ultra-high hardness.[24] These interesting properties have opened pathways to numerous applications of this material in the areas of microelectronic devices, coatings, optics, super-hard materials, etc.[5] The Raman spectroscopy of diamond has been extensively studied from a theoretical and experimental perspective.[69]

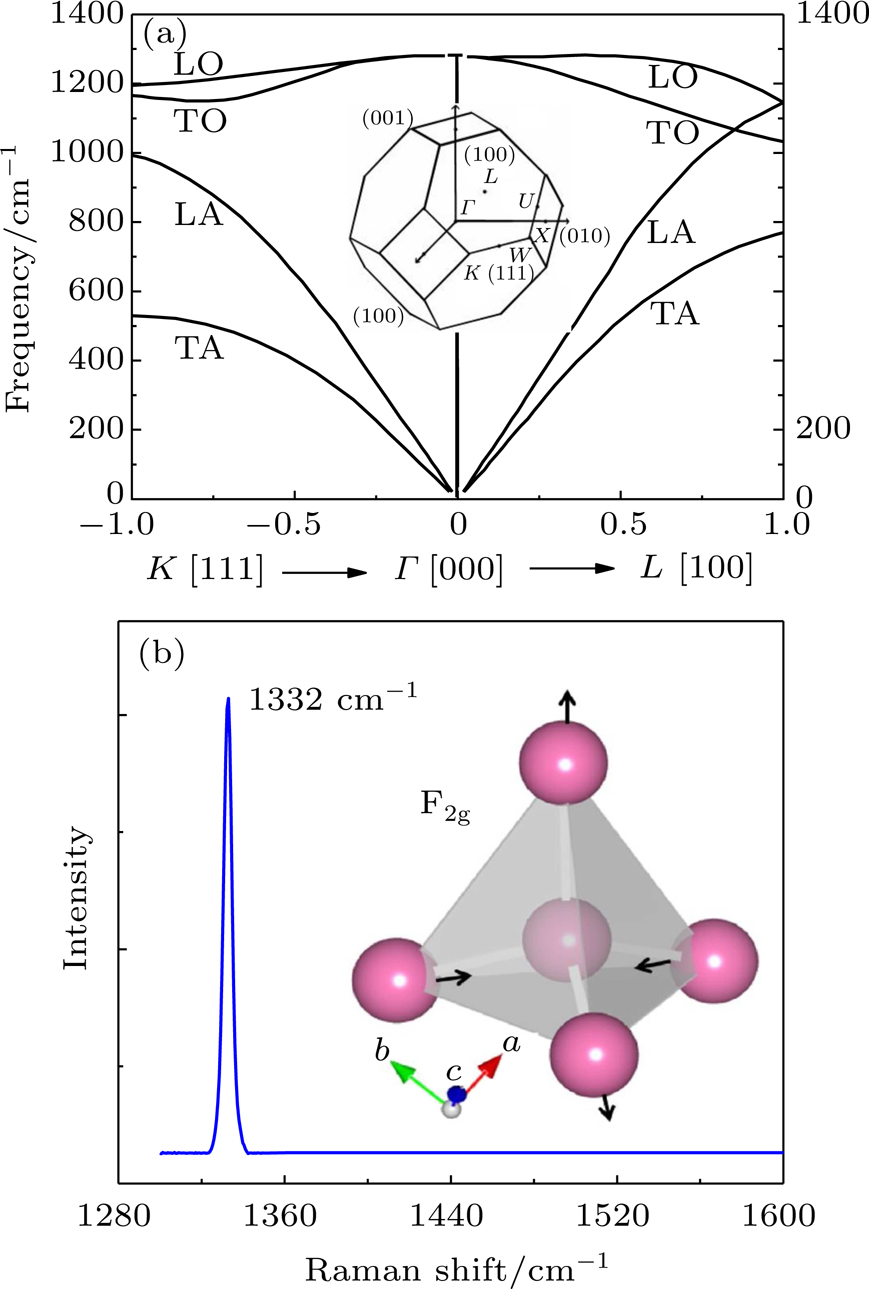
The first-order phonons of diamond can be classified in the space group Fd-3m.[10,11] There are two carbon atoms in the primitive unit cell and thus a single triply degenerate first-order phonon with symmetry .[12] At the Γpoint, the three optical branches are triply degenerate and the corresponding phonons belong to the irreducible representation as shown in Fig. 1(a).[13] In the absence of stress, the single crystal diamond exhibits a first-order fingerprint Raman peak at 1332 cm−1 which corresponds to the triply degenerate optical phonons (Fig. 1(b)).[10] The in situ high-pressure Raman spectroscopy by using diamond anvil cell (DAC) has shown great potential for investigating the properties of diamond under stress, and the high-frequency edge of the Raman band appears to be an excellent pressure-calibration standard as an alternative to the ruby pressure scale.[1416] In the case of the highly disordered diamond, there exists a pair of Raman bands at ∼1350 cm−1 and ∼1580 cm−1, which are designated as the D band and G band, respectively.[10,17] The Raman line width and D/G intensity ratio are related to the degree of structure order.[1719]

Fig. 1. (a) Dispersion curves for diamond in the (100) and (111) directions and Brillouin zone of cubic diamond. (b) A first-order fingerprint Raman peak at 1332 cm−1 and the Raman vibrational motions F2g of diamond.

Stress-induced lattice strain and distortion violates the translational invariance and breaks down the phonon wave-vector selection rule so that the phonon's mode off the center of the BZ can be active in Raman scattering. The question of whether or not the disorder-activated phonon behavior could retain some in situ high-pressure characteristics after the shock treatment has, therefore, to be addressed in order to better understand the dynamic of the aforementioned lattice distortion.

In this paper, we study the corresponding diamond phonon behavior under the shock treatment of high-temperature and high-pressure. We reveal the mechanism of disorder-activated Raman (DAR) phonon originated from the presence of tensile strain in the diamond lattice.

2. Experimental

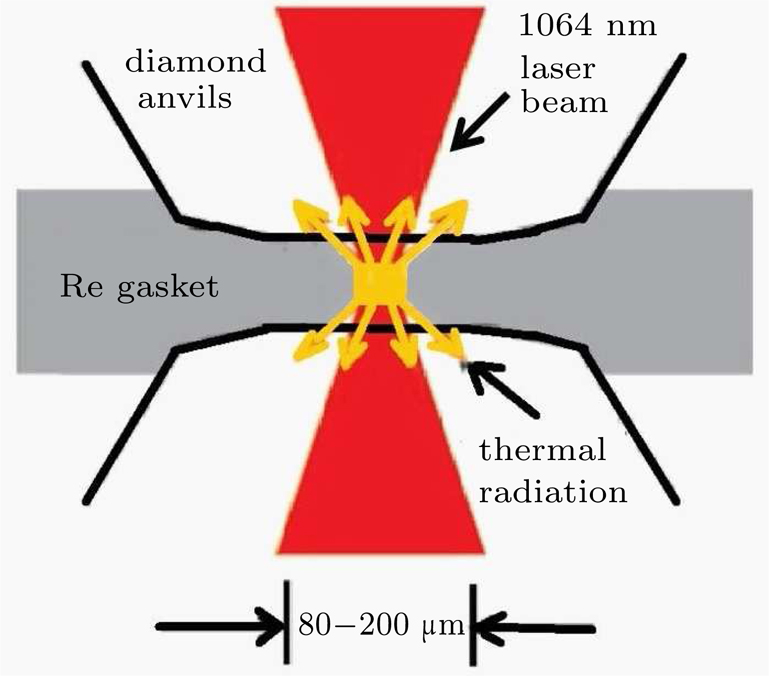
The ultrahigh-pressure Raman scattering experiment and double-sided laser-heated diamond anvil cell (LHDAC) experiment of this work were performed in Sichuan University. The pressure-generation experimental runs using a DAC were performed with a gasketed high-pressure technique.[20] We used the high-frequency edge of the diamond phonon as the pressure scale.[18] In this study, low-luminescence type IA diamonds with a culet diameter of were used for the anvils, and Re metal with the thickness of was used as the gasket. The diamond anvils were pressurized to the limit until catastrophic failure at the highest pressure (160–200 GPa) soon after laser heating (above 2000 K) with 1064 nm fiber laser (Fig. 2 ). The sample chamber, typically smaller than , was close to the spot size of focused laser beams. Some laser absorbing materials, such as high-pressure amorphous nitrogen, were filled in the sample chamber for laser heating. No pressure medium was used in all of our LHDAC experiments. Laser heating temperatures were either measured by the spectroradiometric method or estimated. The recovered broadened diamond anvils were investigated by scanning electron microscopy (SEM, Hitachi FESEM S4800, Japan), micro-focused x-ray diffraction (XRD, Rigaku, RAPIDII-V/DW, Cu , and micro-Raman spectroscopy.[21]

Fig. 2. Scheme of the double-side LHDAC experiments. There is a small sample chamber for laser heating, typically smaller than , and close to the spot size of focused laser beams. No pressure medium was used in all of our LHDAC experiments.

Raman scattering experiments were carried out on a custom-built confocal Raman spectrometry system in the backscattering geometry based on triple grating monochromator (Andor Shamrock SR-303i-B, EU) with an attached electron multiplying charge-coupled device (EMCCD, ANDOR Newton DU970P-UVB, EU); excitation was achieved by using a solid-state laser at 532 nm (RGB laser system, NovaPro, Germany) with a laser power of 50 mW for Raman measurement and collection by a 20×, 0.28 numerical aperture (N.A.) objective (Mitutoyo, Japan). The spectral resolution was within ±1 cm−1, and the spatial resolution was within .

3. Results and discussions

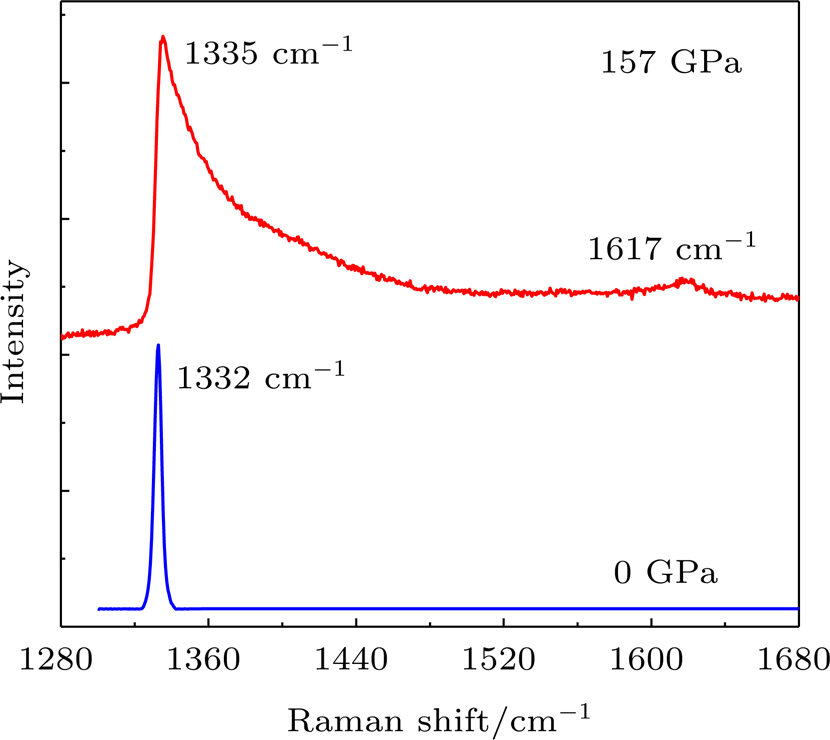
With applied pressure, the Raman shift of the culet center of loaded diamond anvils is found to exhibit asymmetric broadening and blue-shift (due to the normal compressive stress). In marked contrast to the intrinsic Raman line at 1332 cm−1, the Raman band of the diamond anvils loaded at 157 GPa exhibits significant broadening and blue-shift (Fig. 3 ). The high-frequency edge comes from the singlet mode with a larger frequency shift to 1617 cm−1 at 157 GPa. In our experiments, some of the diamond anvils experienced catastrophic breakdown upon heating by laser at ultra-high pressures. High temperature could relieve the stress, which is produced by cold compressing at room temperature. Typically, the pressure drops by 2–5 GPa after the laser heating at above 100 GPa. In this experimental run, the diamond anvils are pressurized up to ∼200 GPa until catastrophic breakdown. The SEM images of recovered diamond anvils (Fig. 4 ) show that the top of the recovered diamond anvils are completely damaged after the uncontrollable burst.

Fig. 3. Typical Raman spectra from the center of the diamond anvil culet at 0 GPa and 157 GPa.
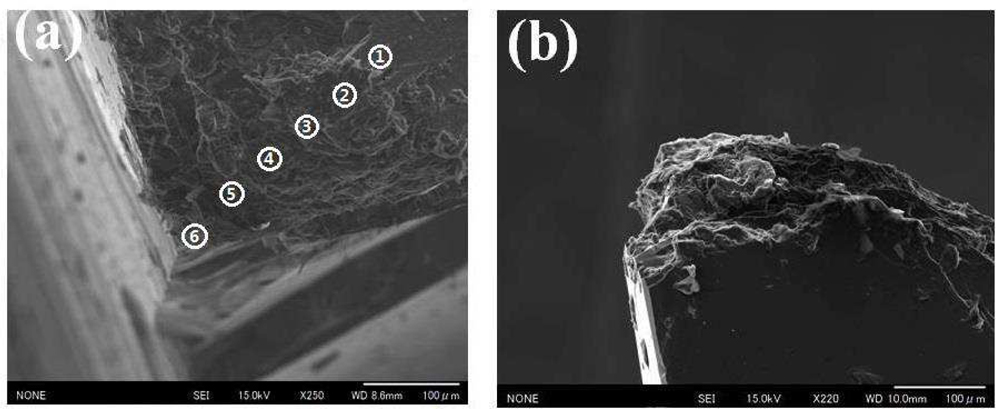
Fig. 4. The SEM images of recovered diamond anvils. The white number calibrates the test points of the sample, which corresponds to the Raman and micro-XRD measurements.
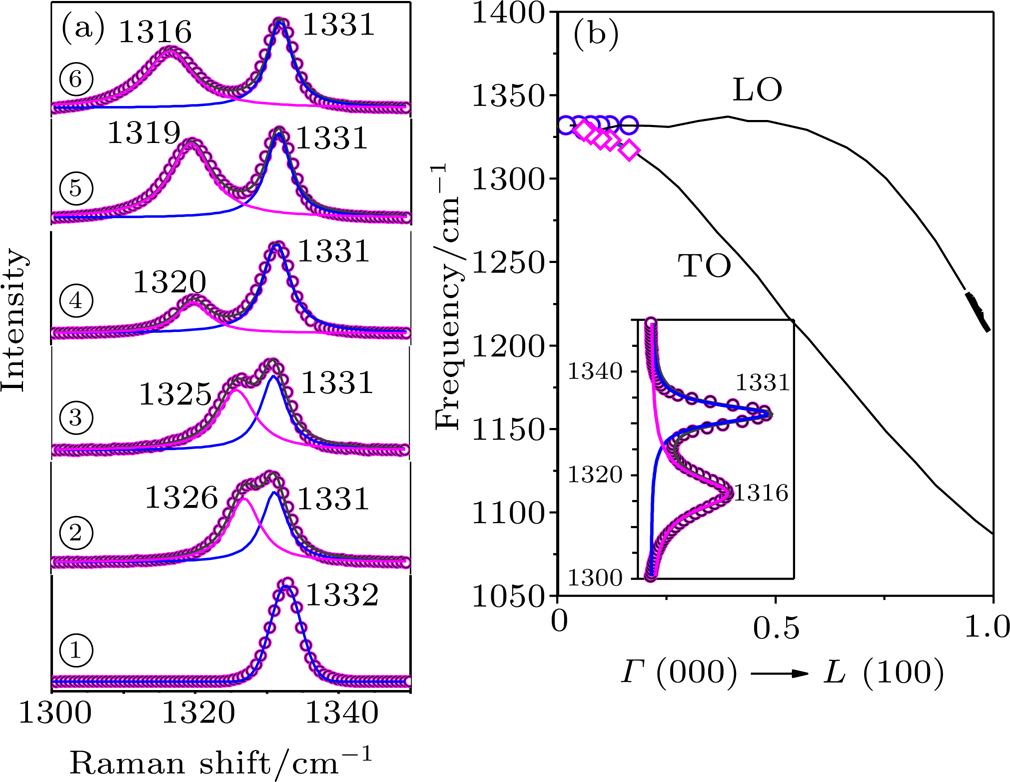
Figure 5(a) shows Raman spectra of a recovered diamond anvil for different sample regions. The sharp Raman line at 1332 cm−1 is the characteristic signature of the intrinsic diamond. The triply generate first-order Raman band of the diamond is split into a doublet band of 1316–1331 cm−1. The red shift of the Raman phonon modes originates from the stress-induced lattice tensile strain, and this tensile stain is attributed to the carbon bond-stretching among the mass of the atoms after the high-pressure and high-temperature burst.

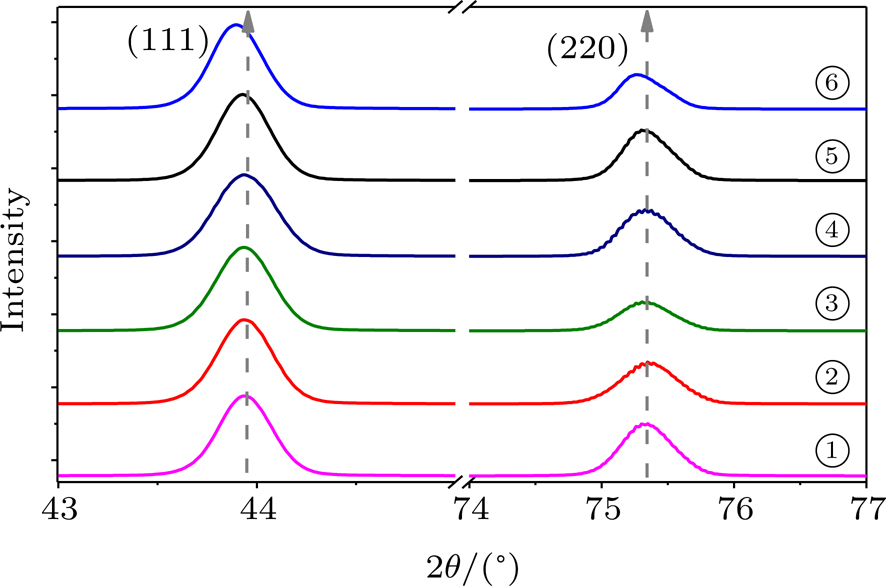
Fig. 5. (a) Raman spectra of the recovered diamond anvil for different sample regions and first-order Raman band splitting into a doublet band of 1316–1331 cm−1. It is a consistent one-to-one match between the positions in SEM image (fig. 4(a)) for measurement and the Raman data. (b) The splitting of LO and TO in the first Brillouin zone. The inset corresponds to the Raman peak of the rightmost LO and TO.

Considering that Raman excitation light has a very large wavelength (532 nm) when compared to the distance between neighboring atoms in a diamond crystal (∼0.154 nm), the momentum conservation selection rule basically implies that only phonons at BZ center ( ) are Raman active.[22,23] There are two main aspects that could change the Raman signature of a crystalline material. The first is the breakdown of momentum conservation, in conditions of translational symmetry breaking. This symmetry selection rule relaxation can give rise to DAR modes, which could result in new peaks in the Raman spectrum of the diamond. The second aspect is the increase in the Raman peak linewidths due to the phonon confinement. In a perfectly ordered system, the frequency uncertainty is governed by the phonon lifetime in the crystal lattice (Heisenberg uncertainty principle). Defects induced by tensile strain could generate boundaries that can confine the phonons within a region of length, thus generating an uncertainty in the phonon momentum value. The atomic vacancies, distortion, dislocations, and line-extension can introduce an sp2 bond disorder into the sp3-bond dominated diamond system.[24,25] Thus, the diamond bands can be broadened by the disorder or diminished phonon lifetimes resulting from lattice strain.[26,27]

The phonon modes (lattice vibrations) are usually presented by the irreducible representation based on the symmetry group of the crystals, which are essential to the interpretation of Raman spectra. The Raman shift is given by the phonon vibrational frequency, which is governed by the mass of the atoms and the strength of the chemical bonds. In our experiments, the first-order Raman peak splitting induced by tensile strain is consistent with the splitting of transverse optical (TO) and longitudinal optical (LO) in the first Brillouin zone, as shown in Fig. 5(b). The structural distortion induces relaxation of the selection rule at the center of the BZ and allows detection of the phonons away from BZ center.[28,29] In the case of diamond, this results in separation of TO mode and LO mode. Therefore, the phonon splitting in the low frequency corresponds to the LO–TO phonon splitting near the center of BZ.

Further evidence on tensile strain in the diamond lattice is provided by micro-focused XRD measurements. Figure 6 shows that (111) and (220) crystal faces of diamond shift to lower values of degrees in different sample regions. According to the equation , the carbon–carbon bonding is stretched and C–C stretching mode exists under the condition of high degree of disorder. This phenomenon also supports the phenomenon of Raman redshift and the TO–LO splitting of phonon.

Fig. 6. Micro-focused XRD of the recovered diamond anvil for different sample regions. It is a consistent one-to-one match between the positions in SEM image (fig. 4(a)) for measurement and the micro-XRD data.
4. Conclusions

The phonon splitting behaviors of diamond after a burst of high-pressure and high-temperature have been investigated by micro-Raman spectroscopy, micro-focused XRD, and SEM analysis. The double-splitting peak of diamond is due to the presence of tensile strain in the diamond lattice.

Acknowledgments

We thank Prof. Filippo Boi for helpful discussions and the Joint Usage/Research Center PRIUS (Ehime University, Japan).

Reference
[1] Lei L Ohfuji H Irifune T Qin J Zhang X Shinmei T 2012 J. Appl. Phys. 112 043501
[2] Bickford F R 1984 J. Chem. Educ. 61 401
[3] Wei L Kuo P K Thomas R L Anthony T R Banholzer W F 1993 Phys. Rev. Lett. 70 3764
[4] Ramdas A K Rodriguez S Grimsditch M Anthony T R Banholzer W F 1993 Phys. Rev. Lett. 71 189
[5] Angus J C Hayman C C 1988 Science 241 913
[6] Tubino R Birman J L 1977 Phys. Rev. 15 5843
[7] O’Brian L C Kubicek R L O’Brian J J 1994 J. Chem. Educ. 71 759
[8] Aponik A Marchozzi E Johnston C Wigal C T 1998 J Chem. Educ. 75 465
[9] Kulda J Kainzmaier H Strauch D Dorner B Lorenzen M Krisch M 2002 Phys. Rev. 66 241202
[10] Knight D S White W B 1989 J. Mater. Res. 4 385
[11] Chen G Balents L Schnyder A P 2009 Phys. Rev. Lett. 102 096406
[12] Cerdeira F Buchenauer C J Pollak F H Cardona M 1972 Phys. Rev. 5 580
[13] Nielsen O F Shabanova E Nissum M 2000 J. Chem. Educ. 77 633
[14] Boppart H van Straaten J Silvera I F 1985 Phys. Rev. 32 1423
[15] Hanfland M Syassen K Fahy S Louie S G Cohen M L 1985 Phys. Rev. 31 6896
[16] Lin J F Santoro M Struzhkin V V Mao H K Hemley R J 2004 Rev. Sci. Instrum. 75 3302
[17] Pantea C Qian J Voronin G A Zerda T W 2002 J. Appl. Phys. 91 1957
[18] Akahama Y Kawamura H 2006 J. Appl. Phys. 100 043516
[19] Kobashi K Nishimura K Kawate Y Horiuchi T 1988 Phys. Rev. 38 4067
[20] Liang H Peng F Fan C Zhang Q Liu J Guan S X 2017 Chin. Phys. 26 053101
[21] Feng L H Hu Q W Lei L Fang L M Qi L Zhang L L Xia Y H 2018 Chin. Phys. 27 026201
[22] Wagner J Ramsteiner M Wild C Koidl P 1991 Phys. Rev. 40 1817
[23] Nishitani-Gamo M Ando T Yamamoto K Watanabe K Denning P A Sato Y Sekita M 1997 Appl. Phys. Lett. 70 1530
[24] Solin S A Ramdas A K 1970 Phys. Rev. 1 1687
[25] Wu Q Yu L Ma Y Liao Y Fang R Zhang L Wang K 2003 J. Appl. Phys. 93 94
[26] Poizot P Laruelle S Grugeon S Dupont L Tarascon J M 2000 Nature 407 496
[27] Abdula D Nguyen K T Kang K Fong S Ozel T Cahill D G Shim M 2011 Phys. Rev. 83 205419
[28] Wagner J Wild C Koidl P 1991 Appl. Phys. Lett. 59 779
[29] Okada K Kanda H Komatsu S Matsumoto S 2000 J. Appl. Phys. 88 1674