Theoretical analysis of optical force density distribution inside subwavelength-diameter optical fibers
Zhang Yun-Yuan1, Yu Hua-Kang1, †, Wang Xiang-Ke1, Wu Wan-Ling1, Gu Fu-Xing2, Li Zhi-Yuan1, ‡
School of Physics and Optoelectronics, South China University of Technology, Guangzhou 510641, China
Shanghai Key Laboratory of Modern Optical System, Engineering Research Center of Optical Instrument and System (Ministry of Education), University of Shanghai for Science and Technology, Shanghai 200093, China


† Corresponding author. E-mail: hkyu@scut.edu.cn phzyli@scut.edu.cn

Project supported by the National Natural Science Foundation of China (Grant Nos. 11604230 and 11434017), the Guangdong Provincial Innovative and Entrepreneurial Research Team Program, China (Grant No. 2016ZT06C594), and the National Key Research and Development Program of China (Grant No. 2018YFA 0306200).

Abstract

We investigate the microscopic optical force density distributions respectively inside a subwavelength-diameter (SD) fiber with flat endface and inside one with oblique endface by using a finite-difference time-domain (FDTD) method. Optical force density distributions at the fiber endfaces can now be readily available. The complete knowledge of optical force density distributions not only reveal features regarding the microscopic near-field optomechanical interaction, but also provide straightforward explanations for the sideway deflections and other mechanical motions. Our results can provide a useful reference for better understanding the mechanical influence when light transports in a microscale or nanoscale structure and for developing future highly-sensitive optomechanical devices.

1. Introduction

Light and photon carry energy and momentum. Consequently optical force is of fundamental importance in light-matter interactions.[18] In particular, harnessing optical force at the micro-nanoscale is expected to be quite interesting, since it can become very significant in subwavelength dimensions. Indeed, various micro- and nanoscale structures have been developed to elucidate the optical force and yield multi-functional optomechanical devices under new physical principles.[920] Among various optomechanical structures, optical waveguides appear to be an ideal candidate for constructing high-performance optomechanical devices,[2133] benefiting from their favorable properties such as low optical loss, tight optical confinement, strong near-field interactions, and easy accessibility. In most of optical waveguide based optomechanical devices, theoretical or experimental investigations generally focus on the transverse dimensional optical force, which comes from the radiation pressure acting on the structure. And optical force in the longitudinal direction was rarely taken into considerations until She et al.’s observations.[34] In She et al.’s experiment, appreciable deflections of a subwavelength-diameter (SD) optical fiber were observed under a continuous-wave (CW) light excitation, which is believed to be strongly related to the longitudinal optical force acting on the fiber endface. Later on, extensive theoretical studies have been performed in order to clarify the origin of sideways deflections.[3540] To date, it has been clarified after numerous investigations that both the longitudinal and transverse optical force should be responsible for the sideway deflections.[37,40] However, detailed investigations of optical force density distributions have not been available yet, which would otherwise provide more information about near-field optomechanical interactions and shed light on new guidelines for constructing optimum SD fiber based optomechanical devices.

Considering the complex factors of SD fiber, including the fiber geometries (cross-sections and tilted endface) and physical effects (diffraction at the endface), numerical simulations are preferred in order to provide accurate analyses of momentum exchange or optical force actuations. For example, the finite-difference time-domain (FDTD) method has been demonstrated as a versatile numerical tool to calculate optical field and subsequently optical force density distributions in various cases of interest.[35,37,38,40] Apparently, the FDTD method could readily overcome the limitation of analytical model that only considers simplified case, and thus making optical force calculation in complicated structures feasible. It should be pointed out here that previously only optical momentum change or optical force, integrated over the entire transverse cross-sectional plane of the SD fiber, has been examined as a function of fiber axis. Recalling the subwavelength-scale transverse dimension of SD fiber, it is readily expected that the fiber deformation would be highly sensitive to the inner or boundary force density distributions. Therefore, force density distribution should have its physical significance and the integral process would inevitably brush out the information regarding the detailed force density distributions.

Here we study the microscopic optical force density distributions around SD fiber endface by the numerical FDTD method. The information about the optical force density distribution, both inside and at the boundary of SD fiber endface, is for the first time illustrated. In a broader aspect, our study of optical force density distribution within micro and nano optical structures would bring in-depth physical insights and pictures about mechanical influences when light transports in these complicated structures and devices. Our results are helpful for developing future highly-sensitive optomechanical devices.

2. Numerical model

As schematically shown in Fig. 1, SD fibers with two kinds of end facets (one is flat and the other is oblique) are simulated and investigated. The cross sections of SD fibers are assumed to be circular. The Cartesian coordinate is shown in the inset of Fig. 1, where its origin is located on the left of the SD fiber. A CW 980-nm light source with quasi-y polarization is launched from the left side and propagates along the fiber as indicated by the red arrow in Fig. 1. In this paper, we focus on the optical force associated with fundamental mode (i.e., HE11 mode) of SD fibers. For the convenience of comparisons, the z-directional lengths of fibers (including the titled endface) are all set to be 4 μm, the diameter is 450 nm, and the refractive index of silica SD fiber is 1.45 at a wavelength of 980 nm. The media are supposed to be linear and transparent considering the negligible absorption of silica in the near-infrared spectral range. And the SD fiber is suspended in free-space. The simulation region is meshed with a cell size of 10 nm and terminated by perfect matching layer (PML) boundary condition.

Fig. 1. (color online) Schematic models of SD fiber structures, respectively, with (a) flat endface and (b) oblique endface (with an angle of θ as depicted) for numerical simulations. Inset shows Cartesian coordinates. Light in the guided mode of the SD fiber transports from left to right when the endface ignites optical force and mechanical motion of the SD fiber.
3. Numerical results

To calculate the optical force density distribution, both the Lorentz formula and Einstein formula have been widely used in various cases.[41,42] As indicated in many references, the equivalence of Lorentz and Einstein-Laub formulations has been demonstrated.[41,43] Since the rare experimental evidence available now seems to favor the Einstein-Laub formulation,[44] in the following sections we will calculate the optical force density distribution based on the Einstein-Laub postulate within each discretized cell of FDTD simulations, i.e.,

where ⟨Fi⟩ represents the time-averaged force density per unit volume, E and H are the electric and magnetic fields as a function of spatial coordinates (the superscript asterisk * denotes the complex conjugate), P = ε0 (ε − 1) E is the electric polarization density within the fiber, ε0 and μ0 are the vacuum permittivity and permeability respectively, and ε is the dielectric constant of silica.

Firstly we investigate the optical force density distribution inside an SD fiber with flat endface. In order to eliminate the influence of high-order modes, the diameter of SD fiber is chosen to be 450 nm, and thus maintaining the single mode operation. Figure 2 shows the cross-sectional plots of time-averaged optical force-density components ⟨Fx⟩, ⟨Fy⟩, and ⟨Fz⟩ through the central planes of 450-nm-diameter SD fiber with flat endface plots. A 980-nm fundamental mode (i.e., HE11 mode) with quasi-y polarization is excited at z = 0 μm and propagates along the SD fiber. The left column in Fig. 2 shows the plots of ⟨Fx⟩, the middle column shows the ⟨Fy⟩ plots and the right column shows the ⟨Fz⟩ plots. From the left column, we can conclude that ⟨Fx⟩ tends to give a compressive force inside the optical fiber; from the middle column, ⟨Fy⟩ also acts on the fiber in a compressive manner. However, the distributions of transverse optical force density (i.e., ⟨Fx⟩ and ⟨Fy⟩) on the boundary are quite complicated. It can be easily concluded from Figs. 2(a) and 2(b) that the transverse optical force densities on the boundary show substantially azimuthal dependence, deviating from the cylindrically symmetry. To understand this point, we should take a close look at the field distributions of fundamental mode used here. As is well known, the deviation of the fundamental mode HE11 in SD fiber from the approximate mode LP01 becomes quite distinct, as a result of the high contrast of refractive index between SD fiber and surrounding vacuum, especially in the vicinity of the fiber surface.[45] Considering the quasi-y polarized fundamental mode used in our simulations, the major electric field almost aligns along the y direction, leading to much larger optical force density ⟨Fy⟩ on the transverse boundary along the y direction (see Fig. 2(b)). Besides, the direction of transverse optical force density on the boundary is substantially different from that of the force density inside the SD fiber, but not dominant for the total optical force when considering the fact that the boundary density is only composed of a thin grid layer defined in the FDTD simulations. Therefore, it is clear that the transverse optical force (i.e., ⟨Fx⟩ + ⟨Fy⟩) would resultantly give rise to a compressive actuation pointing inward the SD fiber, despite the force density on the boundary showing an expansive actuation. From Fig. 2(c), we can readily find that the distribution of ⟨Fz⟩ is quite similar to the optical density of fundamental mode of SD fiber, with its maximum force density located in the center of the fiber cross section. Because of the endface reflection, standing wave is created inside the SD fiber. And the clear periodic oscillation of optical force density profiles can be observed in the xz and yz planes for all optical force density components. The period is found to be π/β originating from the interference between the incident and reflected waves, which is already well-understood.[36] While the transverse force-density components (i.e., ⟨Fx⟩ and ⟨Fy⟩) are always compressive, ⟨Fz⟩ periodically alternates its direction (i.e. pointing up or down with respect to the position inside the oscillating fringe). And the oscillation amplitude of the optical force density generally decreases with the increase of distance deviating from the fiber end facets. This can be understood that the reflected wave would encounter radiation before it stabilizes as guiding wave, with considering the subwavelength-dimension of fiber here. Since the geometry of SD fiber with flat endface is axially symmetric, both the optical field and force density are mirror-symmetric as a result of the incident quasi-y polarized fundamental mode, giving rise to total vanishing transverse optical force.

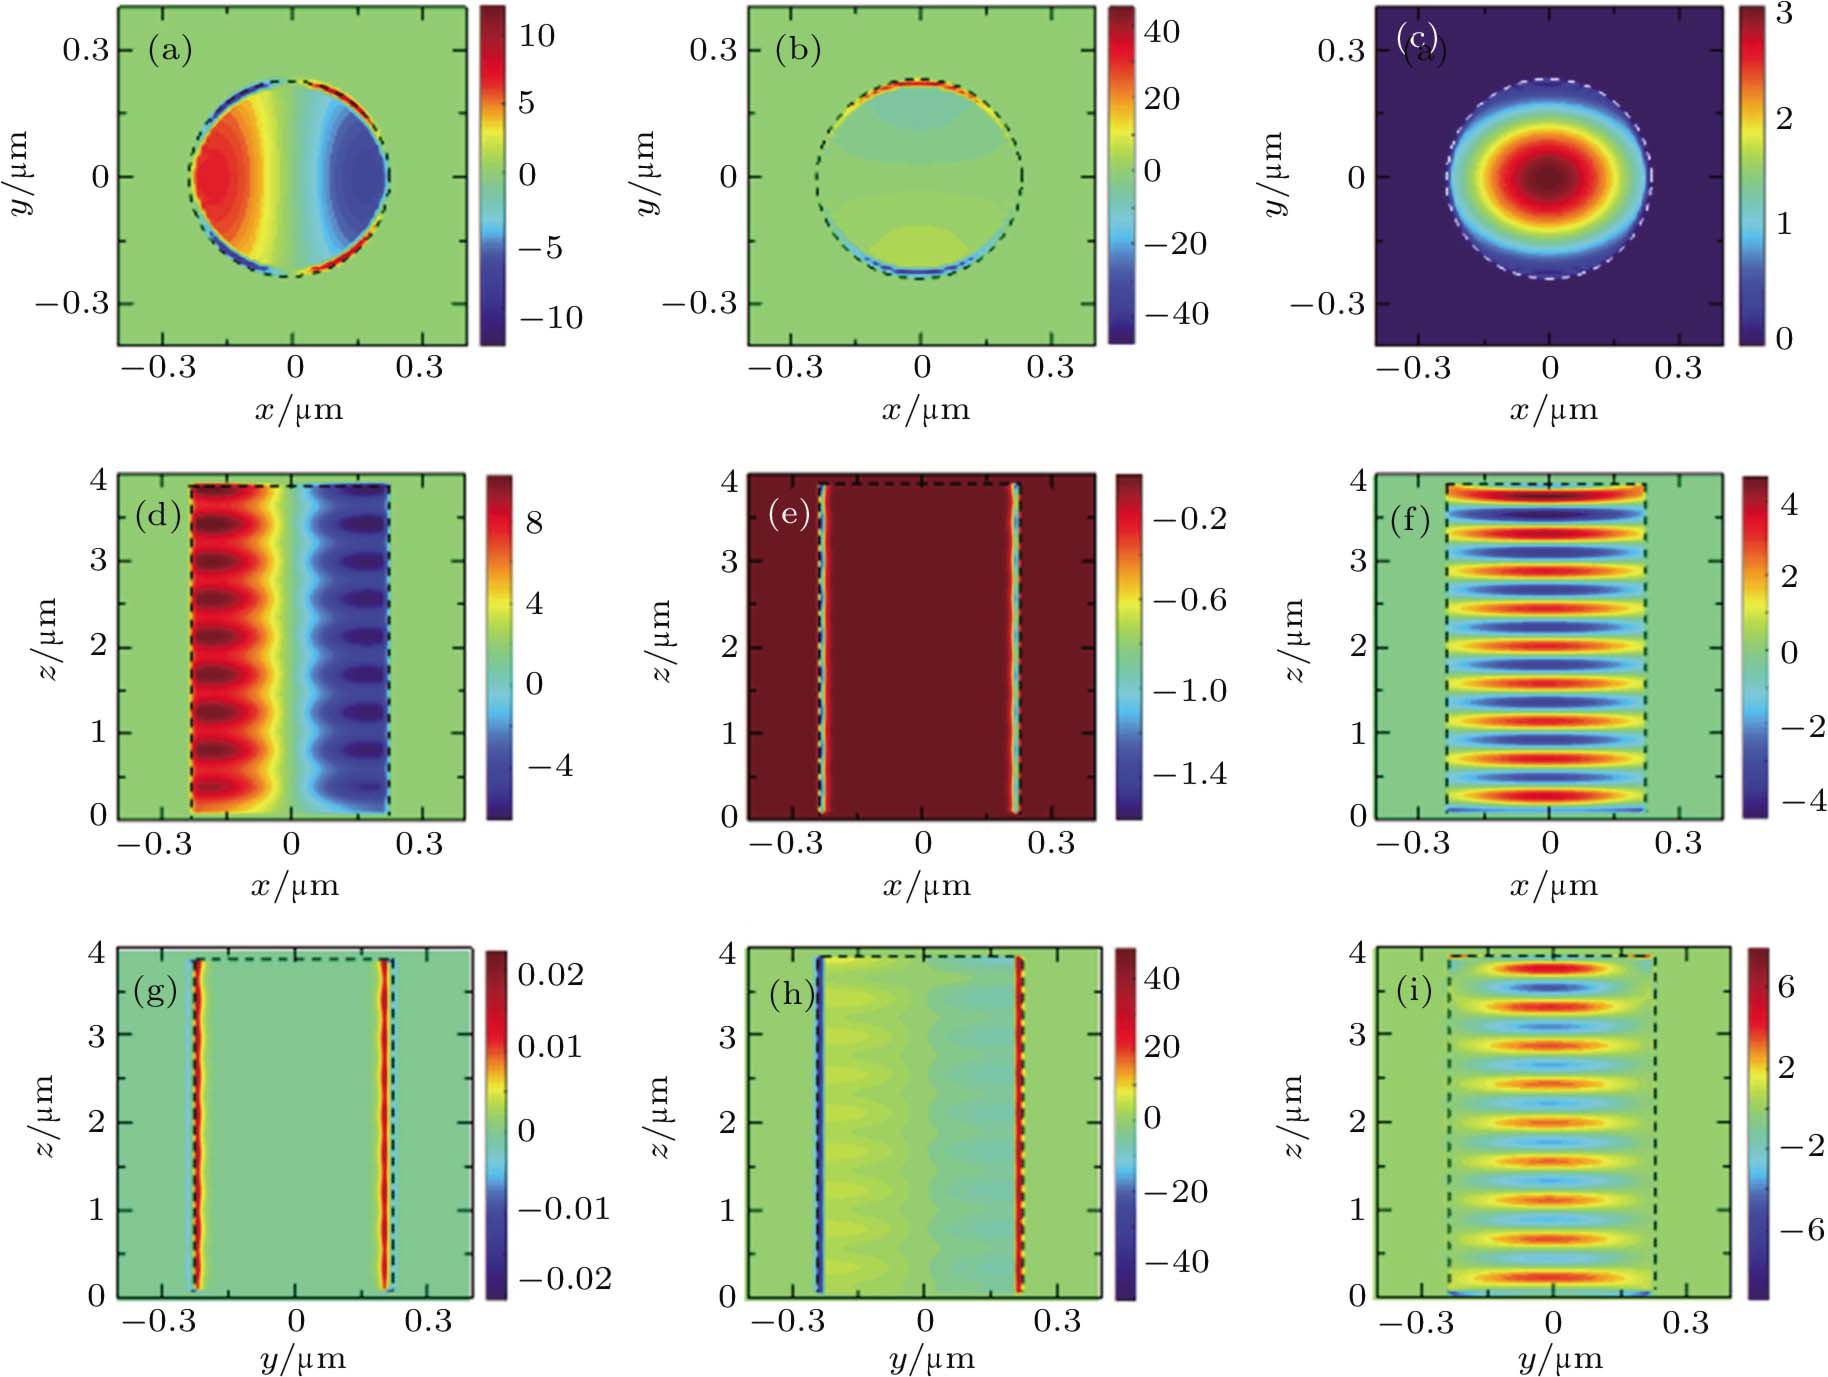
Fig. 2. (color online) Cross-sectional plots of time-averaged optical force-density components ⟨Fx⟩, ⟨Fy⟩, and ⟨Fz⟩ through central plane of 450-nm-diameter SD fiber with flat endface. A 980-nm fundamental mode (i.e., HE11 mode) with quasi-y polarization is excited at z = 0 μm and propagates in positive z-direction along the SD fiber. The plots of calculated optical force density correspond to incident optical power Pinc = 3.06 × 10⁻¹⁶ W. Color scale bar shows force density in units of μN/m3. (a) ⟨Fx⟩, (b) ⟨Fy⟩, (c) ⟨Fz⟩, respectively in central xy plane with z = 2 μm. (d) ⟨Fx⟩, (e) ⟨Fy⟩, (f) ⟨Fz⟩, respectively in central xz plane with y = 0 μm. (g) ⟨Fx⟩, (h) ⟨Fy⟩, (i) ⟨Fz⟩, respectively in central yz plane with x = 0 μm. Dashed lines represent profile of SD fiber.

We further investigate the force density distribution inside an SD fiber with oblique endface. Specifically, all the simulation parameters are kept at the values the same as those in the preceding discussion except for the oblique-cut endface (θ = 20 °C). Although SD fiber with oblique endface was discussed before,[39,40] the study there only focuses on the calculation of total optical force component and discussion of its contribution to the sideway deflection, resulting in the details of force density distributions miss. Figure 3 shows the computed cross-sectional plots of time-averaged optical force-density components ⟨Fx⟩, ⟨Fy⟩ and ⟨Fz⟩ through the corresponding planes of SD fiber. Specifically, several transverse cross sections with varying distance to the endface of SD fiber are considered and illustrated in Figs. 3(d)3(o). The left column of Fig. 3 shows the ⟨Fx⟩ plots, the middle column shows the ⟨Fy⟩ plots, and the right column shows the ⟨Fz⟩ plots. The transverse optical forces, i.e., ⟨Fx⟩ and ⟨Fy⟩, together contribute to a symmetrically compressive behavior in the straight part of the SD fiber. However, the symmetry is broken in the oblique part of fiber tip, leading to asymmetric distributions of ⟨Fx⟩. This phenomenon can be readily seen from Figs. 3(a), 3(d), 3(g), 3(j), and 3(m). The physical origin of transverse optical force of oblique fiber endface as demonstrated[40] can now be visualized quite straightforward. As seen in Fig. 3(m), closing to the fiber oblique endface, the asymmetric ⟨Fx⟩ distribution shows dominantly positive value in the whole transverse xy cross section, thus leading to deflection apparently in the positive-x direction. As the endface reflection greatly decreases as a result of oblique endface, no obvious standing wave pattern of ⟨Fx⟩ distributions is observed (see Fig. 3(a)). Since the oblique enface of SD fiber is perpendicular to the xz plane, the simulated geometry is apparently symmetric with respect to the xz plane as shown in Figs. 3(b), 3(e), 3(h), 3(k), and 3(n). It is reasonable that the compressive ⟨Fy⟩ is still symmetric at the fiber tip, and would not contribute to the fiber sideway deflection in the y direction.

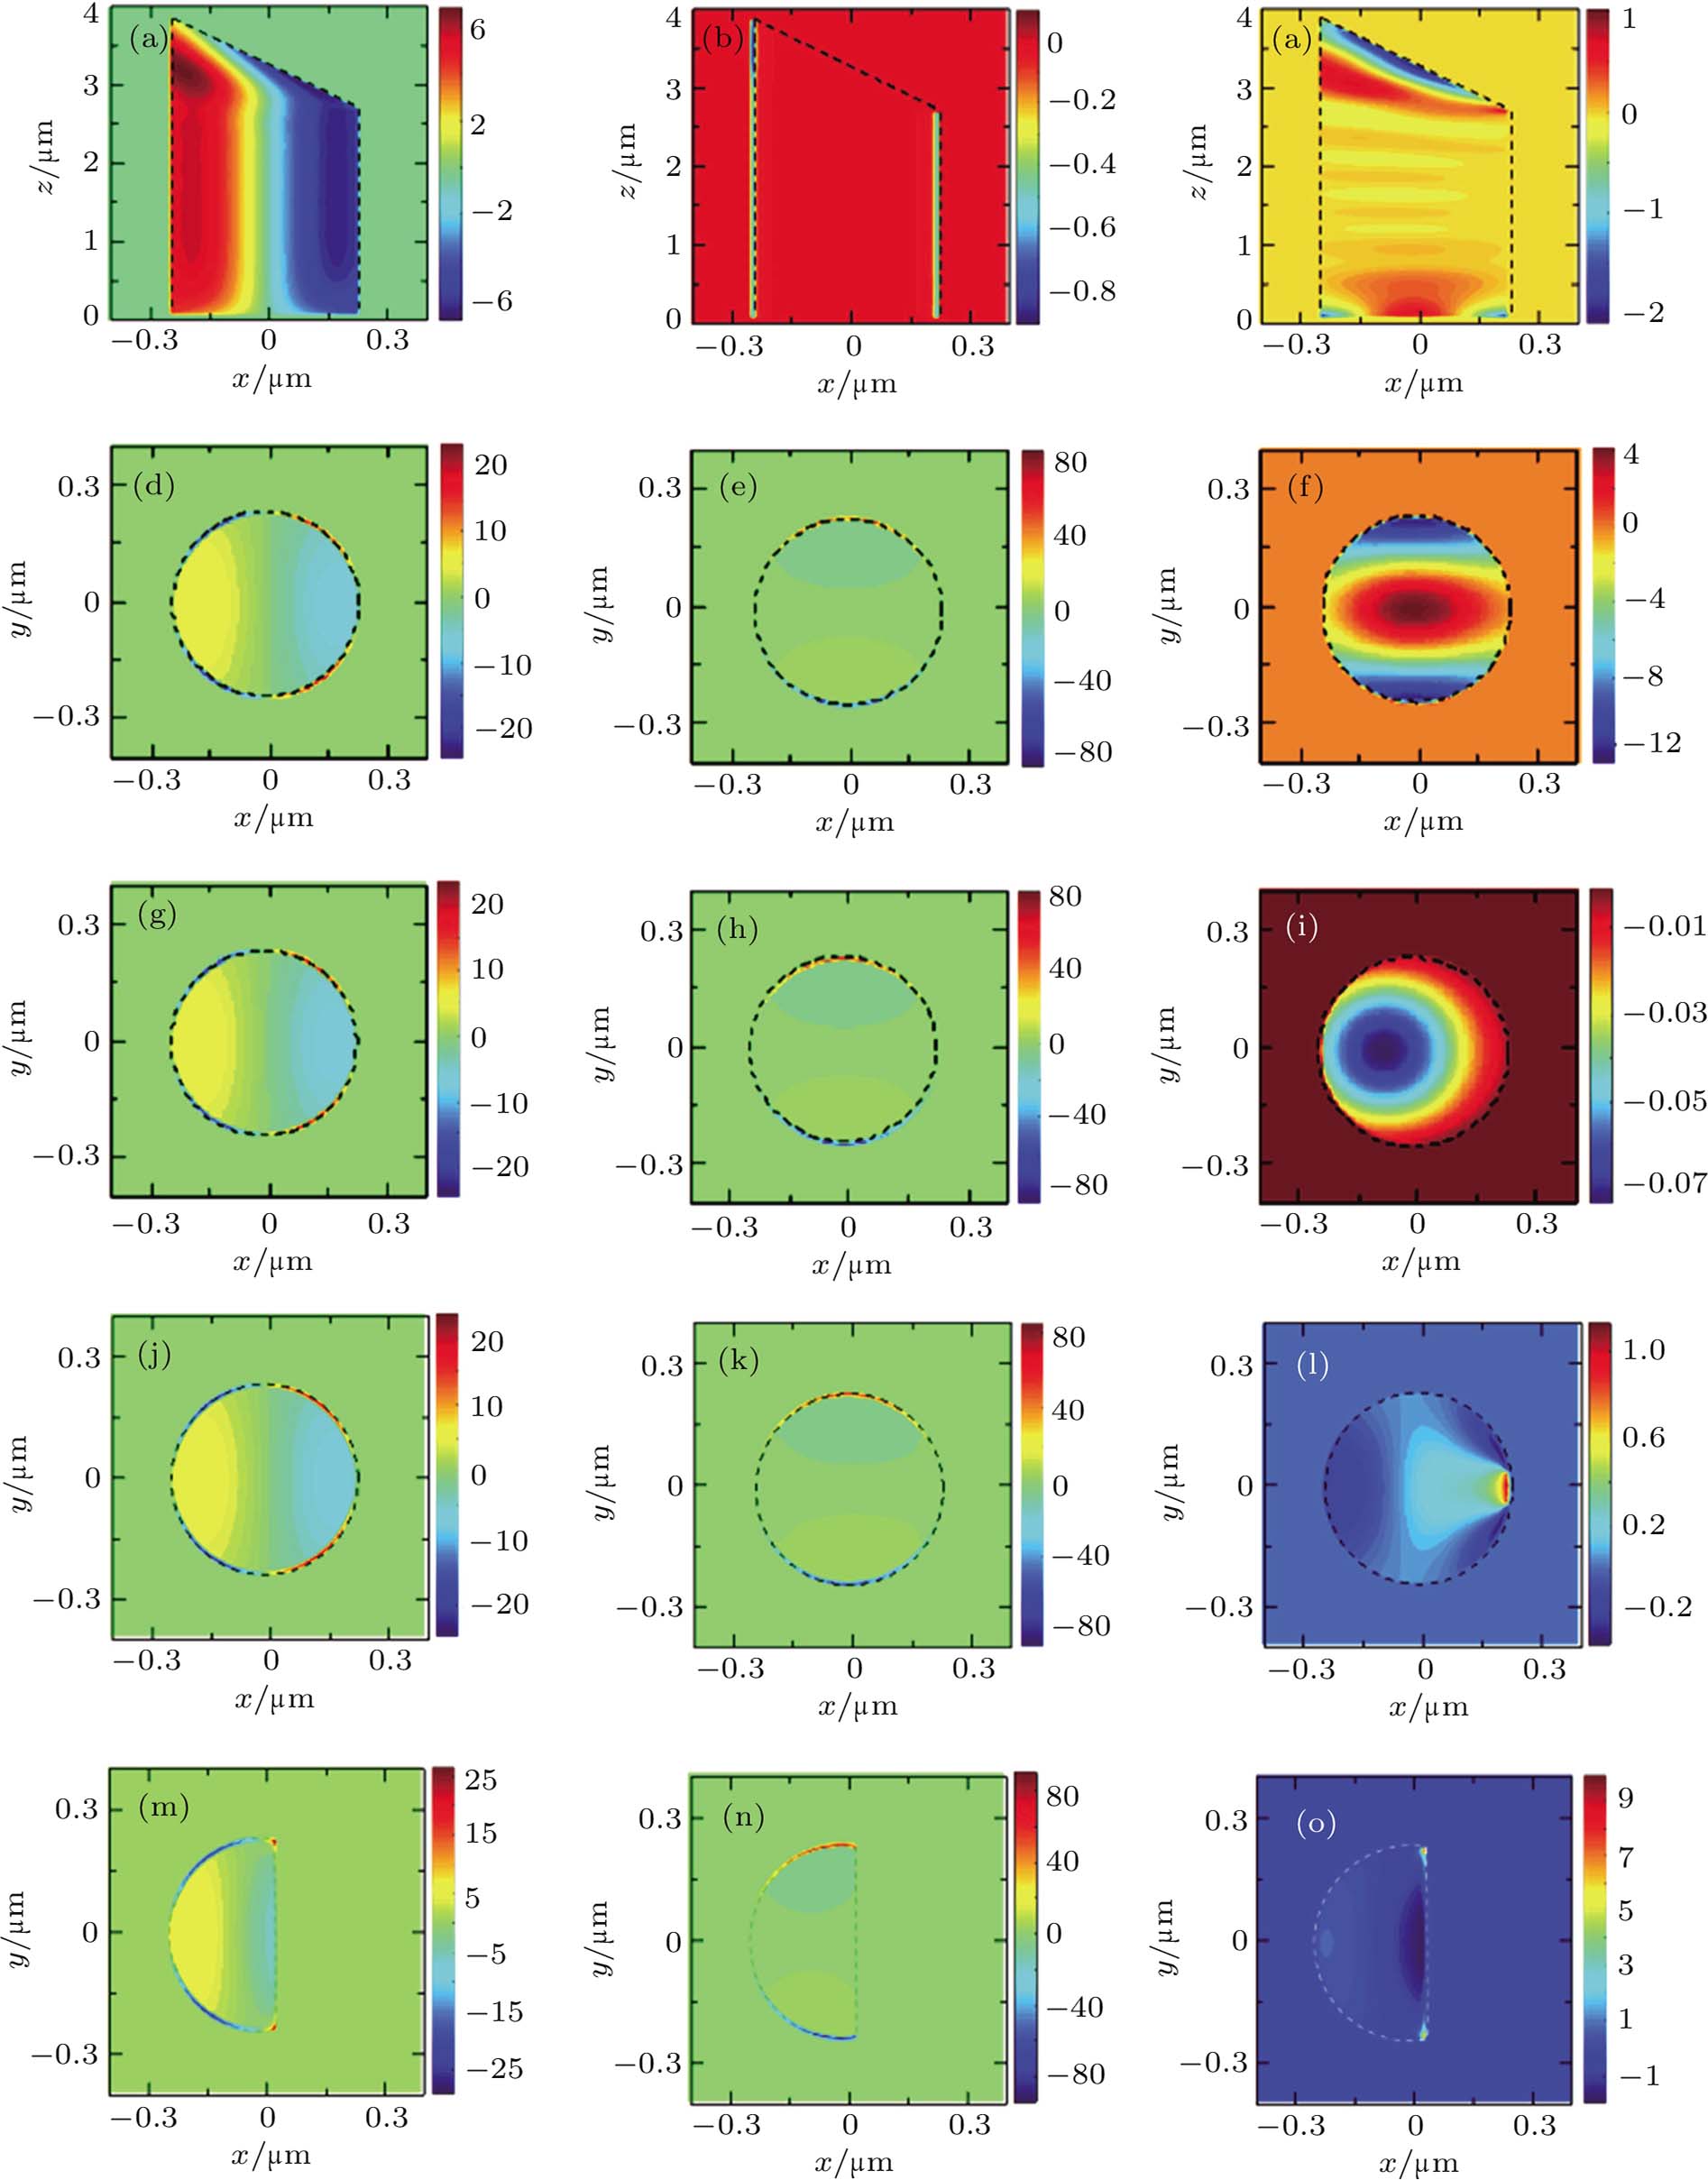
Fig. 3. (color online) Cross-sectional plots of time-averaged optical force-density components ⟨Fx⟩, ⟨Fy⟩, and ⟨Fz⟩, through central planes of 450-nm-diameter SD fiber with oblique endface. 980-nm fundamental mode (i.e., HE11 mode) with quasi-y polarization is excited at z = 0 μm and propagates along SD fiber (whose length occupies the range from z = 0 μm to z = 4 μm). Plots of calculated optical force density correspond to incident optical power Pinc = 3.06 × 10⁻¹⁶ W. Color scale bar shows force density in units of μN/m3. (a) ⟨Fx⟩, (b) ⟨Fy⟩, (c) ⟨Fz⟩, respectively in central xz plane (y = 0 μm). ⟨Fx⟩, ⟨Fy⟩, and ⟨Fz⟩, respectively in xy plane with z = 1.3 μm (second row, i.e., (d)–(f)), z = 1.92 μm (third row, i.e., (g)–(i)), z = 2.74 μm (fourth second row, i.e., (j)–(l)), z = 3.255 μm (bottom row, i.e., (m)–(o)). The dashed line represents the profile of the SD fiber.

For the longitudinal optical force density distribution, i.e., ⟨Fz⟩ as shown in right column, it is quite different from the case of SD fiber with flat endface. On the one hand, because of the greatly reduced reflection from the endface, periodic oscillating fringe of optical force density profile is no longer observed as shown in Figs. 3(a)3(c). This is quite different from the case of flat enfaces as shown in Figs. 2(d)2(f). On the other hand, the mirror-symmetry of ⟨Fz⟩ distribution is not kept anymore due to the oblique endface (as shown in Fig. 3(c)), thus none of the force density profiles of ⟨Fz⟩ is centric in the transverse cross section as shown in Figs. 3(f), 3(i), 3(l), and 3(o) with the distances to the endface of SD fiber varying. For z = 1.3 μm, the force density profile of ⟨Fz⟩ is still centrically distributed and generally positive (Fig. 3(f)); for z = 1.92 μm, the force density profile of ⟨Fz⟩ shifts towards the left side of the fiber and becomes negative (Fig. 3(f)). For z = 2.74 μm, the force density profile of ⟨Fz⟩ shifts to the right side of the fiber and becomes overall positive (Fig. 3(f)). For z = 3.255 μm, the transverse cross section turns to be half circular due to the oblique endface, the force density profile of ⟨Fz⟩ now becomes half positive on the right side and half negative on the left side, and meanwhile becomes exceptionally large in the corner of the half circular cross section. In view of the SD scale of the fiber, this microscopic distribution of longitudinal force density will definitely bring in non-zero bending torque to make the fiber tip deflect towards the positive x direction. And the longitudinal force density together with the transverse optical force density would contribute to the optomechanical action on the SD fibers. From the above analyses, the detailed microscopic optical force density distributions would provide more information and give straightforward new guidelines for designing high-performance optomechanical devices.

4. Conclusions

Owing to the feasibility of the FDTD method, the direct computations of the microscopic optical force density distributions around SD fiber endfaces are successfully performed. After taking a close look at the profiles of the force density distributions along different directions, more details are revealed for the first time, based on which we can readily study the near-field optomechanical interactions in a straightforward manner. For a nanofiber with flat endface, we find that transverse optical force is compressive while longitudinal optical force periodically alternates its direction along the nanofiber. For a nanofiber with oblique endface, it is found that transverse optical force will become significant due to the oblique endface induced symmetry breaking; and the asymmetrically distributed longitudinal optical force will eventually bring in non-zero bending torque, possibly another mechanism to induce sideway deflections. Therefore, we could conclude here that only the complete consideration of optical force density distributions, especially for SD fibers with complicated microscopic structures, e.g., oblique endface, can provide precise prediction on optomechanical actuation of SD fibers. Our results are helpful for studying and constructing future highly-sensitive optomechanical devices.

Reference
[1] Kippenberg T J Vahala K J 2007 Opt. Express 15 17172
[2] Brennecke F Ritter S Donner T Esslinger T 2008 Science 322 235
[3] Li M Pernice W H Xiong C Baehr-Jones T Hochberg M Tang H X 2008 Nature 456 480
[4] Eichenfield M Chan J Camacho R M Vahala K J Painter O 2009 Nature 462 78
[5] Nunnenkamp A Børkje K Girvin S M 2011 Phys. Rev. Lett. 107 063602
[6] Aspelmeyer M Meystre P Schwab K 2012 Phys. Today 65 29
[7] Li J Guo H Li Z Y 2013 Photon. Res. 1 28
[8] Aspelmeyer M Kippenberg T J Marquardt F 2014 Rev. Mod. Phys. 86 1391
[9] Povinelli M L Lončar M Ibanescu M Smythe E J Johnson S G Capasso F Joannopoulos J D 2005 Opt. Lett. 30 3042
[10] Zhu X Ling Y Huang G S Zhou H Dai Y Wu K Gan Z 1998 Chin. Phys. L. 15 165
[11] Kippenberg T J Rokhsari H Carmon T Scherer A Vahala K J 2005 Phys. Rev. Lett. 95 033901
[12] Park Y S Wang H 2009 Nat. Phys. 5 489
[13] Wiederhecker G Chen L Gondarenko A Lipson M 2009 Nature 462 633
[14] Liu Y Xiao Y Luan X Wong C W 2013 Phys. Rev. Lett. 110 153606
[15] Liu Y C Xiao Y F Chen Y L Yu X C Gong Q 2013 Phys. Rev. Lett. 111 083601
[16] Liao S Min S C Dong J J 2014 Chin. Phys. 23 124211
[17] Lu X Y Jing H Ma J Y Wu Y 2015 Phys. Rev. Lett. 114 253601
[18] Balram K C Davanço M I Song J D Srinivasan K 2016 Nat. Photon. 10 346
[19] Shen Z Zhang Y L Chen Y Zou C L Xiao Y F Zou X B Sun F W Guo G C Dong C H 2016 Nat. Photon. 10 657
[20] Yang D Gao F Cao Q T Wang C Ji Y Xiao Y F 2018 Photon. Res. 6 99
[21] Lizé Y K Mägi E C Ta’eed V G Bolger J A Steinvurzel P Eggleton B J 2004 Opt. Express 12 3209
[22] Eichenfield M Camacho R Chan J Vahala K J Painter O 2009 Nature 459 550
[23] Li M Pernice W H Tang H X 2009 Nat. Nanotechnol. 4 377
[24] Li M Pernice W Tang H 2009 Nat. Photon. 3 464
[25] Yang X Liu Y Oulton R F Yin X Zhang X 2011 Nano Lett. 11 321
[26] Li Y Hu Y J 2013 Chin. Phys. 22 034206
[27] Van Laer R Kuyken B Van Thourhout D Baets R 2015 Nat. Photon. 9 199
[28] Monifi F Zhang J Özdemir Ş Peng B Liu Y Bo F Nori F Yang L 2016 Nat. Photon. 10 399
[29] Lu J Yang H Zhou L Yang Y Luo S Li Q Qiu M 2017 Phys. Rev. Lett. 118 043601
[30] Huang Q Lee J Arce F T Yoon I Angsantikul P Liu J Shi Y Villanueva J Thamphiwatana S Ma X Zhang L Chen S Lal R Sirbuly D J 2017 Nat. Photon. 11 352
[31] Ma K Han S Zhang L Shi Y Dai D 2017 Opt. Express 25 30876
[32] Yu X Zhi Y Tang S Li B Gong Q Qiu C Xiao F 2018 Light Sci. Appl. 7 18003
[33] Tang S Liu S Yu X Song Q Gong Q Xiao F 2018 Adv. Mater. 30 1800262
[34] She W Yu J Feng R 2008 Phys. Rev. Lett. 101 243601
[35] Mansuripur M Zakharian A 2009 Phys. Rev. 80 023823
[36] Brevik I Ellingsen S 2010 Phys. Rev. 81 011806
[37] Yu H Fang W Gu F Qiu M Yang Z Tong L 2011 Phys. Rev. 83 053830
[38] Yu J Chen C Zhai Y Chen Z Zhang J Wu L Huang F Xiao Y 2011 Opt. Express 19 25263
[39] Brevik I 2014 Phys. Rev. 89 025802
[40] Xiao T Yu H Zhang Y Li Z 2018 Opt. Express 26 6499
[41] Mansuripur M Zakharian A R Wright E M 2013 Phys. Rev. 88 023826
[42] Bethune-Waddell M Chau K J 2015 Rep. Prog. Phys. 78 122401
[43] Barnett S M Loudon R 2006 J. Phys. B-At. Mol. Opt. Phys. 39 S671
[44] Ashkin A Dziedzic J 1973 Phys. Rev. Lett. 30 139
[45] Le Kien F Liang J Hakuta K Balykin V 2004 Opt. Commun. 242 445