Raman spectroscopy characterization of two-dimensional materials
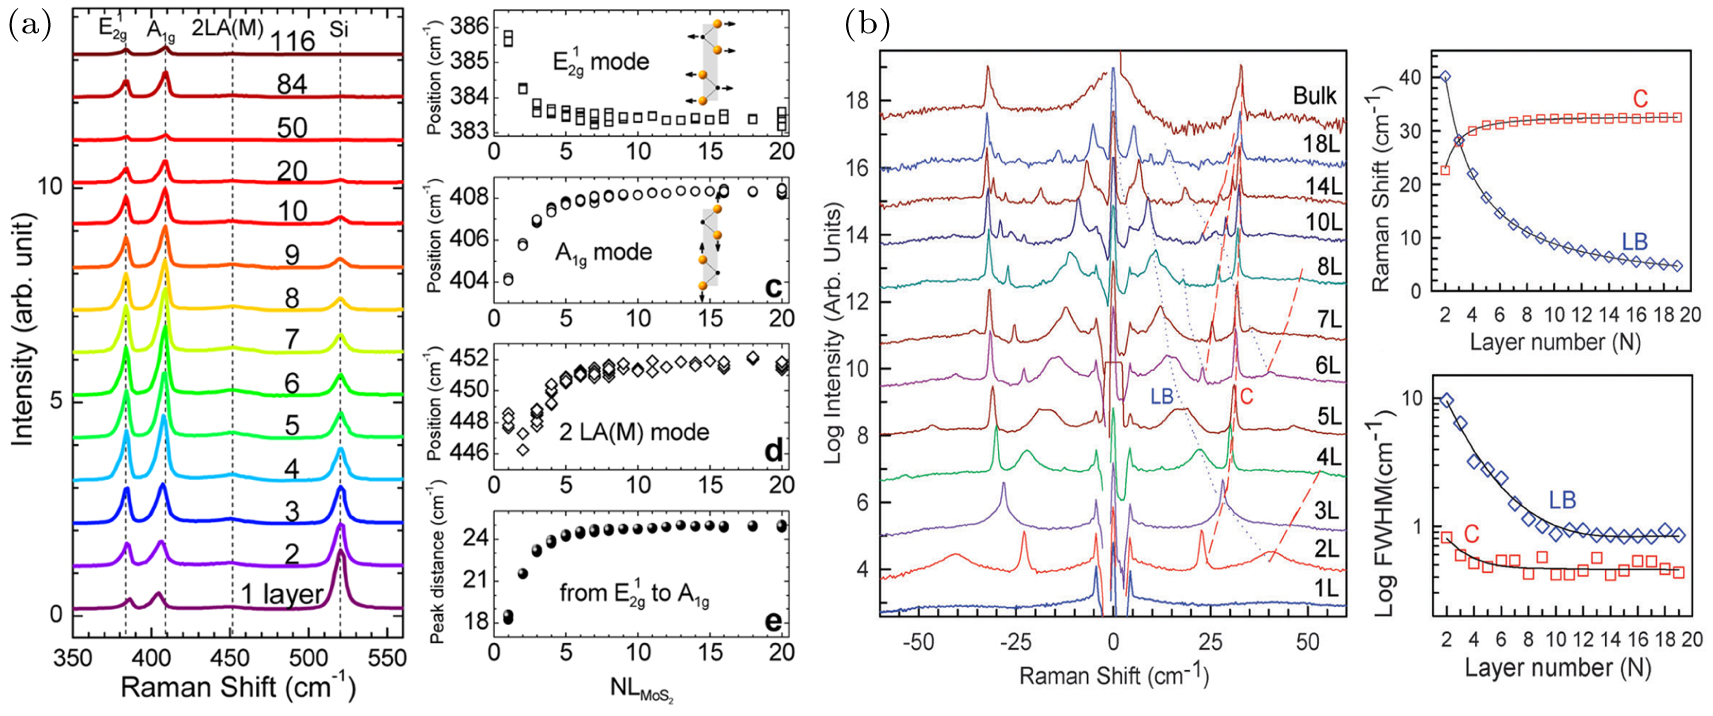
(color online) High- and low-frequency Raman spectra of MoS2 with various thickness. (a) Typical Raman spectra of 1L to bulk MoS2 (left), and the positions of the
Raman spectroscopy characterization of two-dimensional materials |
|
(color online) High- and low-frequency Raman spectra of MoS2 with various thickness. (a) Typical Raman spectra of 1L to bulk MoS2 (left), and the positions of the |
| |