

High-pressure studies on heavy fermion systems
[Chen Ye, Weng Zongfa, Michael Smidman, Lu Xin†,  , Yuan Huiqiu‡, ]
, Yuan Huiqiu‡, ]
|
|


† Corresponding author. E-mail:
‡ Corresponding author. E-mail:
Project supported by the National Basic Research Program of China (Grant No. 2011CBA00103), the National Natural Science Foundation of China (Grant Nos. 11174245 and 11374257), the Science Challenge Program of China, and the Fundamental Research Funds for the Central Universities of China.
In this review article, we give a brief overview of heavy fermions, which are prototype examples of strongly correlated electron systems. We introduce the application of physical pressure in heavy fermion systems to construct their pressure phase diagrams and to study the close relationship between superconductivity (SC) and other electronic instabilities, such as antiferromagnetism (AFM), ferromagnetism (FM), and valence transitions. Field-angle dependent heat capacity and point-contact spectroscopic measurements under pressure are taken as examples to illustrate their ability to investigate novel physical properties of the emergent electronic states.
When a tiny amount of magnetic impurities, e.g., Mn or Fe, are doped into a good metal, the local moments of the magnetic impurities are compensated by the opposite spins of the conduction electrons, forming a Kondo singlet.[1] As a result, the scattering rate of conduction electrons by the impurities diverges as the temperature approaches zero, giving rise to a logarithmic increase of the electrical resistivity below the Kondo temperature TK. Heavy fermion systems usually refer to certain intermetallic compounds containing lanthanide (Ce, Yb, Pr, etc.) or actinide (U, Pu, Np, etc.) elements, where the localized electrons in partially filled 4f or 5f orbits form a periodic lattice and are strongly hybridized with the conduction electrons via the Kondo effect. Upon reducing the temperature of such a Kondo lattice system, the electrical resistivity ρ(T) typically shows an initial increase due to the scattering by 4f or 5f localized electrons acting as Kondo impurities, reaching a maximum at a certain temperature before decreasing rapidly with further cooling. This characteristic temperature is commonly called the coherence temperature, below which Kondo scattering becomes coherent and the system gradually evolves into a new quantum state that shows Landau–Fermi liquid behavior. However, the renormalized electron mass is much heavier than that of free electrons due to the hybridization between localized electrons and conduction electrons, yielding an anomalous enhancement of the electronic specific heat coefficient γ. The term “heavy fermion” has thus been coined to distinguish the behavior of this class of materials from that of a normal Fermi liquid in metals.[2]
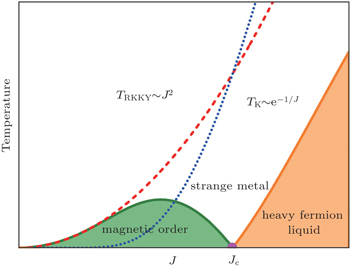
Besides the Kondo interaction, there exists another competing interaction in heavy fermion systems, the Ruderman–Kittel–Kasuya–Yosida (RKKY) interaction.[3–5] The Kondo interaction screens the magnetic moments of localized f electrons, leading to the formation of a heavy fermion Fermi-liquid state. On the other hand, the RKKY interaction favors long-range magnetic order, where the localized electrons can polarize the surrounding conduction electrons to form a spin density wave in space, aligning the spins of other distant f electrons. The temperatures characterizing the Kondo interaction (TK) and the RKKY interaction (TRKKY) can both be expressed in terms of the hybridization constant J between the localized and conduction electrons and the density of states at the Fermi energy D(εF), but they follow different behaviors. The Kondo temperature is characterized by

The competition between the Kondo and RKKY interactions in heavy fermion systems may result in various ground states, leading to a rich phase diagram, which can be qualitatively described by the Doniach phase diagram as schematically shown in Fig.
Among various tuning parameters, physical pressure serves as a powerful tool to study the physics of heavy fermion systems because it is a clean and effective method to tune the electron interactions without breaking time reversal symmetry. In this review article, we illustrate the wide applicability of physical pressure for exploring emergent quantum states, in particular superconductivity and quantum criticality in heavy fermion systems.
 | Fig. 1. A schematic illustration of the Doniach phase diagram. |
Measurements of transport properties under pressure have been widely employed to study emergent phenomena in correlated electron systems and are powerful tools for determining the presence of pressure-induced phase transitions, metal–insulator transitions and anomalous normal-state behavior. In order to reveal the pressure-induced superconducting pairing states, the scaling behaviors near a pressure-induced QCP or other unusual electronic states, it is essential to extend the measurements of thermodynamic and magnetic properties to the multiple extreme conditions of low temperatures, high pressure and high magnetic field. In this section, we describe a few experimental methods which were recently set up in our laboratory and are very useful for studying the order parameters of pressure-induced phase transitions. They are the ac calorimetry and the point-contact spectroscopy under the aforementioned multiple extreme conditions, while the former method can be even measured in a pressure cell with a rotating magnetic field down to mK temperatures.
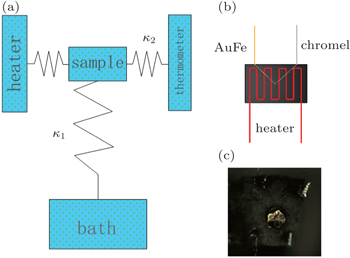
AC calorimetry is an alternative option for specific heat measurements under pressure,[8] since the commonly used relaxation method cannot be performed in the pressure environment. The disadvantage of not being able to determine the absolute value from ac calorimetry is compensated by its high resolution and valuable information about thermodynamic properties can be obtained from measurements of bulk phase transitions. Figure

 | Fig. 2. (a) Schematic thermodynamic model of ac calorimetry measurements. (b) Diagram of sample preparation for the ac calorimeter. (c) Photograph of the ac calorimetric setup inside a piston cylinder pressure cell. |
The experimental setup of the ac calorimetry measurements is shown in Fig.
Restricted by the pressure cells, some advanced experimental methods, such as the angle-resolved photoemission spectroscopy (ARPES), are not able to characterize the pressure-induced superconductivity. Field-angle dependence of the heat capacity is a useful tool for detecting nodal positions in the superconducting gap and thus allows us to determine the superconducting order parameters, serving as an invaluable alternative for probing unconventional superconductivity emerging under pressure, thanks to the ability of measuring the heat capacity under pressure using ac calorimetry. However, it is difficult to adapt a pressure cell to a commonly used mechanical rotator in a cryostat. Thus, a vector magnet, which can generate a magnetic field along any direction, is usually required for such measurements.
The relevant theory for the field-angle dependence of gap symmetries was proposed by Vekhter et al. by analyzing the Doppler energy shift caused by a supercurrent flowing around a vortex in a magnetic field,[10] given by δE = 
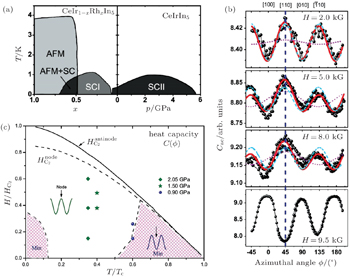
Field-angle dependent heat capacity measurements have been applied to detect the gap symmetries of the widely studied Ce-based “115” heavy fermion systems such as CeCoIn5, CeIrIn5, and CeRhIn5 under pressure,[12–15] which are generally believed to be d-wave superconductors with a dx2−y2 order parameter. An oscillation sign reversal was observed in the in-plane field-angle dependent specific heat measurements of CeCoIn5 when cooled below 200 mK, which is about 0.1Tc. The evolution of the oscillation amplitude with temperature and applied magnetic field is consistent with the calculations of a dx2–y2 gap structure.[12] In the case of CeIrIn5, there is a long-standing debate about whether the superconductivity originates from spin or valence fluctuations.[16–18] At ambient pressure CeIrIn5 lies near the cusp of two superconducting domes, as shown in Fig.
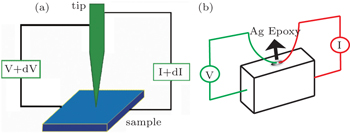
The point-contact spectroscopy (PCS) serves as another important tool for investigating the electronic states and superconducting gap symmetries at ambient or pressure conditions, which is complimentary to the scanning tunneling microscope (STM) technique. While mechanical PCS techniques require a tiny metal needle to make point-like contact with the sample, the soft point contact is simply made by thin platinum wire glued to the sample using silver paint or silver epoxy, as shown in Figs.
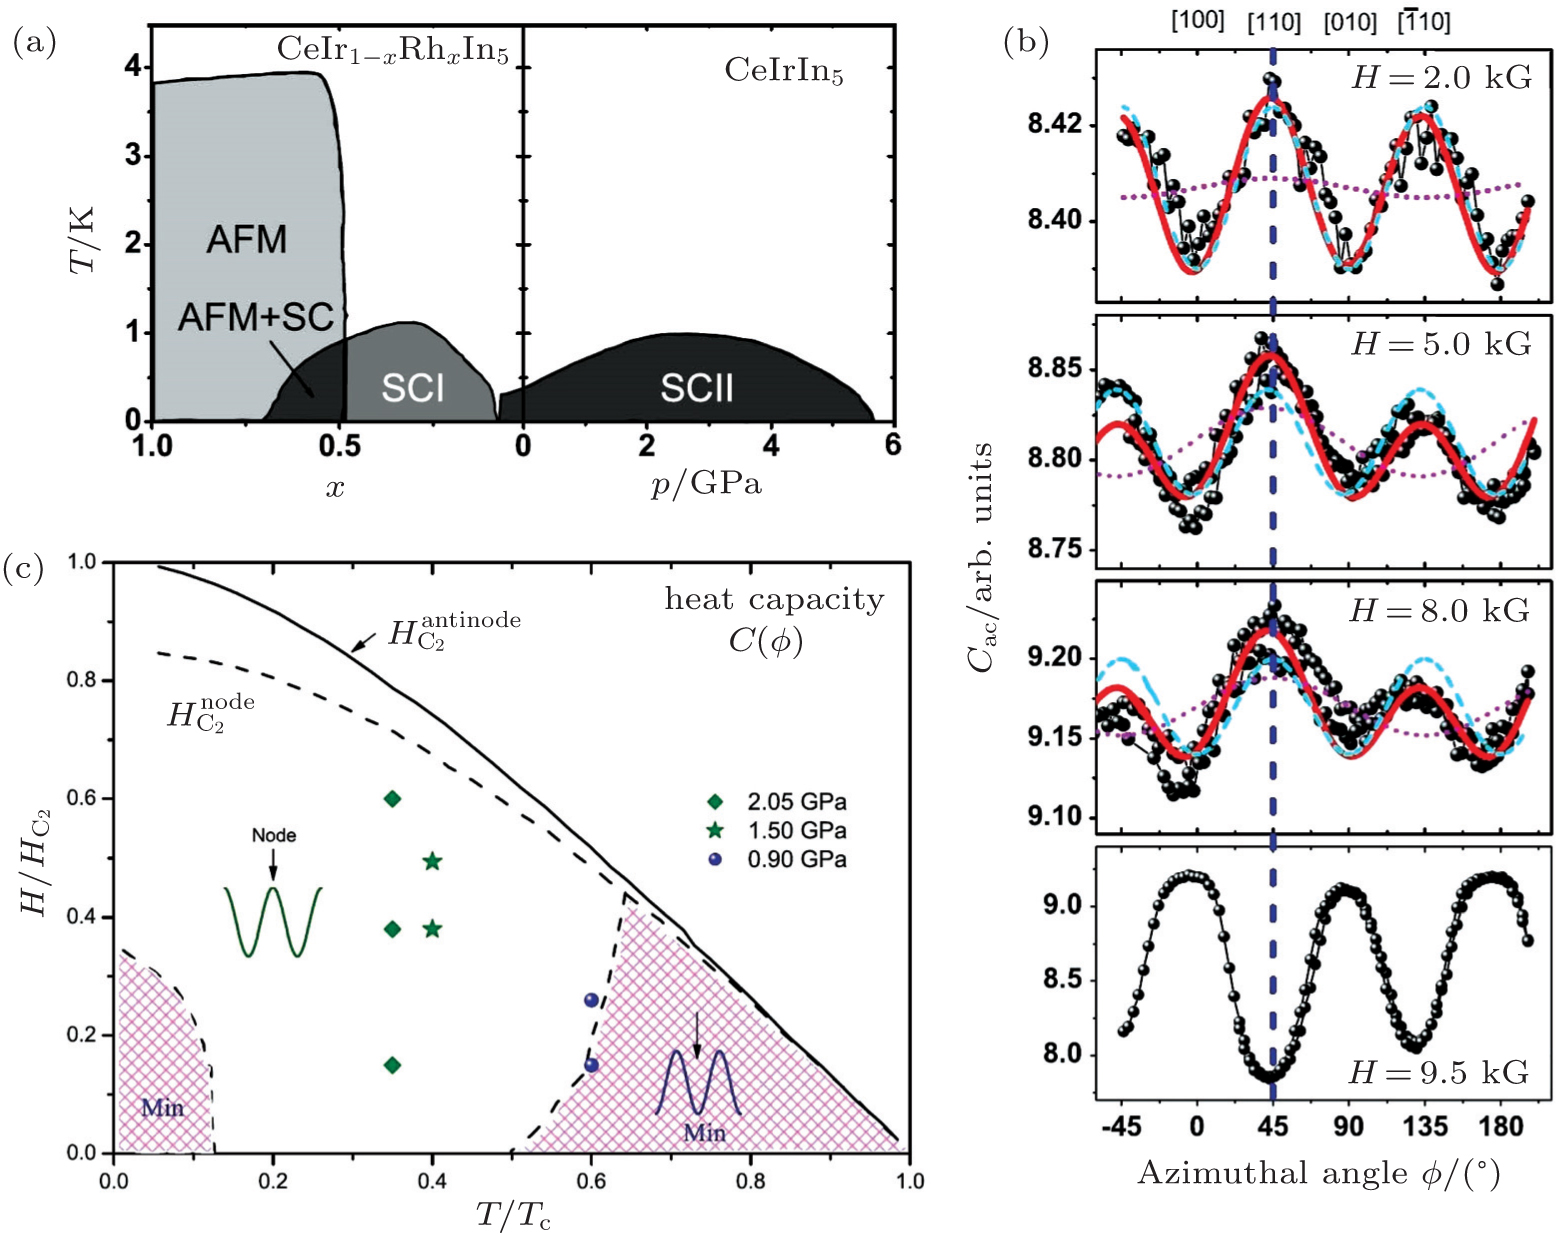 | Fig. 3. (a) Two superconducting domes in Rh-doped CeIrIn5 and CeIrIn5 under pressure. (b) Field-angle dependence of the ac specific heat in different magnetic fields for CeIrIn5, where p = 2.05 GPa and T = 0.3 K. (c) Theoretical B–T phase diagram for the four-fold field-angle dependence of the specific heat, together with the experimental data of CeIrIn5 (adapted from Ref. [21]). |
 | Fig. 4. Sketch for (a) mechanical and (b) soft point-contact spectroscopy. |
Both mechanical and soft point-contact spectroscopic methods are commonly applied to investigate the superconducting gap and order parameter symmetries in various superconductors such as MgB2 and iron-based superconductors.[23] In general, Andreev reflection is associated with the transmission across the interface in the presence of a partial tunneling barrier, where an electron is retroreflected as a hole and one Cooper pair goes through the interface with the conductance doubled inside the superconducting gap.[24] The experimental conductance curves G(V) are analyzed with the Blonder–Tinkham–Klapwijk (BTK) model to infer the gap structure or order parameter symmetries,[25] which will not be extensively discussed here and can be referenced in textbooks or review articles.[23,26] In recent years, PCS has also been extended to study the hybridization between localized f electrons and conduction electrons in heavy fermion systems, where asymmetric Fano-line shape or hybridization gap is observed due to the quantum interference between the local f and itinerant conduction electrons.[27–30] PCS has become an effective method to study the systematical evolution of the hybridization in heavy fermion systems tuned by pressure as another dimension.
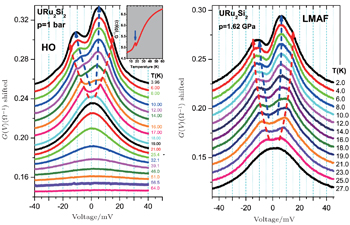
As an example, here we apply the PCS technique to study the electronic structure of the pressurized URu2Si2. Upon cooling down, URu2Si2 shows two subsequent phase transitions; one is a second-order transition at T0 ∼ 17.5 K associated with the “hidden order” and the other is a superconducting transition with Tsc ∼ 1.5 K.[31] The nature of the “hidden order” has received intensive attention in recent years but remains a mystery.[32] The application of pressure suppresses superconductivity around 0.5 GPa but slightly enhances T0.[33] With further increasing pressure, a large-moment antiferromagnetic (LMAF) phase emerges from the hidden order phase via a first-order-like transition and its transition temperature TLMAF continues to increase, merging with T0 at a critical pressure of around 1.3 GPa. The LMAF phase directly emerges from the high-temperature paramagnetic state at higher pressures. In Fig.
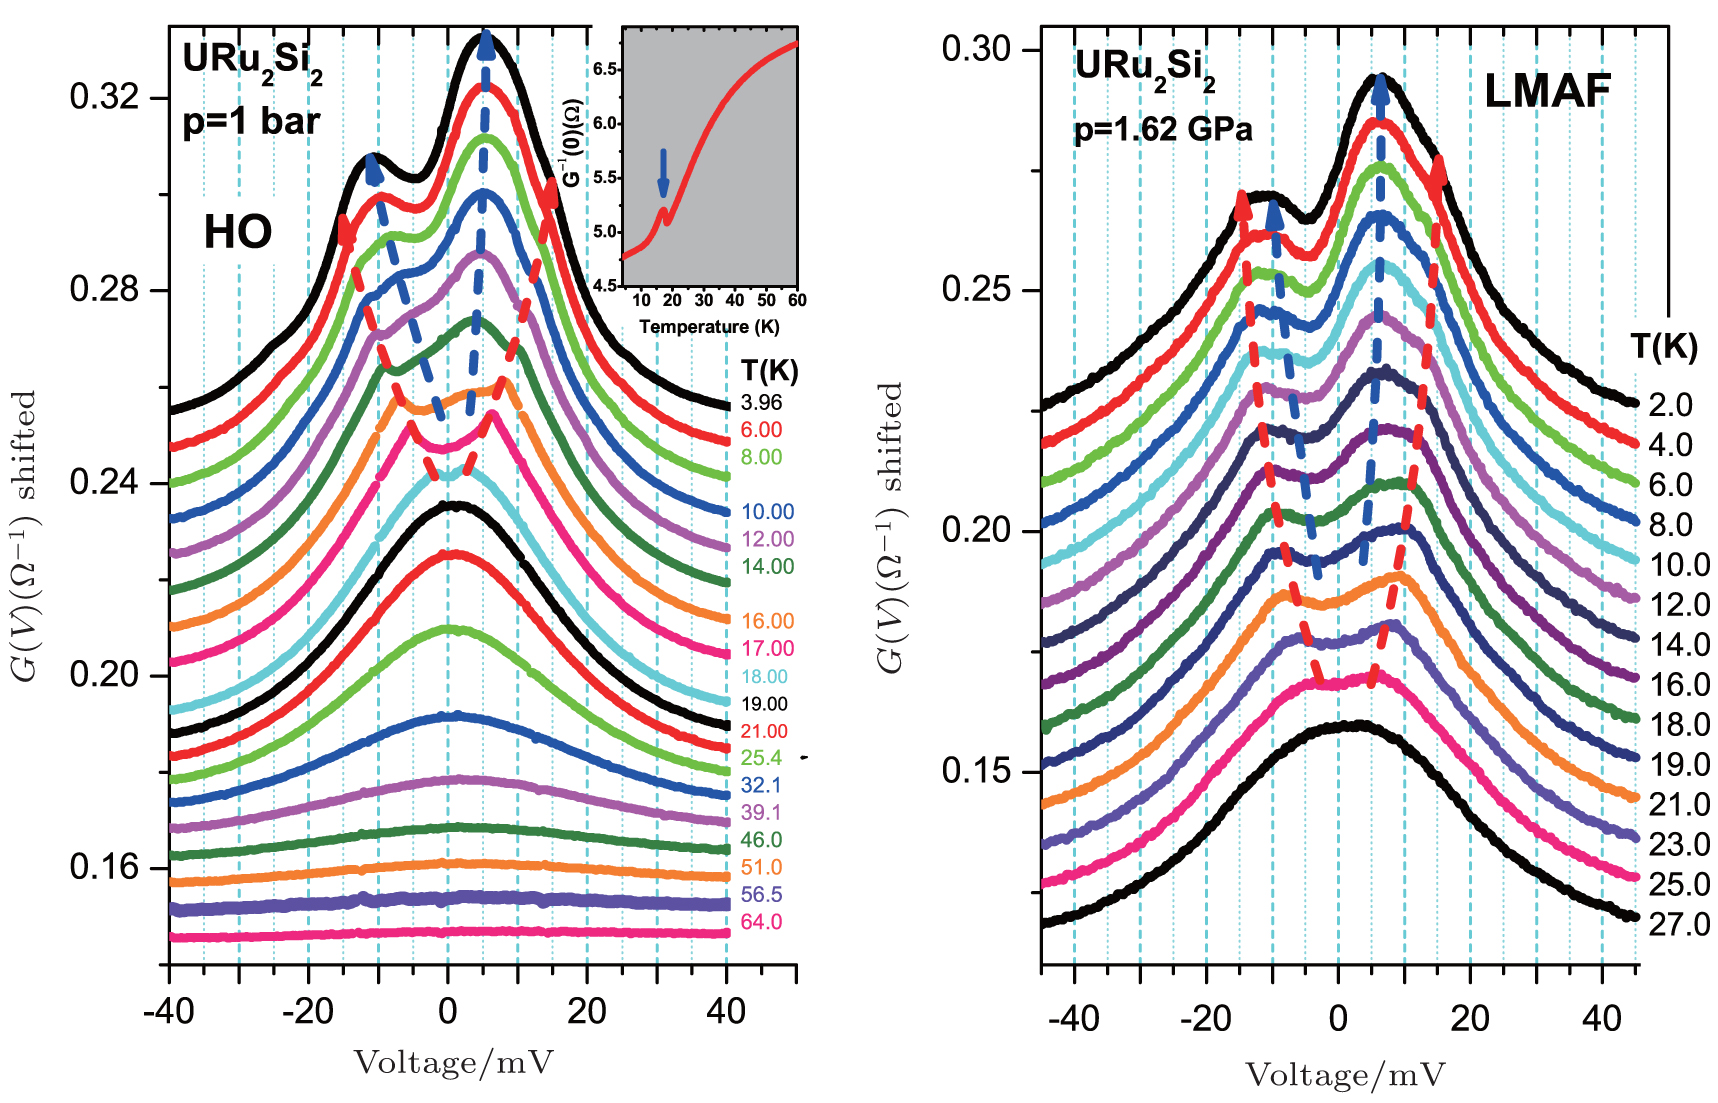 | Fig. 5. Point contact spectroscopy of URu2Si2 at ambient pressure and 1.62 GPa (adapted from Ref. [34]). |
A common thread in unconventional superconductors, such as heavy fermions, high-Tc cuprates or the newly discovered iron-based superconductors, is that superconductivity occurs in proximity to antiferromagnetism upon tuning non-thermal parameters, indicating a close relationship between AFM and SC. In high-Tc cuprates or iron-based superconductors, antiferromagnetism in the parent compound is generally suppressed by electron or hole doping, while both pressure and doping can tune heavy fermion systems between AFM and SC states because of their low-energy scales and thus sensitivity to changes in external parameters. For example, a superconducting dome was observed in CePd2Si2 and CeIn3 under pressure with a maximum Tc near the antiferromagnetic QCP, and the origin of superconductivity was attributed to spin fluctuations.[35] Subsequently, similar phase diagrams have been observed in a number of heavy fermion compounds, in particular Ce-based compounds, e.g., CeCu2Si2,[36] CeMIn5 (M = Co, Rh, Ir),[37,38,39] and CeMSi3.[40,41] In this section, we will take the prototype compounds CeMIn5 as examples and describe the intimate relationship between antiferromagnetism, quantum criticality, and superconductivity.
CeCoIn5 has the highest superconducting transition temperature among the Ce-based heavy fermion systems with Tc ∼ 2.3 K at ambient pressure[37] and its maximum Tc reaches 2.6 K at around 1.5 GPa.[42] It is generally believed that CeCoIn5 is in close proximity to an antiferromagnetic quantum critical point, where its normal state resistivity shows a linear temperature dependence[43] and the specific heat coefficient diverges logarithmically when the applied magnetic field approaches the upper critical field Bc2(0).[37] In addition, the nuclear spin relaxation rate shows critical behavior with a T1/4 dependence as a function of temperature.[44]
Figure 

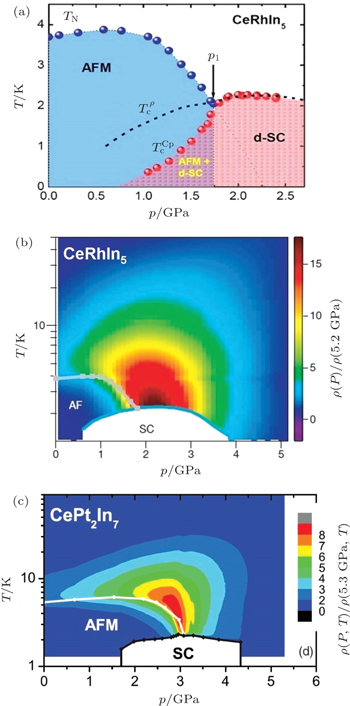
Evidence for the existence of non-Fermi liquid (NFL) behavior and antiferromagnetic quantum criticality was shown in CeRhIn5 at around 2.35 GPa, coinciding with the maximum superconducting transition temperature of Tc ∼ 2.3 K, from a careful analysis of the specific heat and resistivity under pressure.[45,46] Its resistivity follows a sub-linear temperature dependence (ρ ∝ T0.85) in the normal state, which survives down to at least 250 mK, when superconductivity is completely destroyed by a magnetic field of 10 T.[48] The specific heat diverges when superconductivity is suppressed by applying a magnetic field,[45,46] also indicating non-Fermi liquid behavior. In the contour color plot of the isothermal resistivity shown in Fig.
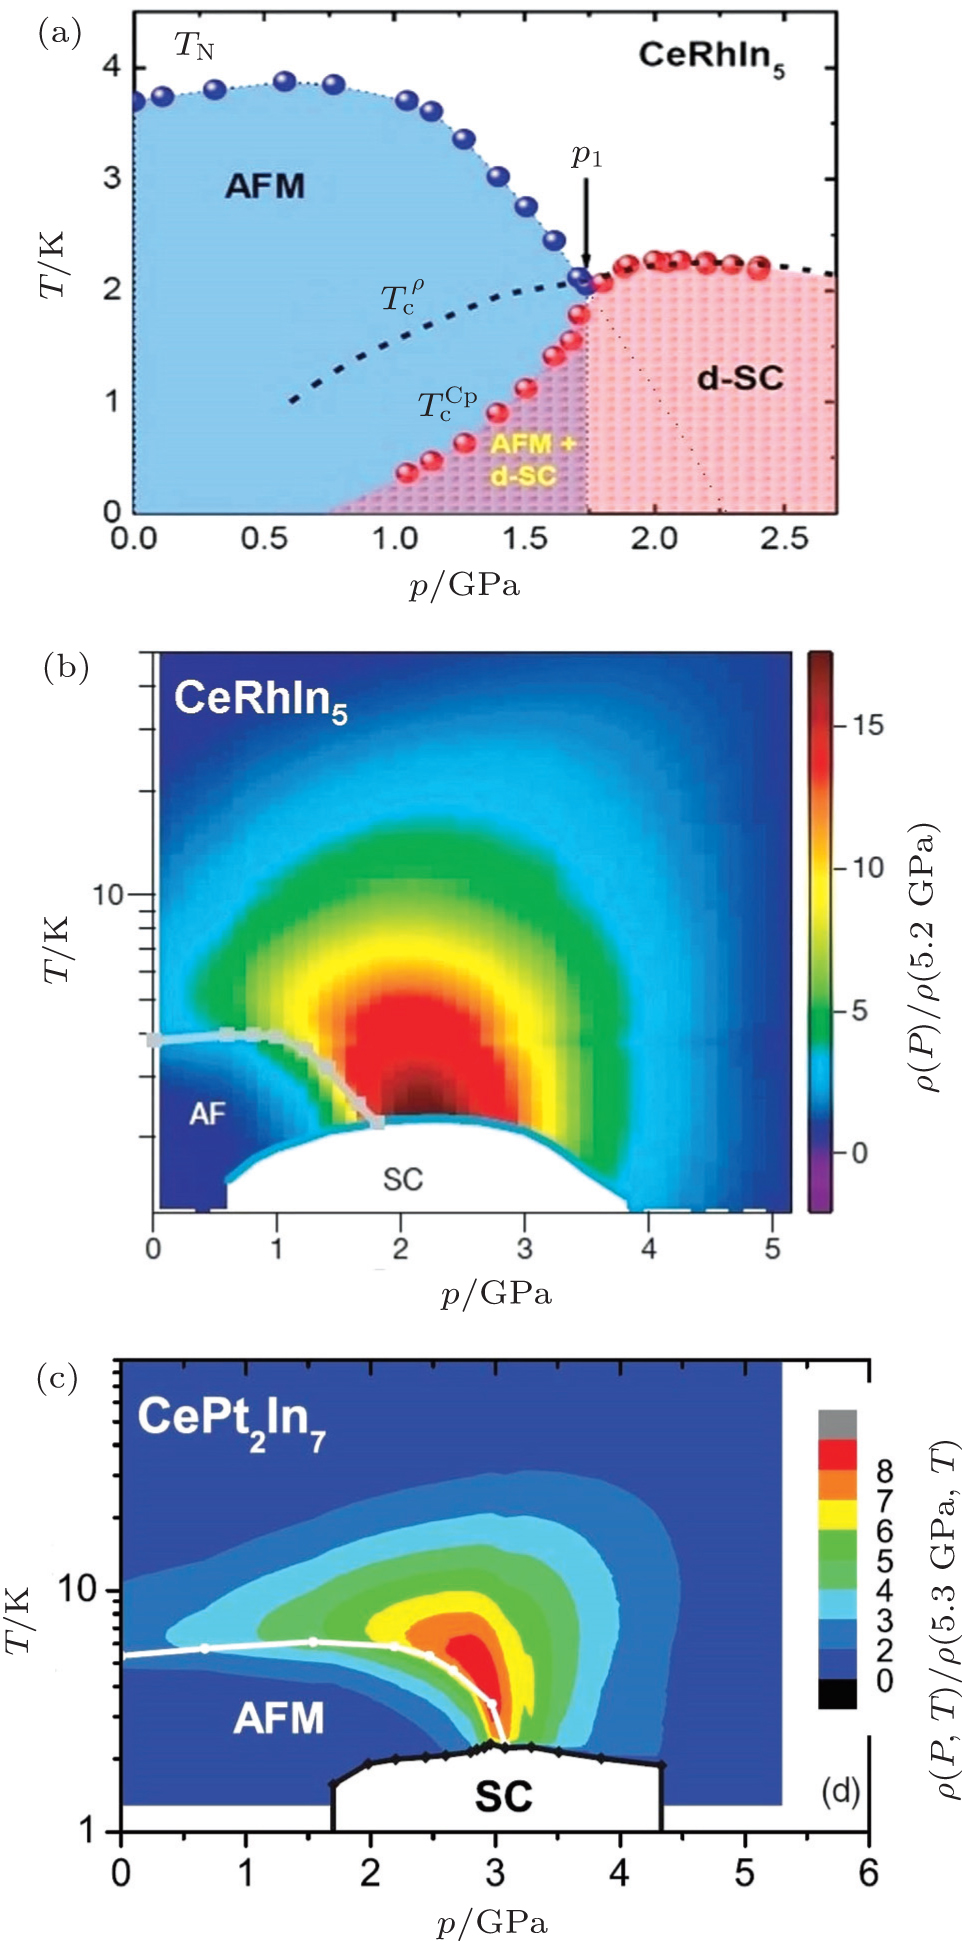 | Fig. 6. (a) Pressure–temperature phase diagram of CeRhIn5, where the blue symbols represent the Néel temperature TN and the red represents the bulk superconducting transition temperature  |
Similar behaviors have also been observed in other heavy fermion materials with quantum criticality such as CePt2In7,[55] as shown in Fig.
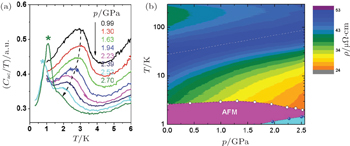
At ambient pressure, CeIrIn5 is superconducting with a bulk Tc of 0.4 K, but has a resistive transition at Tc ≃ 1.2 K.[56] Its superconducting transition temperature reaches a maximum value of Tc = 1.05 K at around 2 GPa in resistivity data.[57] A small amount of Cd doping into the In site suppresses superconductivity and induces long-range antiferromagnetic order in CeIrIn5.[58] Moreover, the doped system can be tuned back to bulk superconductivity by applying pressure, as shown in Fig.
 | Fig. 7. (a) Pressure evolution of the heat capacity of the 1% Cd doped CeIrIn5. (b) Contour color plot of the resistivity of 1% Cd doped CeIrIn5 as a function of temperature and pressure (adapted from Ref. [59]). |
Ferromagnetism is generally believed to be antagonistic to superconductivity and their interplay in heavy fermion systems has thus been much less frequently studied. However, the coexistence of FM and SC has been observed in some actinide compounds with 5f electrons, such as URhGe,[61] UCoGe,[62] UGe2,[63] and UIr,[64] where exotic superconducting states and rich physical phenomena are observed. Furthermore, a field-induced re-entrance of superconductivity was observed at B ≥ 8 T in the ferromagnetic superconductor URhGe,[61] where superconductivity is initially destroyed by a field of about 2 T. The non-centrosymmetric ferromagnetic compound UIr undergoes three ferromagnetic phase transitions under pressure, before displaying superconductivity at the border of the third ferromagnetic phase at about 2.6 GPa.[64]
As a salient example of ferromagnetic superconductors, the U-based heavy fermion compound UGe2 shows a Curie temperature of Tc = 52 K at ambient pressure, with an ordered moment of μs = 1.48μB/U, which is strictly aligned along the a axis.[65] Measurements of quantum oscillations suggest the delocalization of uranium 5f electrons which make the dominant contributions to the Fermi surface.[66] The itinerant nature of ferromagnetism in UGe2 is also consistent with the specific heat and low-lying magnetic excitation spectra data.[68] The FM transition is gradually suppressed by applying pressure up to pc ≃ 15 kbar, followed by an abrupt collapse at a first-order-like transition.[63] Superconductivity emerges in the pressure range from 9 kbar to 16 kbar with a maximum superconducting transition temperature of Tc ∼ 0.7 K at around 12 kbar.[63] A second magnetic transition is observed below TC (denoted as Tx), which is manifested in the derivative of the resistivity as a broad peak at 25 K,[67] as well as in specific heat,[68] Hall effect,[69] thermal conductivity,[70] and photoemission measurements.[71] Figure
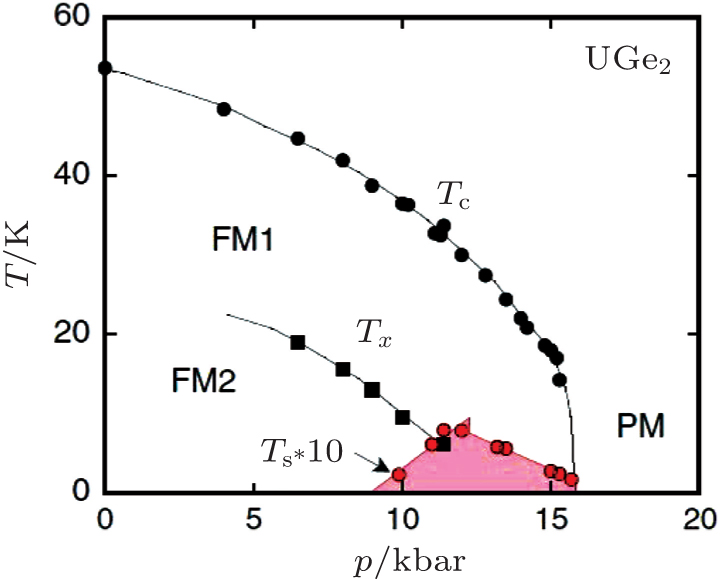 | Fig. 8. The pressure–temperature phase diagram of UGe2 (adapted from Ref. [72]). |
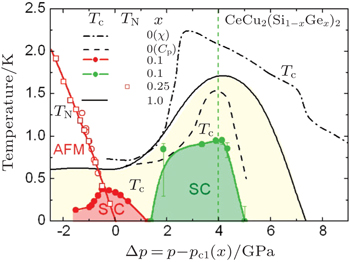
CeCu2Si2 is a prototype heavy fermion superconductor which lies in the vicinity of a 3D SDW quantum critical point at ambient pressure.[75] Thus, its superconductivity is generally believed to be induced by spin fluctuations. However, the pressure–temperature phase diagram of pristine CeCu2Si2 has been a puzzle in the community for a long time, since its Tc is nearly independent of pressure below 2 GPa, sharply increases to 2.3 K in the range of 2–3 GPa, followed by a slow decrease up to at least 8 GPa.[76] This step-like evolution of Tc with pressure naturally leads to the speculation that the high-pressure SC may not be attributed to a magnetic origin, but another superconducting mechanism dominates the high pressure region, since the system has a higher Tc despite being further away from the antiferromagnetic QCP.
To solve this problem, measurements of the electrical resistivity under pressure were performed for a series of Ge-doped CeCu2Si2.[77,78] Here the isoelectronic substitutions of Ge for Si in CeCu2Si2 act as a negative chemical pressure to increase the unit-cell volume. Application of pressure to CeCu2(Si1−xGex)2 tunes the system back to the magnetic QCP but with enhanced disorder/impurity scattering. The disorder introduced by the Si/Ge substitutions has little effect on the magnetic order, but dramatically suppresses superconductivity.[79] In Fig.
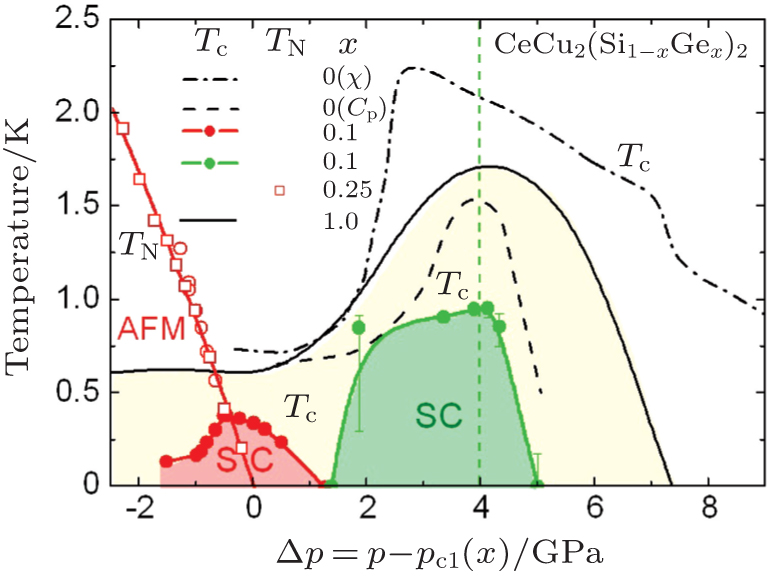 | Fig. 9. The pressure–temperature phase diagram of CeCu2(Si1−xGex)2. The pressure on the x axis is shifted by the corresponding critical pressure pc1(x) at the antiferromagnetic QCP. Two superconducting states merge together in CeCu2Si2 under pressure (adapted from Ref. [77]). |
These experimental features observed in the high-pressure regime of CeCu2(Si1−xGex)2 can be described in terms of a valence-fluctuation model,[82,83] which is based on the following generalized periodical Anderson model:
Similar ideas of two superconducting domes have been recently extended to several other systems, e.g., the Pu-based “115” compounds[84] and the high-Tc cuprates.[85,86] For example, PuCoGa5 undergoes a superconducting transition at ∼ 18.5 K,[87] one order of magnitude higher than the CeMIn5 family. This compound shows no magnetic order,[88] being different from its sister compound PuCoIn5 where superconductivity and magnetism are found to coexist.[84] On the other hand, it was shown that PuCoGa5 is an intermediate valence compound.[89,90] Recent measurements of the elastic moduli demonstrate that valence fluctuations, as reflected by elastic softening, disappear as the temperature reaches Tc, indicating a close relationship between the formation of superconductivity and the avoidance of a valence transition.[91]
As described above, in heavy fermion compounds one can tune the ground state from magnetically ordered states (both AFM and FM) to a paramagnetic state by applying non-thermal parameters such as pressure, magnetic field, and chemical substitutions. Proper characterization of the quantum critical points and their related critical behaviors are currently an important but open problem in condensed matter physics. Elucidations of this problem may also aid in understanding the puzzles of unconventional superconductivity in heavy fermion compounds, high-Tc cuprates and other materials. Recently, two types of quantum critical points, the SDW-type QCP[52–54] and the local QCP,[50,51] have been studied intensively. Here the crucial point distinguishing these two scenarios is whether the degrees of electron freedom are involved at the QCP. The SDW-type QCP resembles a classical phase transition, where only fluctuations of the order parameter (e.g., magnetization for magnetic order) are involved and the Fermi surface changes smoothly across the QCP. On the other hand, the critical fermionic and bosonic degrees of freedom are involved at a local QCP, where a sharp change of the Fermi volume is expected as a result of a Kondo breakdown.
There is evidence that different tuning parameters may lead to different types of QCP. For example, the scenario of local quantum criticality has been discussed in YbRh2Si2 under a magnetic field[92] and CeCu6–xAux upon varying the doping,[93] although this is still under debate. On the other hand, evidence of Kondo destruction was found inside the antiferromagnetic region of Co-doped YbRh2Si2[94] as well as in magnetic-field tuned CeCu6−xAux[95] and Ce3Pd20Si6.[96] CeCu2Si2 is believed to be a 3D SDW-type QCP.[75]
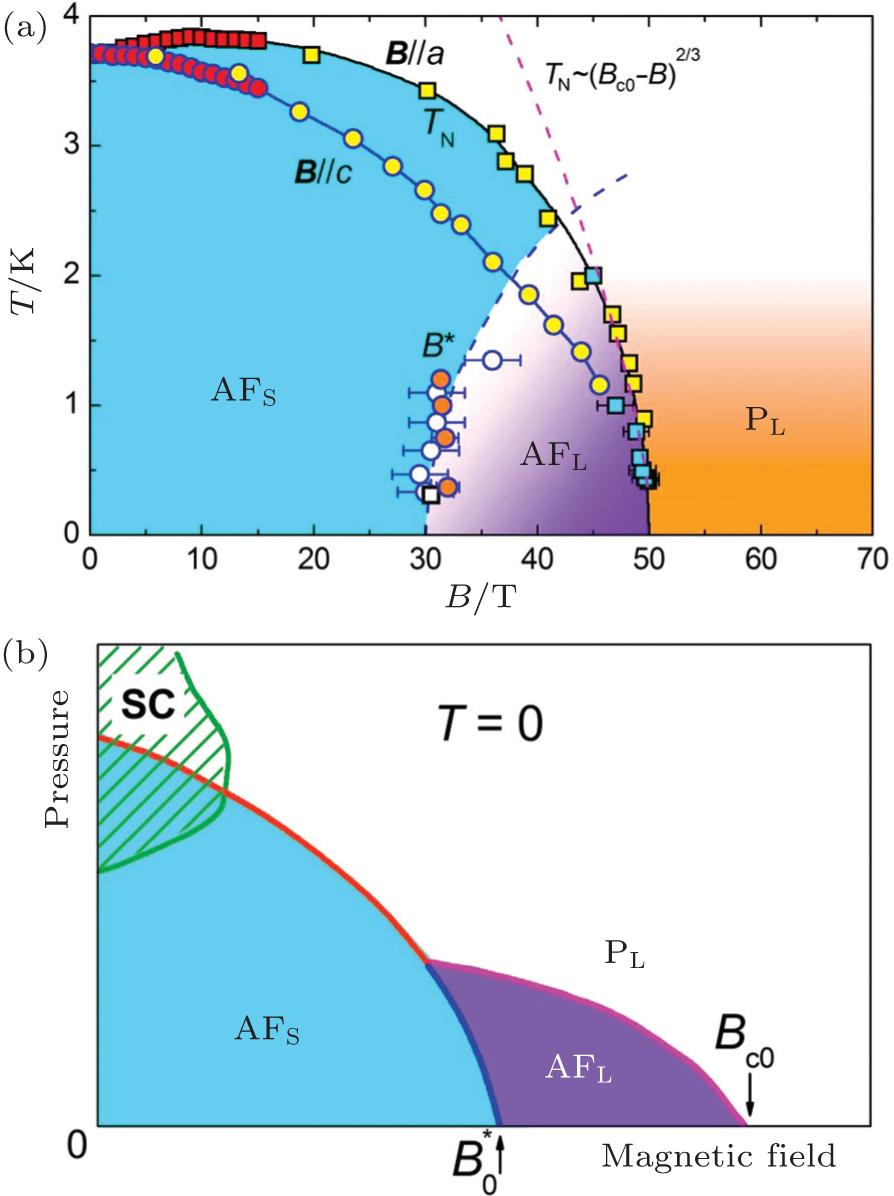 | Fig. 10. (a) Experimental magnetic field–temperature phase diagram of CeRhIn5 at ambient pressure. (b) A proposed schematic phase diagram for CeRhIn5 at 0 K (adapted from Ref. [97]). |
Recently, we demonstrated that CeRhIn5 may serve as a model example to study multiple quantum phase transitions and their universal classification.[97] As mentioned earlier, there exists a pressure-induced antiferromagnetic QCP at around 2.3 GPa,[45] where a dramatic change of Fermi surface is observed,[49] supporting the scenario of local QCP in pressurized CeRhIn5. Under a magnetic field, the antiferromagnetic transition of CeRhIn5 is also suppressed and the large critical field allows us to study the field evolution of Fermi surface using quantum oscillations. Figure
These results suggest that multiple quantum critical points may exist in CeRhIn5 when tuned by different parameters and the change of the Fermi surface may serve as a criterion to classify the different scenarios.[97] It is important to further investigate the behaviors under both high pressure and high magnetic field which will be useful to establish the global phase diagram shown in Fig.
Physical pressure has proven to be a clean and powerful tool for tuning the electronic states of heavy fermion systems, which provides us with a great opportunity to study the intricate relationships between different ground states and to search for emergent quantum states or phenomena. In particular, exotic superconductivity emerges when heavy fermion systems are pressurized in proximity to various electronic instabilities, including antiferromagnetism, ferromagnetism and valence transitions. The insights gained from studying superconductivity in heavy fermion systems may play an important role in unveiling the mysterious superconducting mechanism in other unconventional superconductors such as cuprate, iron pnictides, and organic superconductors. Furthermore, heavy fermion compounds are also a prototype system for studying the physics of quantum criticality, a frontier problem in condensed matter physics. Advanced experimental methods, such as field-angle dependent heat capacity and point-contact spectroscopy under pressure, will be highly useful in characterizing their novel electronic states in a high-pressure environment.
| 1 | |
| 2 | |
| 3 | |
| 4 | |
| 5 | |
| 6 | |
| 7 | |
| 8 | |
| 9 | |
| 10 | |
| 11 | |
| 12 | |
| 13 | |
| 14 | |
| 15 | |
| 16 | |
| 17 | |
| 18 | |
| 19 | |
| 20 | |
| 21 | |
| 22 | |
| 23 | |
| 24 | |
| 25 | |
| 26 | |
| 27 | |
| 28 | |
| 29 | |
| 30 | |
| 31 | |
| 32 | |
| 33 | |
| 34 | |
| 35 | |
| 36 | |
| 37 | |
| 38 | |
| 39 | |
| 40 | |
| 41 | |
| 42 | |
| 43 | |
| 44 | |
| 45 | |
| 46 | |
| 47 | |
| 48 | |
| 49 | |
| 50 | |
| 51 | |
| 52 | |
| 53 | |
| 54 | |
| 55 | |
| 56 | |
| 57 | |
| 58 | |
| 59 | |
| 60 | |
| 61 | |
| 62 | |
| 63 | |
| 64 | |
| 65 | |
| 66 | |
| 67 | |
| 68 | |
| 69 | |
| 70 | |
| 71 | |
| 72 | |
| 73 | |
| 74 | |
| 75 | |
| 76 | |
| 77 | |
| 78 | |
| 79 | |
| 80 | |
| 81 | |
| 82 | |
| 83 | |
| 84 | |
| 85 | |
| 86 | |
| 87 | |
| 88 | |
| 89 | |
| 90 | |
| 91 | |
| 92 | |
| 93 | |
| 94 | |
| 95 | |
| 96 | |
| 97 | |
| 98 | |
| 99 |