

Coalbed methane adsorption and desorption characteristics related to coal particle size
[Feng Yan-Yan1, 2, Yang Wen1, 2, Chu Wei2, †,  ]
]
]
|
|


† Corresponding author. E-mail:
Project supported by the National Basic Research Program of China (Grant No. 2011CB201202).
Effects of particle size on CH4 and CO2 adsorption and desorption characteristics of coals are investigated at 308 K and pressures up to 5.0 MPa. The gas adsorption and desorption isotherms of coals with particle sizes ranging from 250 μm to 840 μm are measured via the volumetric method, and the Langmuir model is used to analyse the experimental results. Coal particle size is found to have an obvious effect on the coal pore structure. With the decrease of coal particle size in the process of grinding, the pore accessibility of the coal, including the specific surface area and pore volume, increases. Hence, coal with smaller particle size has higher specific surface area and higher pore volume. The ability of adsorption was highly related to the pore structure of coal, and coal particle size has a significant influence on coal adsorption/desorption characteristics, including adsorption capacity and desorption hysteresis for CH4 and CO2, i.e., coal with a smaller particle size achieves higher adsorption capacity, while the sample with a larger particle size has lower adsorption capacity. Further, coal with larger particle size is also found to have relatively large desorption hysteresis. In addition, dynamic adsorption performances of the samples are carried out at 298 K and at pressures of 0.1 MPa and 0.5 MPa, respectively, and the results indicate that with the increase of particle size, the difference between CO2 and CH4 adsorption capacities of the samples decreases.
With the gradual advent of more and more strict environmental rules, the green energy source serving as a sustainable energy supply is urgently needed.[1] Under this background, coalbed methane (CBM) is becoming an important new energy resource, which could ultimately eliminate gas outburst and reduce environmental pollution. Therefore, the realization of coal and CBM simultaneous extraction is of great significance for improving the efficiency and safety of coal production, reducing greenhouse gas emissions and improving energy efficiency.[2,3] Hence, a better understanding of the relationship between the coal property and gas adsorption capacity can play a significant role in the various areas of the coal mining industry and CBM.[2,4,5]
Furthermore, the ever-increasing CO2 emissions from fossil-fuel burning by human activities is causing the obvious greenhouse effect and worldwide climate change, and the development of technologies to ease climate change has been one of the biggest challenges.[6] Compared with the technologies to improve the energy efficiency and the use of clean energy combustion, the suitable carbon capture and sequestration (CCS) technologies urgently need developing, and adsorption is a potentially attractive alternative in the context of CCS. Research on CBM adsorption/desorption performances has the vital significance for developing the CBM and CCS.[7] According to CBM adsorption/desorption isotherms, the gas content in coal reservoirs can be estimated to predict the recovery of CBM and the injection rate of carbon dioxide, etc.[8–11]
To date, many researchers have recognized the most important factors influencing gas storage over coals, including coal type,[12–16] rank,[17] moisture content,[18,19] temperature,[20] burial depth,[21,22] pore characteristics,[13,22] etc.[23–32] However, experimental results are still greatly different although the adsorption tests have been used for many years to estimate CBM (mainly methane) storage capacity of coals. The most significant causes of errors are believed to be due to the oxidation of coals and the use of crushed samples that are not representative of the in situ conditions.[33] Feng et al.[34] have investigated the effects of oxygen-containing groups on methane adsorption by modified coals, and the results showed that the oxidation treatments reduced the ability to adsorb methane over the coals, similar to Hao et al.’s results.[30] Zhang et al.[35] have studied the influence of the particle size on methane adsorption by coals, and the results showed that with the increase of coal particle size, the adsorption equilibrium time became longer, but the methane adsorption capacity was not affected. However, the study of Xu et al.[36] showed that the smaller the coal particle size, the higher the amount of methane is adsorbed, which is consistent with the result of Chu et al.[37]
Based on the above description, the effects of particle size on coal pore structure and CBM (CH4 and CO2) adsorption/desorption characteristics are investigated in this work. The pore structures of coal samples with different particle size distributions are characterized by N2 adsorption/desorption isotherms at 77 K. The adsorption and desorption isotherms of CH4 and CO2 are measured at pressures up to 5.0 MPa by a volumetric method at 308 K, and the Langmuir model is used to fit the experimental data. Furthermore, the dynamic adsorption experiments are performed to study the breakthrough curves of coal samples with various particle size distributions.
The coal sample used in the present study was from the Sijiazhuang Coalmine, Shanxi, China. Table
| Table 1. Chemical analyses of raw coal (air-dried basis, wt.%). . |
The proximate analysis of raw coal was investigated by a GF-A6 automatic proximate analyzer (Hebi Celestica Instruments Co., Ltd).[22,30]
The ultimate analysis of raw coal was performed in a CARLO ERBA 1106 element analyzer (Italy).[30]
X-ray diffraction pattern of raw coal was recorded in DX-1000 powder diffractometer equipped with Cu Kα x-ray source and an internal standard of silicon power.[24,32]
FT-IR analysis of raw coal was performed on a Nicolet DXC20 FT-IR spectrometer.[22]
Thermogravimetric analysis (TG) of raw coal was carried out on a thermo gravimetric analyzer (TGA Q500). The samples were heated at a rate of 10 °C/min under N2 atmosphere.[32]
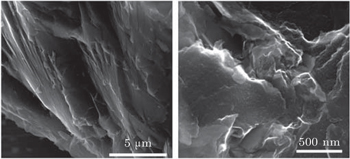
Surface morphology of raw coal was investigated by scanning electron microscopy (SEM) (JEOL/EO JSM-5900 microscope).[1]
The textural properties of the samples with varying particle sizes were obtained by N2 adsorption/desorption isotherms, determined at 77 K with a NOVA1000e surface area and pore size analyzer (Quantachrome Company).[1,34,35]
Gas adsorption and desorption measurements were performed by a volumetric method similar to that previously described.[22,24,30,32] Approximately 5-g coal was dried at 110 °C and evacuated for 3 h, prior to the determination of void volume in the adsorption setup by helium calibration. Subsequent to helium calibration, the samples were again evacuated for 3 h. CH4 or CO2 was introduced into the adsorption setup to produce an adsorption isotherm under pressures up to 5.0 MPa at 308 K. The test was repeated three times and the mean value of the equilibrium data was used to calculate the adsorption isotherm to ensure the validity of the experiment.
Dynamic gas adsorption test was carried out with about 20.0-g coal at 298 K under 0.5 MPa and 0.1 MPa, respectively. Prior to measurement, the coal sample was dried at 110 °C overnight. The content of He/CO2/CH4 used in the experiment was 55.08:6.07:38.85 (volume ratio, %).
The structural properties of raw coal are characterized by XRD, FT-IR, TG and SEM techniques, respectively. Figure
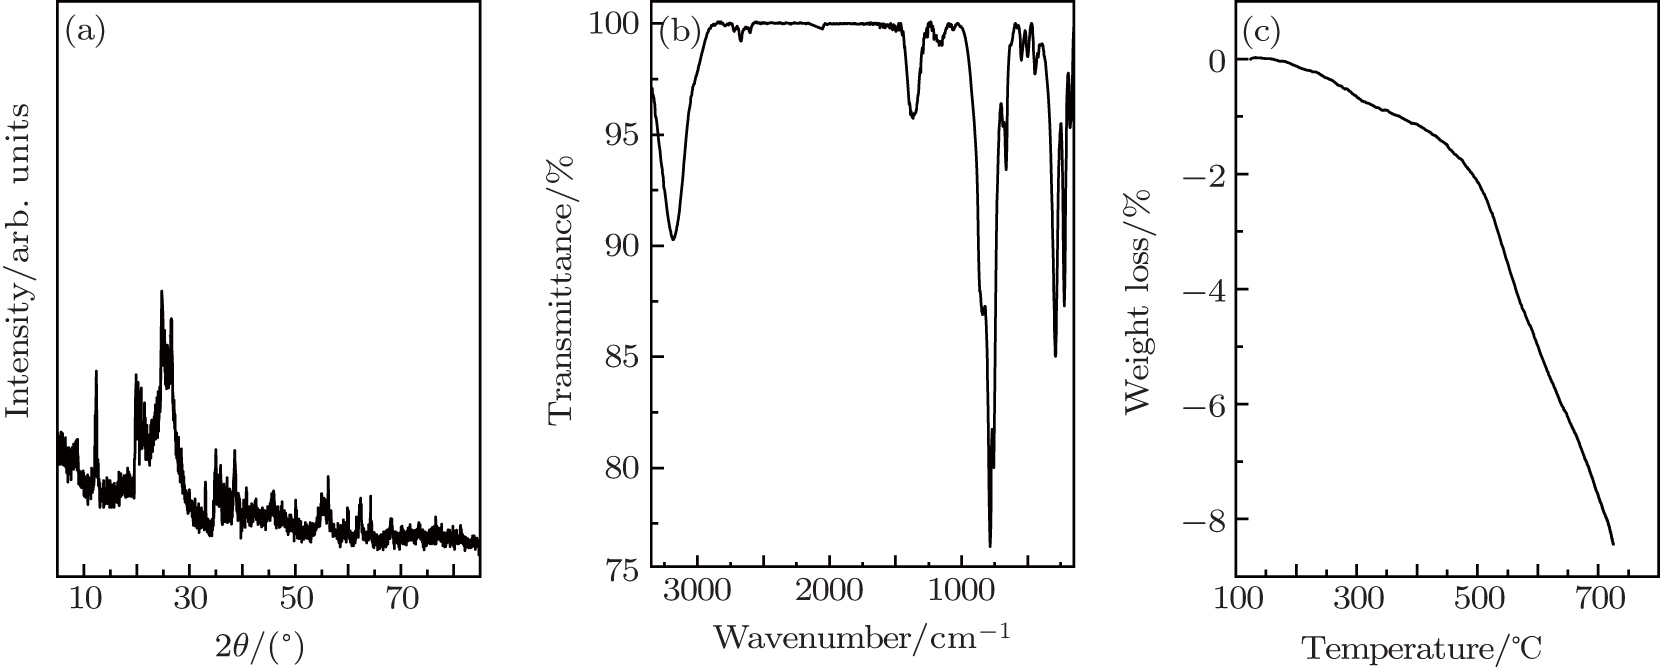 | Fig. 1. XRD profile (a), FT-IR (b), and weight loss (c) of raw coal SJZ. |
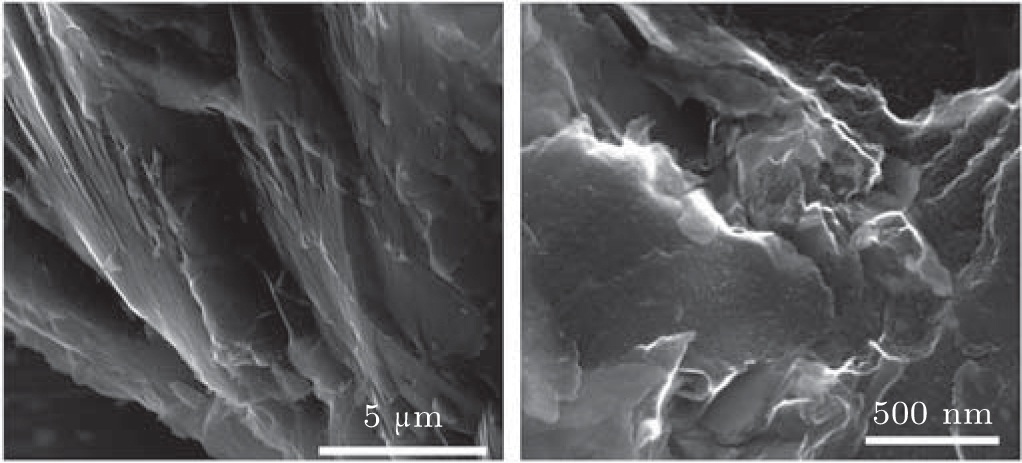 | Fig. 2. SEM images of raw coal SJZ. |
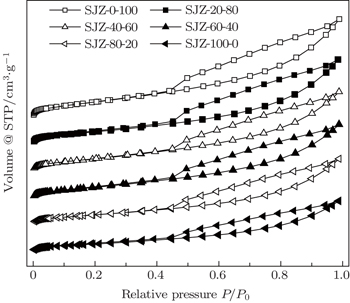
As a key parameter, the pore structure, which includes the specific surface area, pore volume and pore size distribution, directly affects the CBM production. Based on the knowledge of the nature of coal and its pore system, N2 adsorption/desorption, could characterize the pore structure.[22]
Figure
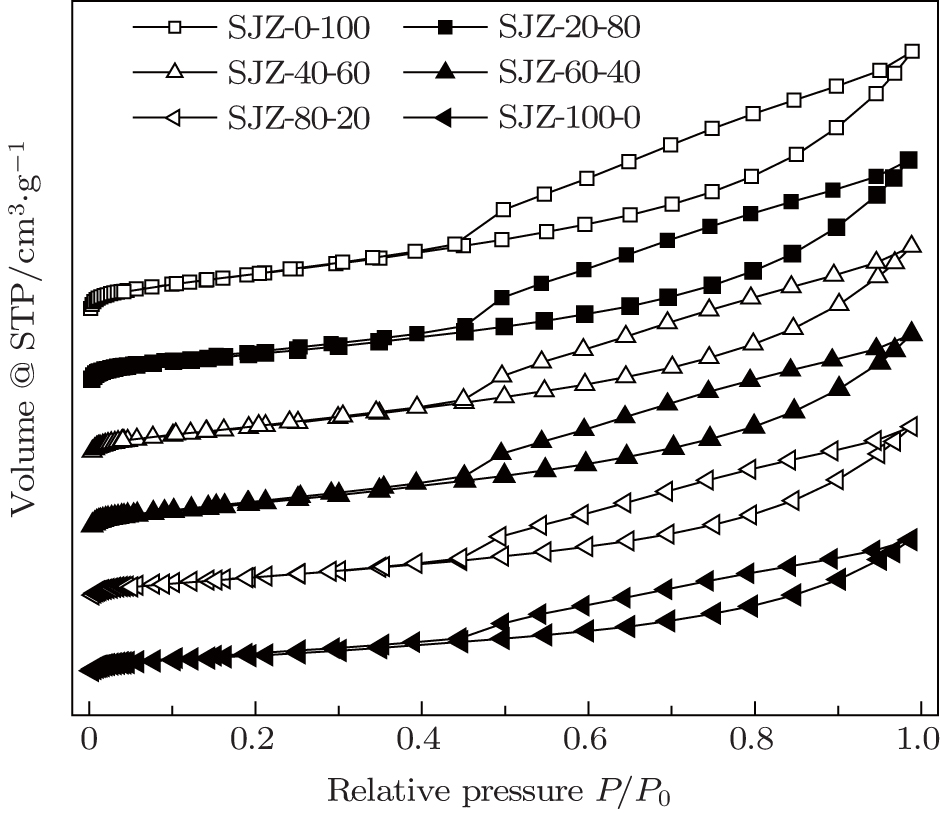 | Fig. 3. N2 adsorption/desorption isotherms at 77 K of the coal samples. |
Table
| Table 2. Textural characteristics of the coal samples. . |
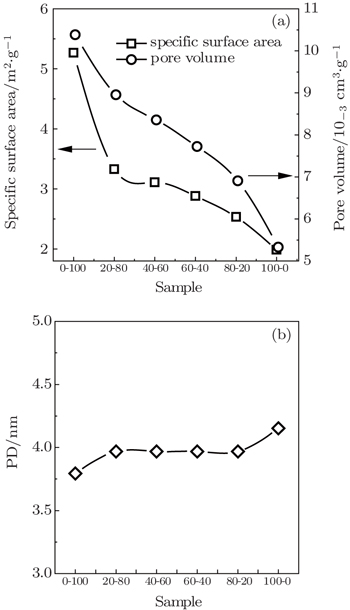
Figure
 | Fig. 4. Relationships between the textural characteristics and particle size distribution of the samples. |
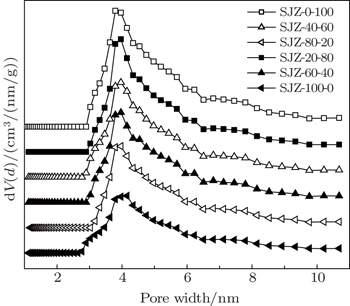
Figure
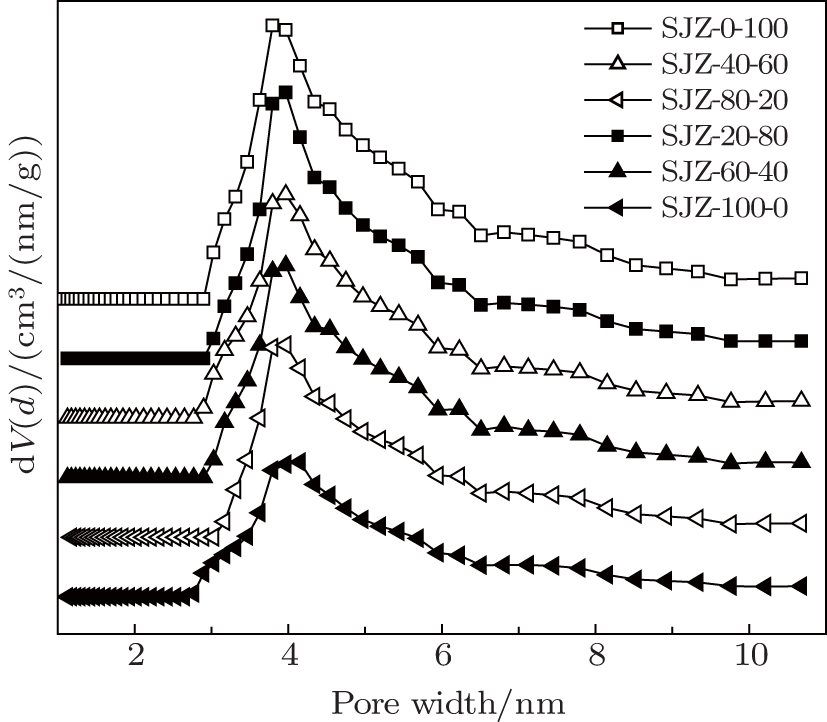 | Fig. 5. Pore size distributions obtained by applying the DFT equation for the coals. |
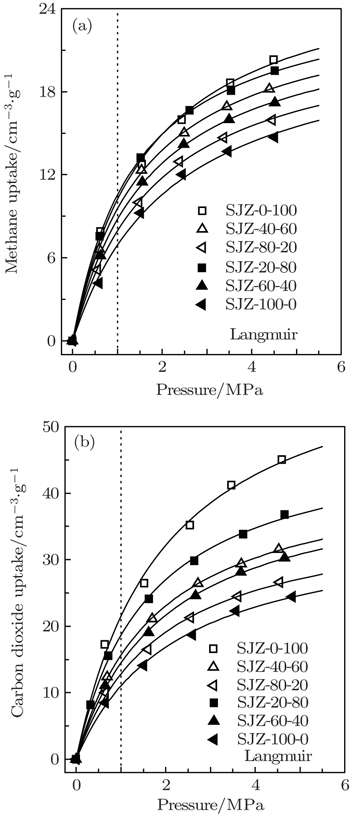
Figure
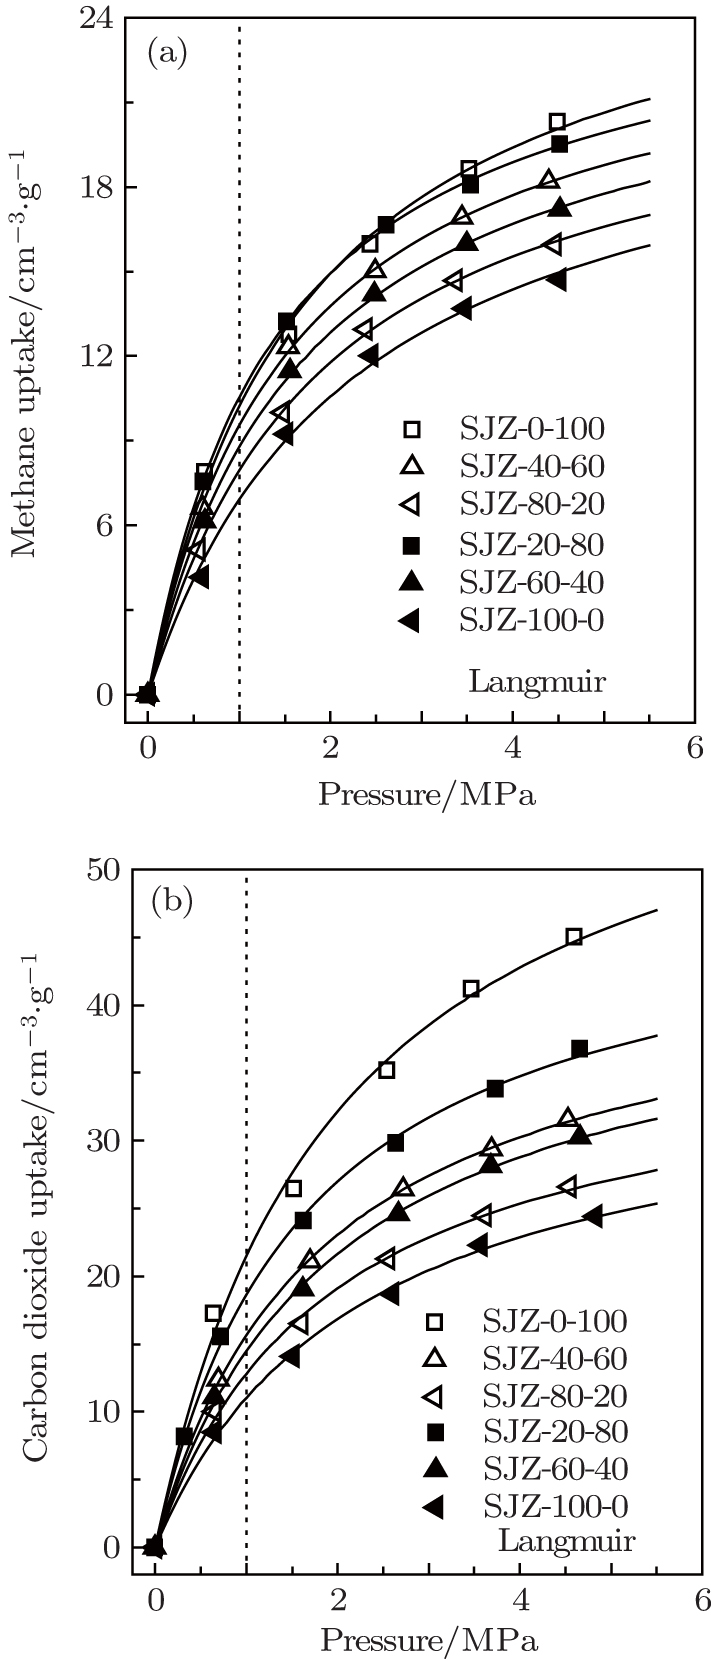 | Fig. 6. CH4 (a) and CO2 (b) adsorption isotherms of the coal samples, obtained by applying the Langmuir model (solid lines) at 308 K. |
Figure
Because of its simplicity and providing a reasonable fit to most experimental data, the Langmuir model is widely used in the CBM industry and relevant reservoir simulations. Hence, in the present work the Langmuir model is used to fit the adsorption data, which fits experimental results quite well (R2 > 0.99). The adsorption parameters of the Langmuir model are listed in Table
| Table 3. Adsorption parameters obtained from Langmuir model of the coal samples. . |
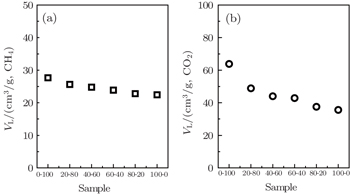
The parameter VL in the model is the maximum uptake of the adsorbent, and b is the reciprocal of the pressure when the adsorption capacity reaches 50% of the maximum uptake. The values of maximum adsorption capacity (VL) of the coal samples vary from 22.422 cm3/g to 27.686 cm3/g for CH4 and from 35.638 cm3/g to 63.818 cm3/g for CO2, respectively. It reveals that the particle size has a significant effect on the gas adsorption capacity for the coal samples, i.e., the gas adsorption capacity increases as the coal particle size decreases. From Fig.
 | Fig. 7. Relationships between maximum adsorption capacity of CH4 (a) and CO2 (b) and particle size distributions of the samples. |
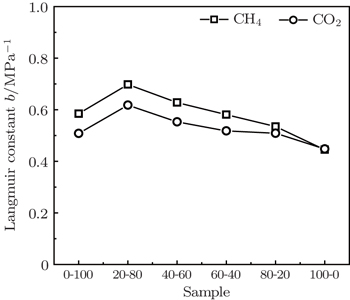
Figure
 | Fig. 8. Relationships between Langmuir constant b and particle size of the coals. |
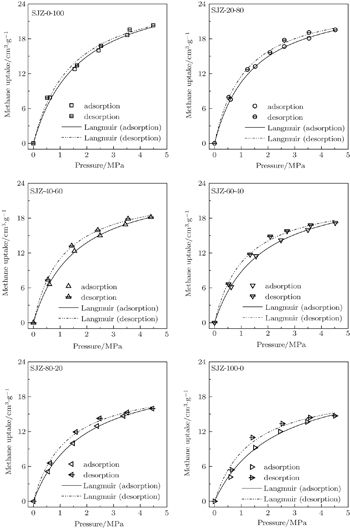
Figure
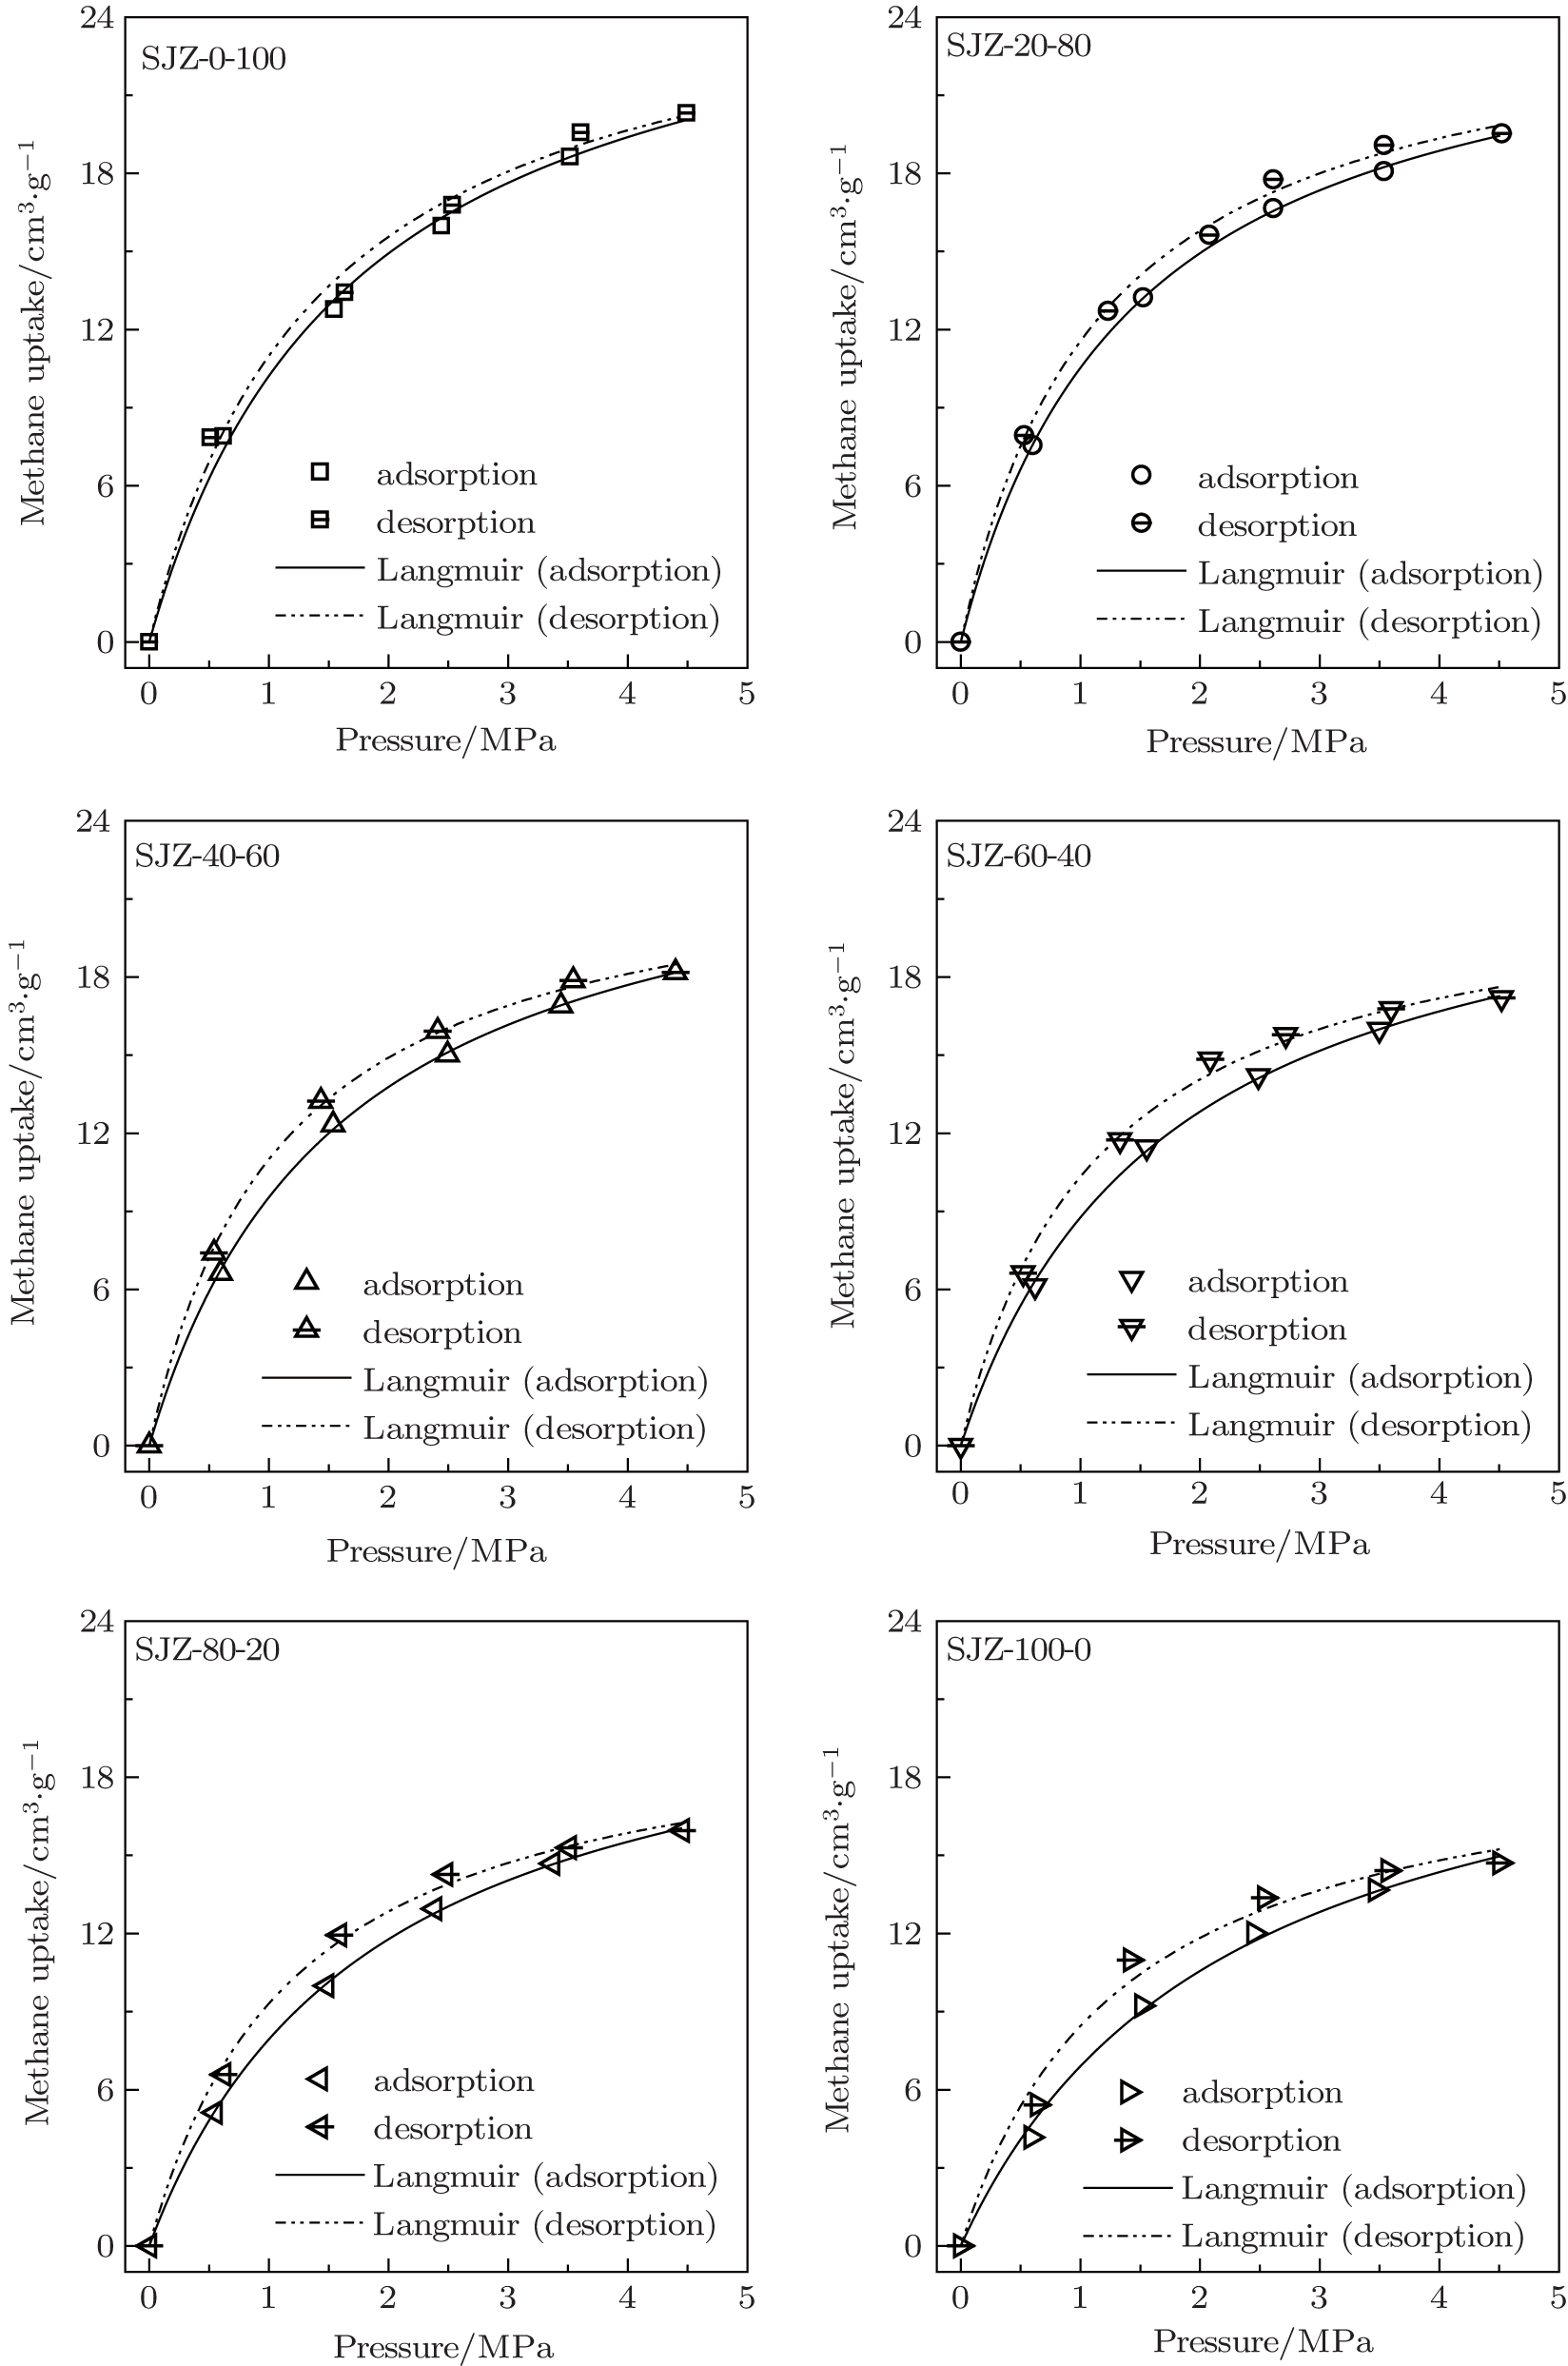 | Fig. 9. CH4 adsorption/desorption isotherms of the coals. |
Figure
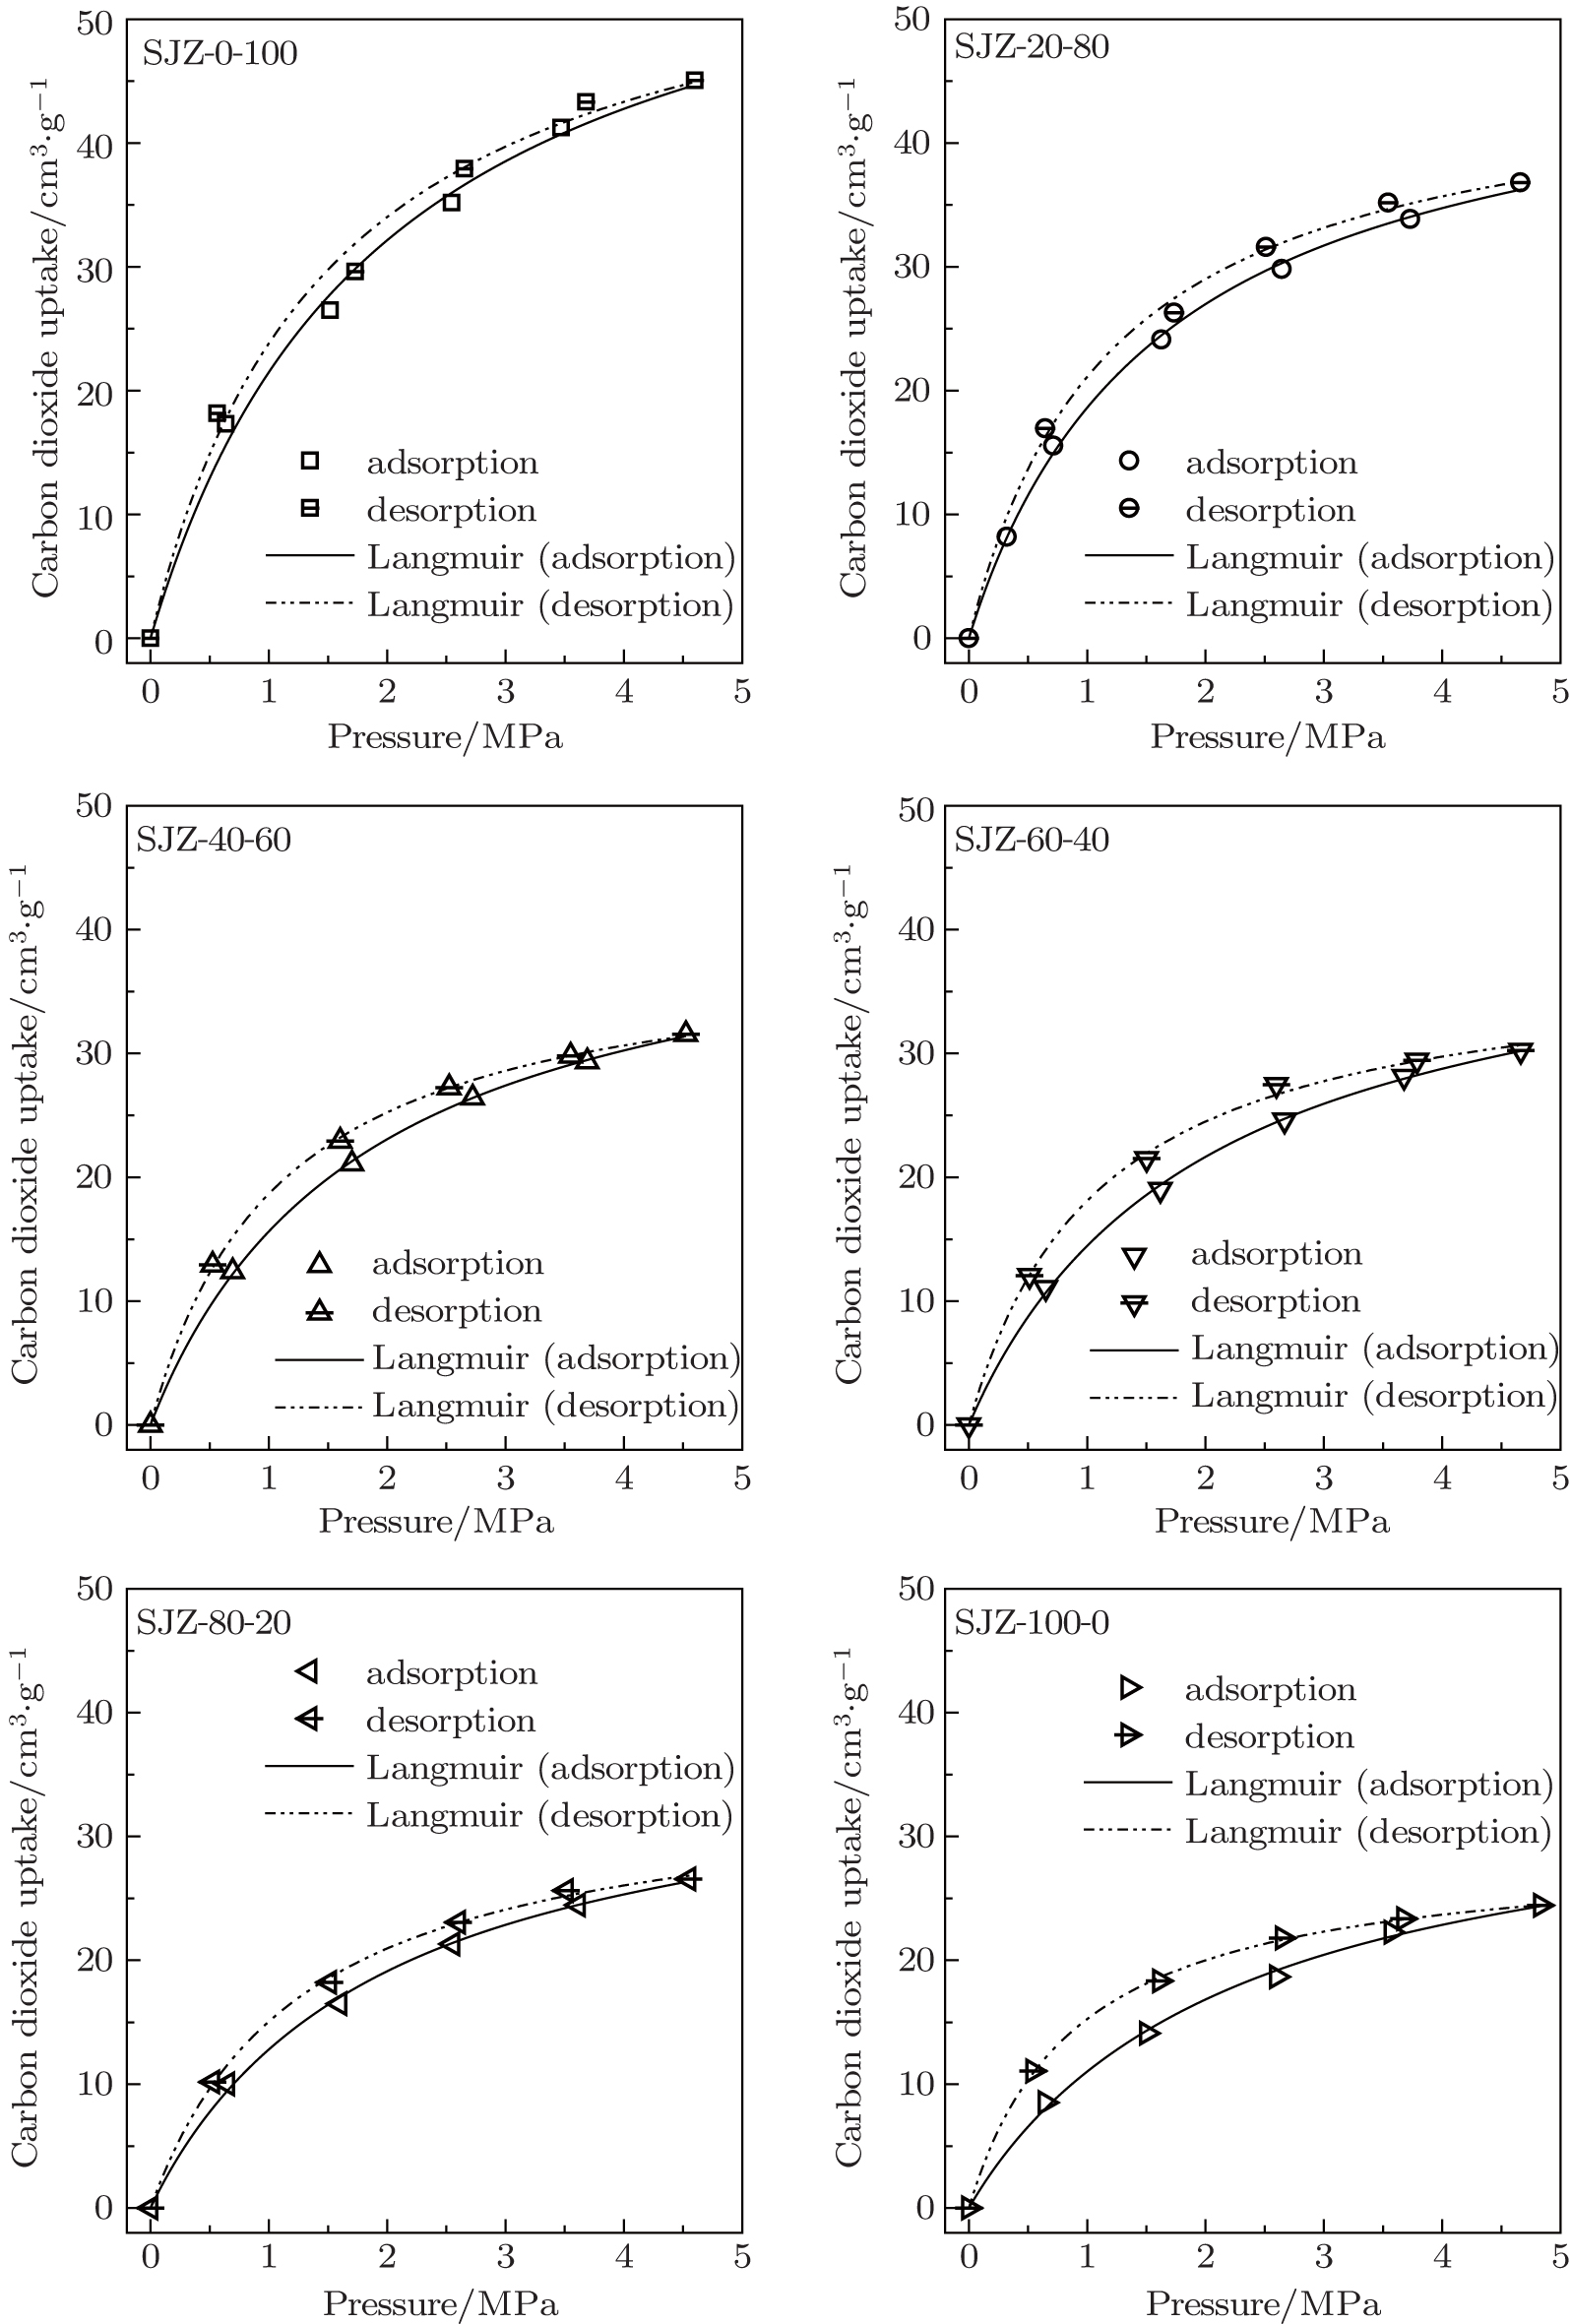 | Fig. 10. CO2 adsorption/desorption isotherms of the coals. |
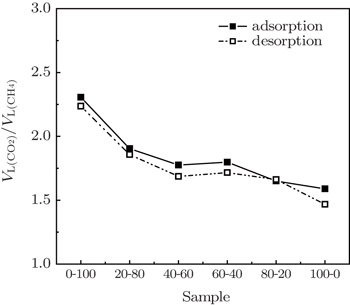
The ratio of the maximum adsorption capacities VL(CO2)/VL(CH4) derived from adsorption and desorption isotherms is consistently greater than 1, reflecting the preferential adsorption of CO2 compared with CH4 and implicating the feasibility of CO2 enhanced methane recovery (CO2-ECBM). From Fig.
 | Fig. 11. Ratios of the maximum uptake for CO2/CH4. |
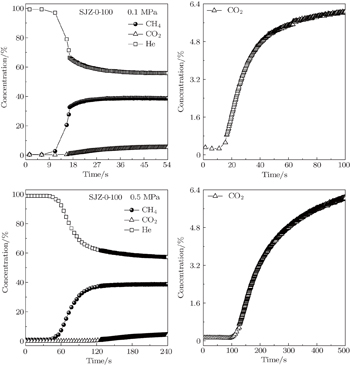
Figure
 | Fig. 12. Breakthrough curves of He, CO2, and CH4 on the coal sample SJZ-0-100 at 298 K under different pressures. |
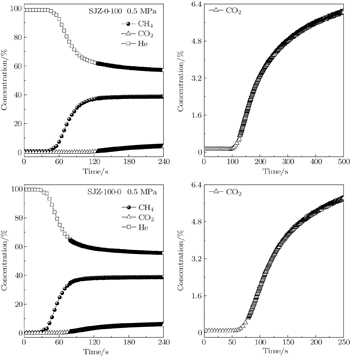
Figure
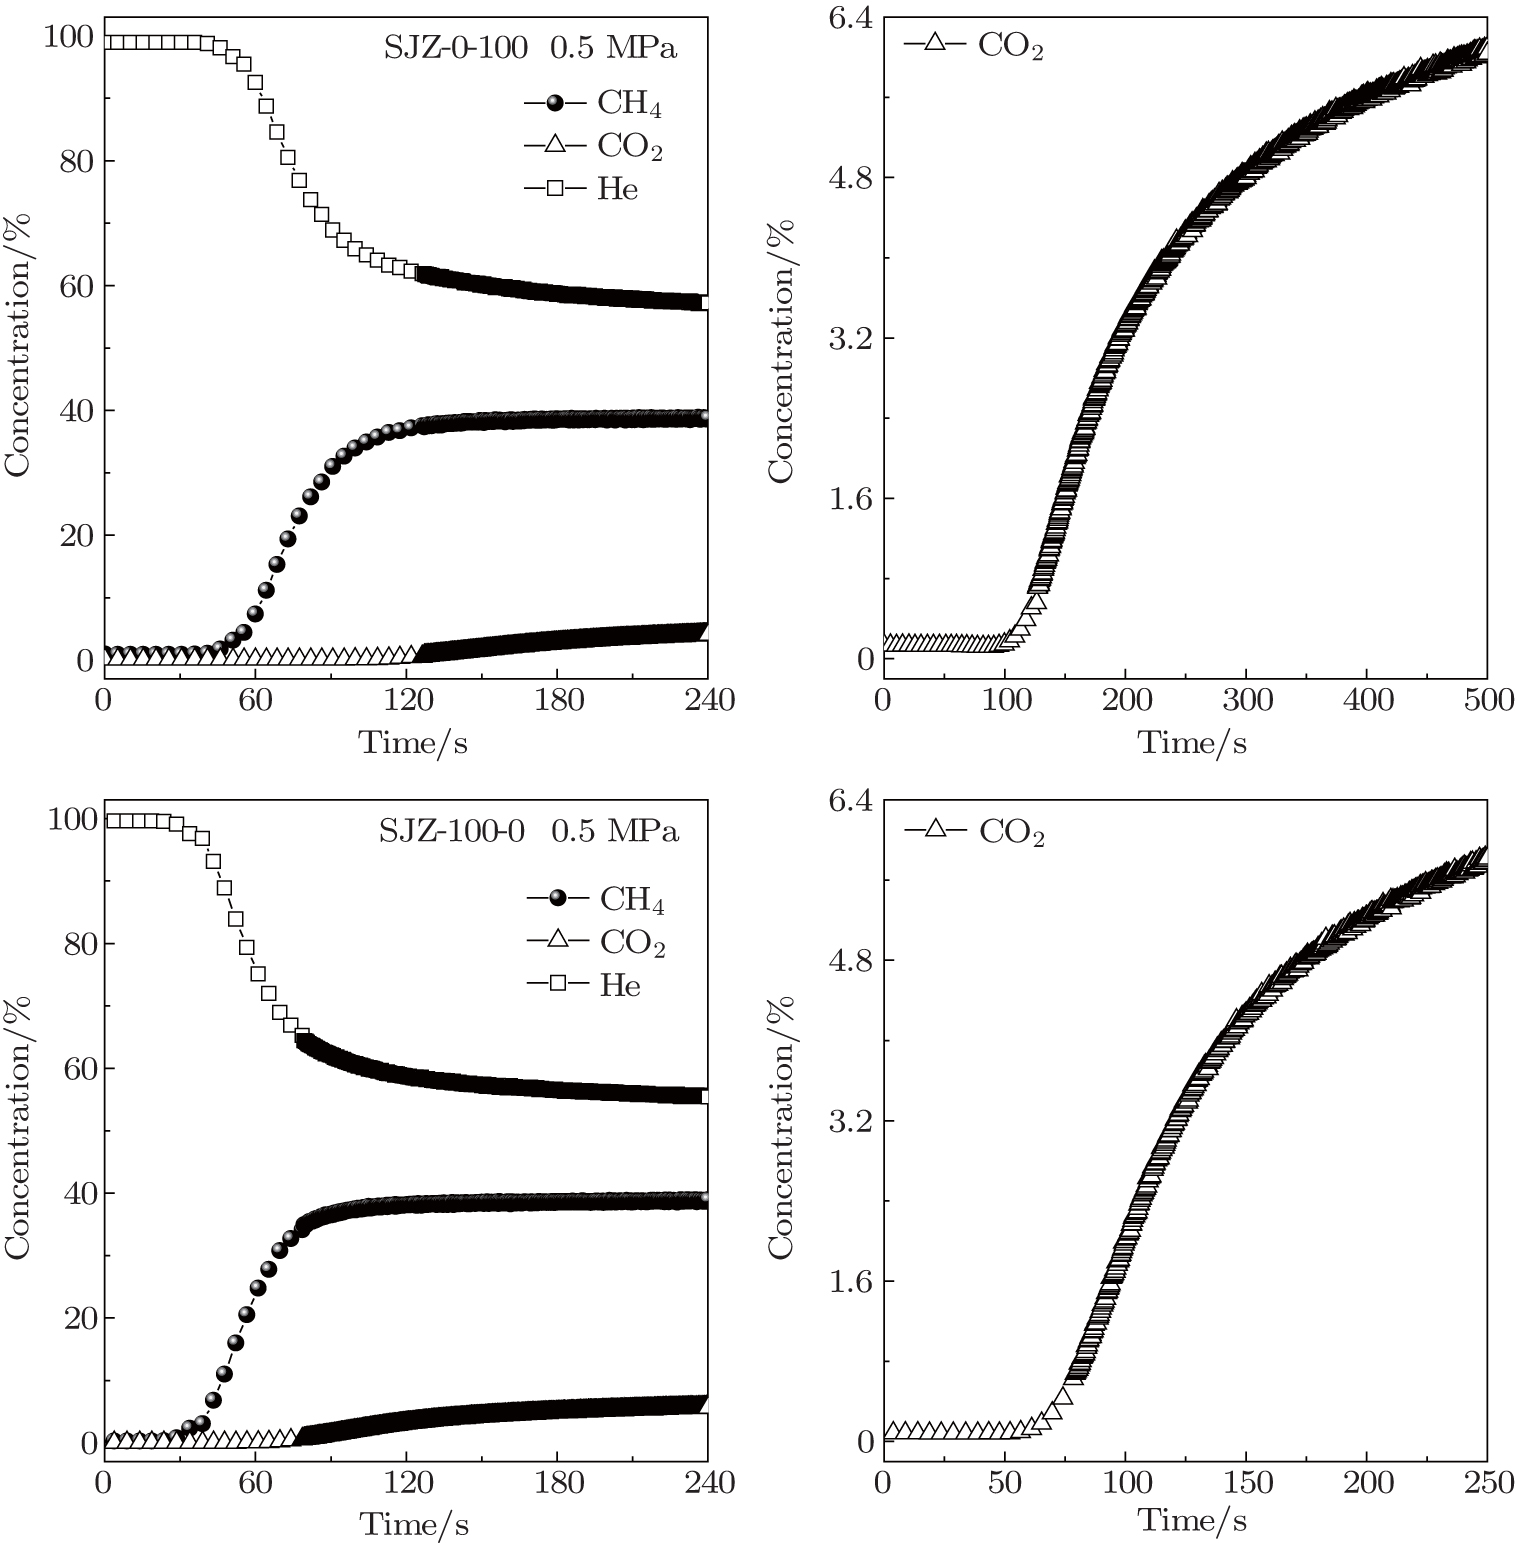 | Fig. 13. Breakthrough curves of He, CO2, and CH4 on the typical samples SJZ-0-100 and SJZ-100-0 at 0.5 MPa. |
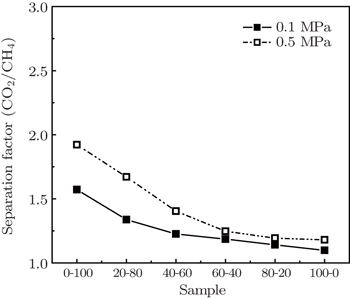
 | Fig. 14. Separation factors of CO2/CH4 versus coal sample under pressures of 0.1 MPa and 0.5 MPa. |
Gas adsorption and desorption behaviors on coals with varying particle sizes are studied in this work. The adsorption and desorption characteristics of CH4 and CO2 are investigated at 308 K and pressures up to 5.0 MPa by a volumetric method. Dynamic adsorption tests of the samples are carried out at 298 K and at pressures of 0.1 MPa and 0.5 MPa, respectively. The experimental data are fitted by the Langmuir model, and the fitting results show that the Langmuir model fits the data well. The gas adsorption on coals is related to their physical structures and particle sizes. As a result, there is a positive correlation with the particle size and the SSA and PV of samples, i.e., coal with smaller particle size has higher SSA, higher PV and lower PD.
Coal particle size is correlated strongly with CH4 and CO2 adsorption capacities. Langmuir volume VL decreases with coal particle size increasing, and the difference in VL(CH4) among coal samples with various particle sizes is smaller than that of CO2. The adsorption and desorption isotherms have apparent hystereses for both CH4 and CO2, caused by all range of particle size coals, and larger particle size coals show a larger hysteresis. The difference in VL(CH4)/VL(CO2) becomes smaller with increasing coal particle size, and thus the degree of preferential adsorption of CO2 is reduced. The dynamic adsorption results indicate that with the increase of coal particle size, the differences in adsorption capacity between CO2 and CH4 decreases, which is in good agreement with the results of the gas adsorption and desorption characteristics.
| 1 | |
| 2 | |
| 3 | |
| 4 | |
| 5 | |
| 6 | |
| 7 | |
| 8 | |
| 9 | |
| 10 | |
| 11 | |
| 12 | |
| 13 | |
| 14 | |
| 15 | |
| 16 | |
| 17 | |
| 18 | |
| 19 | |
| 20 | |
| 21 | |
| 22 | |
| 23 | |
| 24 | |
| 25 | |
| 26 | |
| 27 | |
| 28 | |
| 29 | |
| 30 | |
| 31 | |
| 32 | |
| 33 | |
| 34 | |
| 35 | |
| 36 | |
| 37 | |
| 38 |