1. IntroductionThermoelectric materials are attracting considerable attention because they can directly convert waste heat into electrical energy.[1] The thermoelectric efficiency of a material is determined by its figure of merit ZT = α2σT/κ, where α is the Seebeck efficient, σ is the electrical conductivity, and κ is the thermal conductivity.[2] Thus, low lattice thermal conductivity in combination with reasonable electrical conductivity is the most important requirement to obtain excellent thermoelectric properties.
The phonon-glass property of the semiconducting clathrate compound, which satisfies the “phonon glass-electron crystal” concept,[3] determines the candidate position of promising thermoelectric material. Many types of clathrates are available, among which type-I and type-VIII of Si-, Ge-, and Sn-based thermoelectric clathrates have drawn significant attention,[4–7] the Sn-based clathrates can be potentially used in thermoelectric electricity generation because of their low lattice thermal conductivities and high Seebeck efficients.[8–11]
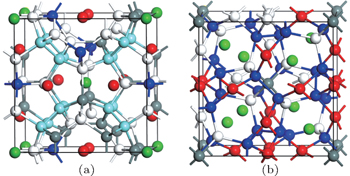
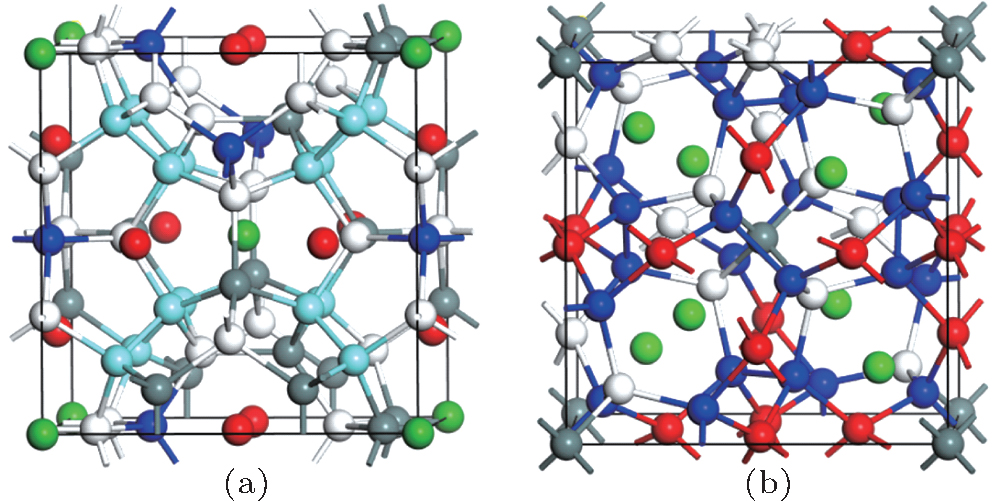
Ba8Ga16Sn30 (BGS) is a dimorphic compound with type-I and type-VIII structures.[9,10] The unit cell of type-I clathrate (space group  ) consists of two dodecahedra and six tetrakaidecahedra,[12,13] in contrast, the type-VIII (space group
  ) cubic structure consists of eight distorted dodecahedra as shown in Fig. 1.[14] The introduced Ba atoms in cages have enough space to produce a low-frequency localized vibration because of their smaller radius than that of the framework atoms, and scatter heat-carrying phonons effectively, thereby reducing thermal conductivity.[15,16]
BGS and Sn-based clathrate with elemental partial substitution for Ga in the framework of BGS possesses high values of ZT.[17–21] Saiga et al.[17] enhanced the ZT values of p- and n-type type-VIII BGS up to 1.0 and 0.9 at 480 K, respectively, using optimized carrier concentrations of samples. Meng et al.[18] synthesized single crystal VIII-Ba8Ga16−xGexSn30 by partial substitution of Ge for Ga, electrical conductivity was enhanced by 62% through doped Ge, and obtained the maximum ZT value of 1.25 when x = 0.5 at around T = 500 K. Deng et al.[19] doped Cu into type-VIII Ba8Ga16−xCuxSn30 at a very low level of x (0.033), which resulted in the highest ZT of 1.35 among the ZT values of the n-type substituted BGS samples. Thus, the ZT values for the n-type BGS were enhanced by partial substitution of Ge or Cu for Ga in the framework. Moreover, Du et al.[22] recently found that type-I Ba8Ga16Sn30 is stable only in a certain temperature range, and this material transforms into type-VIII Ba8Ga16Sn30 when heated to 739 K. However, Saiga et al.[23] reported that Ba8Ga16Sn30 with type-I structure changes into type-VIII when heated above 520 K. Also, our previous work found that the syntheses at different reactive temperatures lead to different types of clathrates.[24] The thermoelectric materials are usually used at high temperature. Thus, more accurate information about structure stability under high-temperature and the evolution of the thermoelectric property based on temperature is extremely important for practical application. Furthermore, doping can usually increase effectively the ZT value, however, little attention has been paid to the effect of doping on structure stability. Therefore, in the present work, the structure stabilities for type-I and type-VIII Ba8Ga16Sn30 are systematically examined, and the influence of Cu doping on the structure stability is explored. Finally, the evolutions of electrical conductivity and thermoelectric property of samples based on temperature are analyzed.
2. ExperimentThe Sn-flux method was adopted to prepare single-crystalline samples of Ba8Ga16−xCuxSn30. High-purity elements Ba (ingot, 99.9%), Ga (ingot, 99.999%), Sn (ingot, 99.999%), and Cu (ingot, 99.999%) were weighed according to the atomic ratio of Ba:Ga:Cu:Sn = 8:16–x:x:50 (x = 0, 1). Type-I and type-VIII samples were synthesized by heating the mixture, which was sealed in an evacuated quartz tube and heated, as follows: for x = 0, 490 °C and 500 °C; for x = 1, 540 °C and 560 °C. The mixture was maintained for 10 h and then slowly cooled over 50 h to 390 °C.[24] The quartz tube was removed from the furnace at 390 °C. The tube was then centrifuged to separate the crystals from the molten Sn solvent.
Phase was characterized by powder x-ray diffraction (XRD, Bruker D8 Cu Kα). Thermal stability was measured by thermogravimetry–differential thermal analysis (TG-DTA; STA449F3 Jupiter). Electron probe microanalysis (EPMA, JXA-8230) was used for chemical composition analysis. Electrical conductivity σ and Seebeck efficient α were measured at temperatures ranging from 25 °C to 250 °C. Comparison was performed using constantan (Ni: 40%) as a reference sample with a known α(T) to measure the Seebeck efficient α. The σ(T) values of the samples were measured by the DC current method, with the DC current kept at 20 mA. All measurements were performed in a vacuum to avoid oxidation.
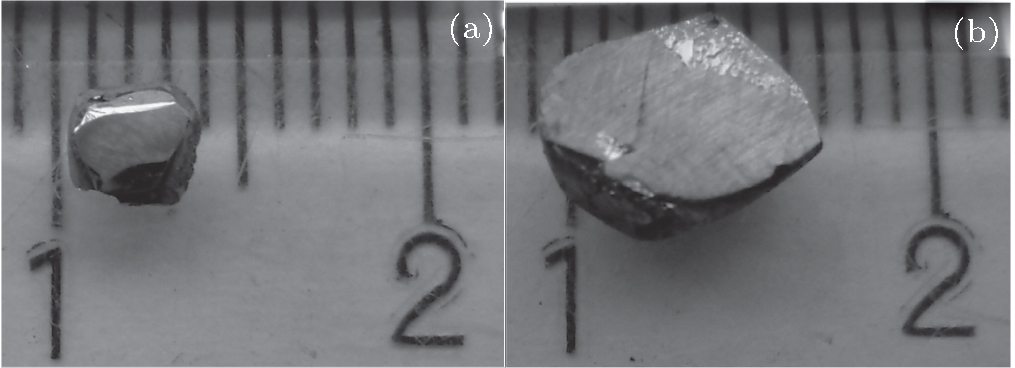
3. Results and discussion3.1. Structural stability of type-I clathrateThe crystal sizes of type-I single crystals are about 4 mm. By contrast, the type-VIII single-crystal samples obtained are approximately 7 mm in diameter. As shown in Fig. 2, all samples have shiny metallic lusters, some plate-like crystals with BaNiSn3-type structure coexist with the obtained reactant. The actual compositions for type-I and type-VIII BGSs approach to the ideal proportion Ba:Ga:Sn = 8:16:30. However, the actual Cu content is much lower than the nominal content of Cu composition for all Cu-doped samples.[24]
Thermostabilities of all samples are explored by performing DTA and XRD for pony-size (2 mm) samples. The samples are heated to 490 °C and then slowly cooled to 30 °C after having been maintained for 120 min. The heating and cooling rates are kept at 2 °C/min. To minimize the effect of the composition of a sample on the properties, all types of samples are cut from the corresponding same single crystal respectively.
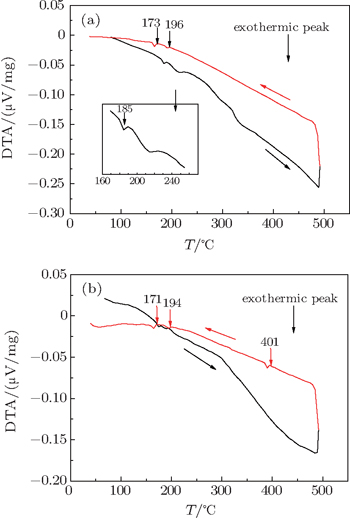
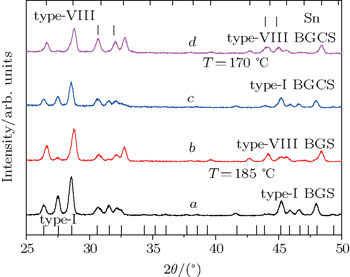
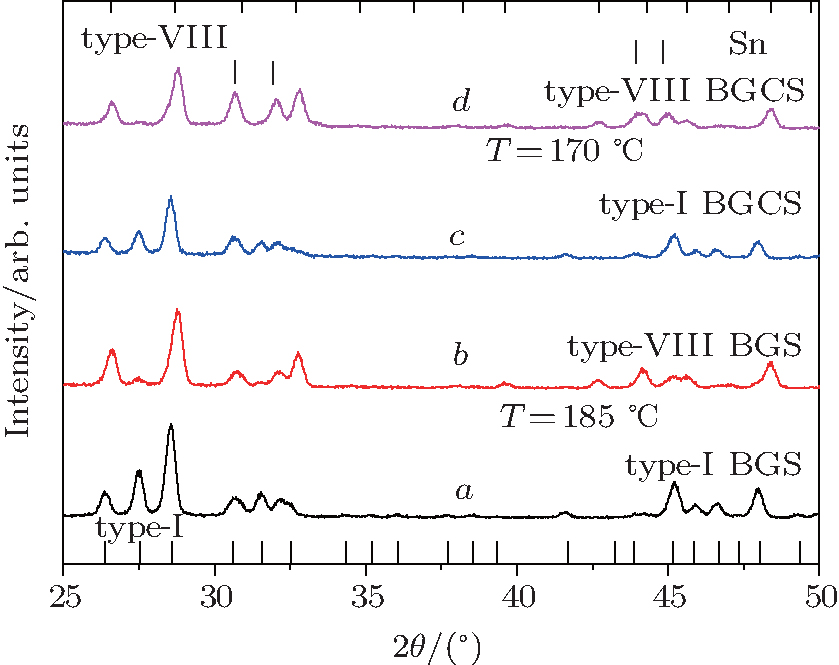
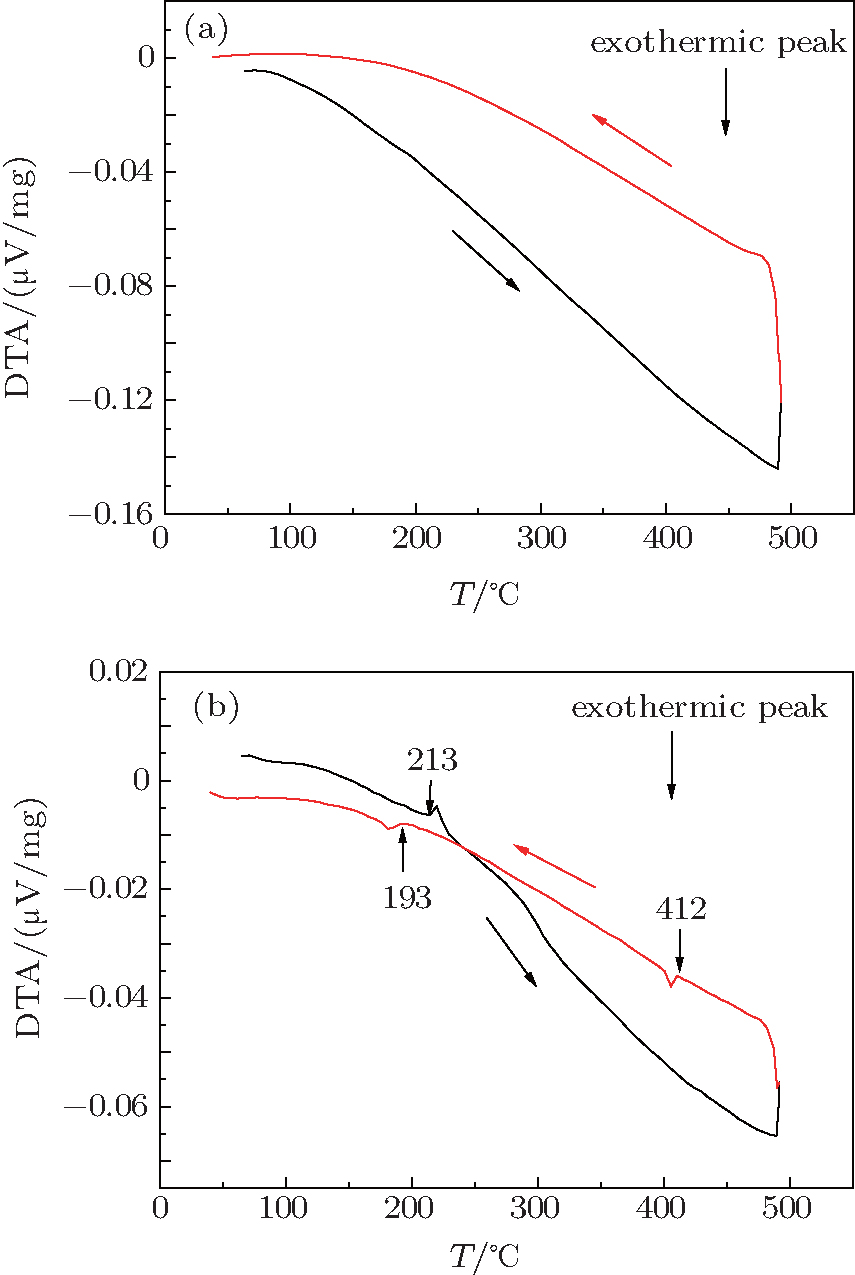
The heating curve of type-I BGS in Fig. 3(a) shows an exothermic peak at 185 °C. By contrast, two peaks are found to be at 173 °C and 196 °C on cooling, and these peaks correspond to the solidifications of impurity phase and Sn respectively.[22] To identify the peak at 185 °C, the crystal structure of type-I BGS, after being heated to different temperatures and maintained for 180 min then cooled down to room temperature, are identified by XRD. The XRD patterns for type-I BGS samples after being heated to different temperatures are compared with that of the initial one as shown in Fig. 4. The main diffraction peaks of Figs. 4(a) and 4(b) samples are indexed by type-I and type-VIII phase respectively, which indicates that the structure of type-I BGS is completely modified into type-VIII after having been heated to 185 °C. Therefore, the peak at 185 °C is attributed to the transformation of type-I into type-VIII BGS. Structural transformation is also observed in the type-I Ba8Ga15CuSn30 (BGCS) sample. However, the critical transition temperature of type-I BGCS to type-VIII phase is 170 °C, which is lower than that of BGS. These results suggest that type-I and type-VIII structures are the low- and high-temperature phases respectively, and the stability of type-I clathrate is reduced by doping Cu for type-VIII structure.
No additional peak is found on the cooling curve of type-I BGS in Fig. 3(a). However, figure 3(b) shows an additional exothermic peak at 401 °C on the cooling curve for type-I BGCS. Saiga et al.[23] reported that the transformation of type-I phase into type-VIII was not reversible. However, Du et al.[22] reported that type-VIII BGS can partially transform into type-I phase during cooling. Therefore, we explore the phase transformation from type-VIII phase to type-I by DTA combined with XRD.
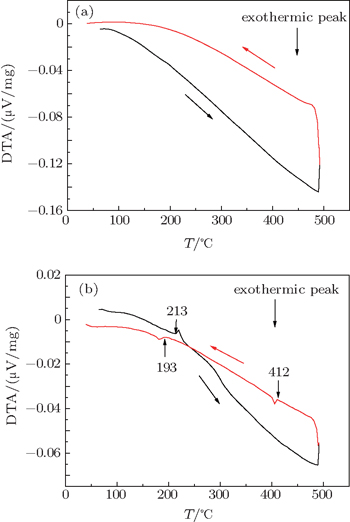
3.2. Structural stability of type-VIII clathrateNo peak is found on the heating and cooling curves of the type-VIII BGS heated to 490 °C (Fig. 5(a)). The XRD pattern in Fig. 7(a) evidently shows that the sample after having been heated to 490 °C is of type-VIII phase, which suggests that type-VIII BGS is stable. However, the DTA curve of the Cu-doped type-VIII BGCS heated to 490 °C shows a peak at 213 °C on the heating curve. This peak is related to the melting of Sn which does not separate from the surface of the single crystal. Two exothermic peaks are observed at 193 °C and 412 °C on cooling. The peak at 193 °C is contributed by the solidification of Sn. The XRD pattern in Fig. 7(b) shows that in addition to the peaks attributed to Sn and Ba(Ga/Sn)4, the main diffraction peaks of sample for type-VIII BGCS heated to 490 °C are indexed by type-VIII phase. Therefore, we infer that the peak at 421 °C is caused by decomposing the type-VIII BGCS into Sn and Ba(Ga/Sn)4.
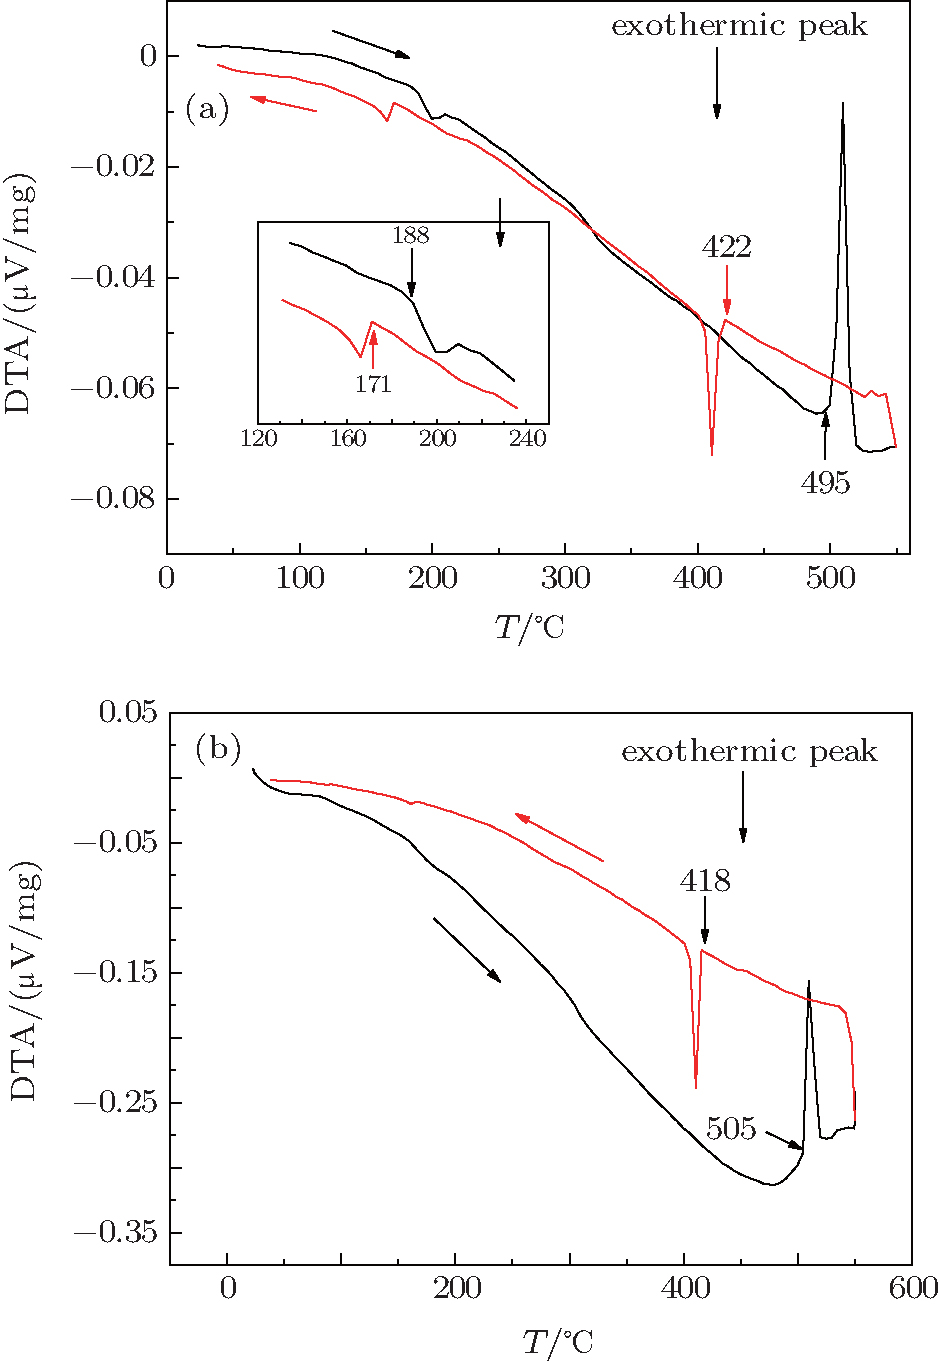
Type-I and type-VIII BGS are also heated to 550 °C. Figure 6(a) shows the DTA curve for type-I BGS heated to 550 °C. Two peaks are observed at 188 °C and 495 °C, and the endothermic peak at 495 °C is attributed to the melting of type-I BGS. Comparison between the first exothermic peak with that of Fig. 3(a) shows that the exothermic peak at 188 °C is attributed to the transformation of type-I into type-VIII BGS. Figure 6(b) shows the DTA curve of type-VIII BGS. The sharp endothermic peak at 505 °C on heating is attributed to the melting of type-VIII BGS. The cooling curve of type-I BGS is compared with that of type-VIII BGS. Results show sharp exothermic peaks at 422 °C and 418 °C for type-I and type-VIII BGS, respectively. Combined with the XRD patterns in Figs. 7(c) and 7(d), these results show that the molten state of type-I BGS can transform directly into type-VIII BGS and that melting type-VIII BGS transform directly into type-I phase on cooling. Du et al.[22] reported that type-I clathrate partially decomposes into Sn and Ba(Ga/Sn)4 (melting point is above 550 °C) on heating. Therefore, type-I BGS clathrate partially decomposes into Ba(Ga/Sn)4 during heating to 550 °C.
This phenomenon causes the chemical composition of the molten state to deviate from the ratio of 8Ba:16Ga:30Sn, and consequently, the melting type-I and type-VIII clathrate transform into type-VIII and type-I, respectively.
3.3. Theoretical analysisThe formation energy Ef and binding energy E0 of the system are calculated using the first-principle to elucidate the effect of Cu doping on the structural stability. Formation energy is defined as the total energy difference between the compound and its corresponding isolated bulk constituent elements.[25] The calculated method and results have been reported in our previous work,[24] and the Ef and E0 are increased with Cu doping, which agree with other theoretical work.[26,27] Thus, Cu doping will reduce the stabilities of I- and VIII-BGS, so the phase transition temperature of I-BGCS is lower than that of I-BGS.
Milliken population for the series is obtained for further revealing the effects of Cu-doping on structure of I- and VIII-BGS. As shown in Table 1, for Cu-doped I- and VIII-BGS, the Cu atom gains more charges than the Ga atom. Moreover, Ga 4p orbits and Cu 3d orbits are the dominating orbital contributions for the series, which are in good agreement with our previous results[24] and other theoretical result.[27]
Table 1.
Table 1.
 Table 1. Orbit populations and valence charges for the series. .
|
Atom |
s |
p |
d |
Total |
Charge/e |
| I-BGS |
Ga |
1.01 |
2.17 |
10 |
13.18 |
–0.18 |
| I-BGCS |
Cu |
0.9 |
1.12 |
9.87 |
11.89 |
–0.89 |
| VIII-BGS |
Ga |
1.01 |
2.20 |
10 |
13.21 |
–0.21 |
| VIII-BGCS |
Cu |
1.11 |
0.94 |
9.87 |
11.92 |
–0.92 |
| Table 1. Orbit populations and valence charges for the series. . |
Overlap populations and bond length for the series are analyzed. The results are shown in Table 2. The bonds between Ga and Sn in I- and VIII-BGS are primarily the covalent interactions and electronic interactions respectively. With Cu doping, the bond between Cu and Sn in both structures is assumed to be a covalent interaction, nevertheless, the bond interaction is weakened, thus the stabilities of the structure for I- and VIII-BGS decrease with Cu-doping content increasing.
Table 2.
Table 2.
Table 2. Overlap populations and bond lengths for the series. .
|
Bond |
Overlap populations |
Bond length |
| I-BGS |
Ga–Sn |
0.68 |
2.69948 |
| I-BGCS |
Cu–Sn |
0.61 |
2.61391 |
| VIII-BGS |
Ga–Sn |
–0.53 |
2.69388 |
| VIII-BGCS |
Cu–Sn |
0.43 |
2.60472 |
| Table 2. Overlap populations and bond lengths for the series. . |
3.4. Electrical propertiesWe have previously explored the electrical properties of type-VIII Ba8Ga16−xCuxSn30 single crystals, and Cu doping significantly improving the conductivity of type-VIII BGS;[19] our experimental results revealed that the electrical properties of the type-VIII phase have a negligible variation after the high-temperature heating process.[24] Hence, the present paper aims to investigate the effects of the high-temperature heating process on the electrical and thermoelectric property of type-I phase, and the evolutions of electrical conductivity and thermoelectric property of type-I samples based on temperature are investigated.
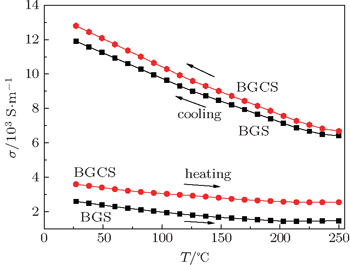
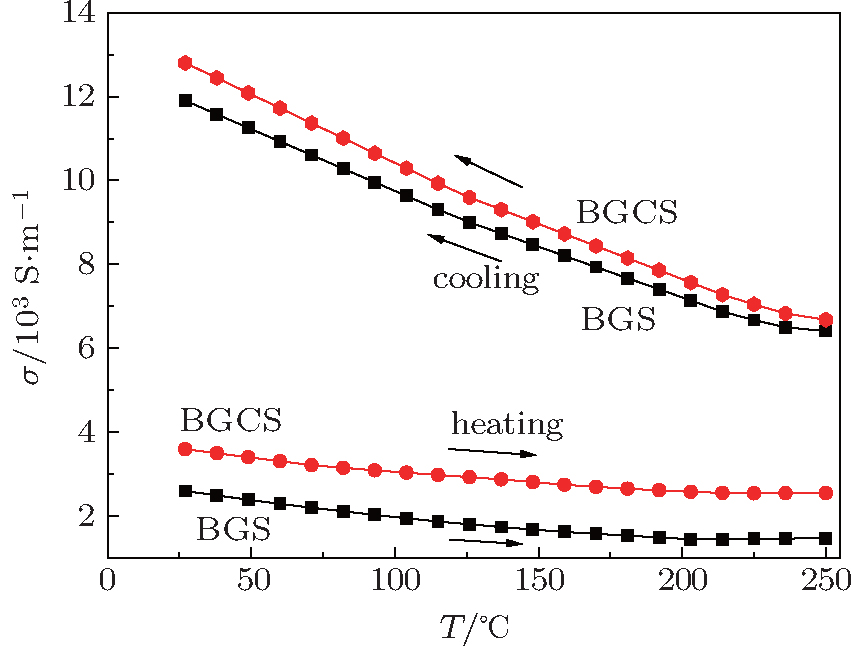
The plots of electrical conductivity σ of type-I samples versus temperature on heating and cooling between 25 °C and 250 °C are shown in Fig. 8. The value of σ (25 °C) for type-I BGS is 2.6 × 10³ S/m, which agrees with other reported values.[23] Cu-doping obviously enhances the σ of type-I BGS samples. The samples display preferable electrical conductivities during the cooling process after the samples have maintained at 250 °C for 180 min compared with type-I samples, the samples exhibit type-VIII characteristic. The cooled samples are heated again in order to accurately measure the σ, and results also exhibit type-VIII characteristic, which agrees well with the fact that type-I samples transform into type-VIII phase at high temperature.
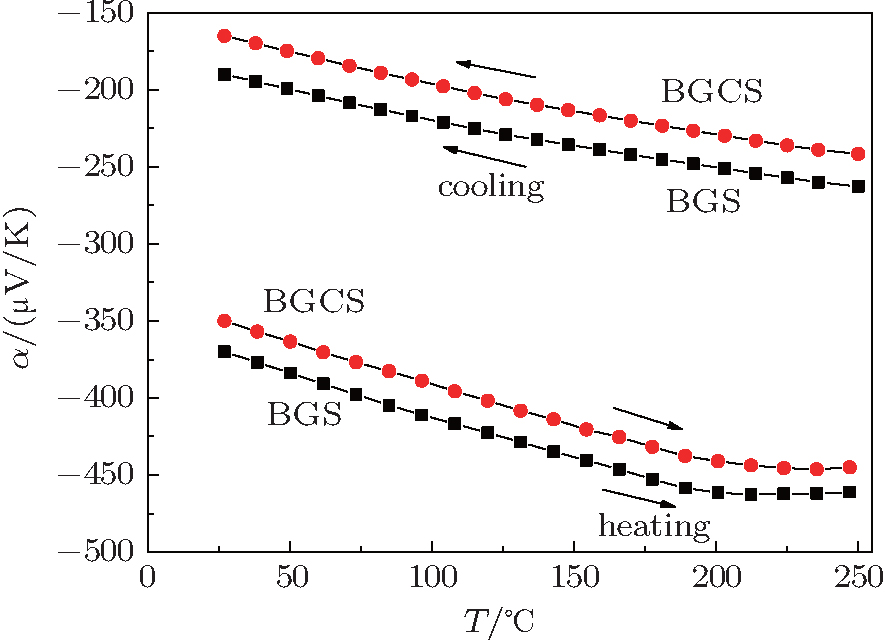
The Seebeck efficient α of all single crystals samples are negative (Fig. 9), indicating that the prepared samples possess n-type conductivity. The value of |α| for type-I BGS is increased with temperature increasing. Cu-doping reduces |α| of type-I BGS sample. On cooling, the |α| values of samples show type-VIII characteristics, but the values of |α| are lower than those of type-VIII samples.[19,21]
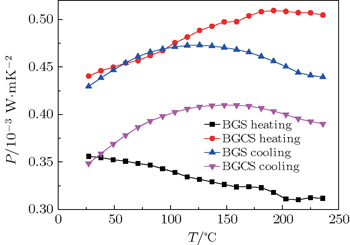
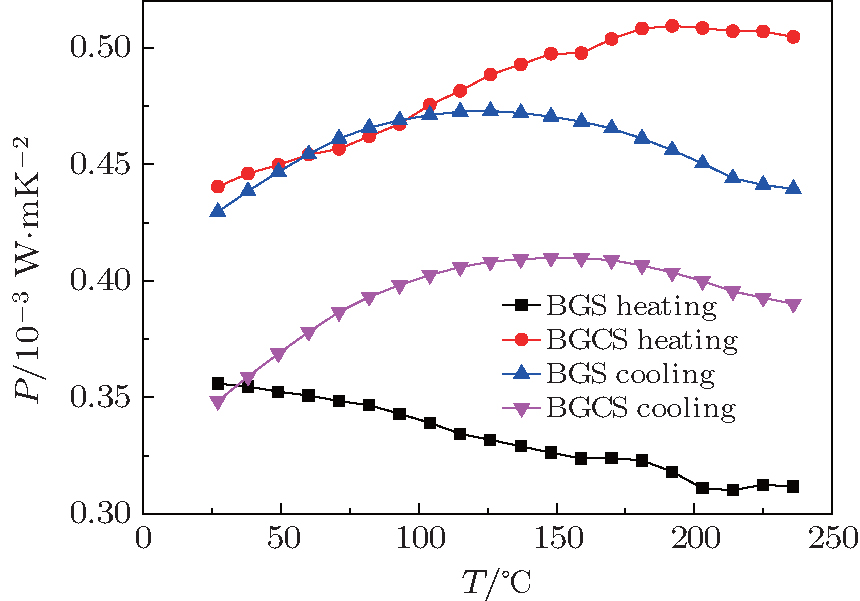
The temperature dependences of the power factor for type-I single crystals are shown in Fig. 10. The valve of P (25 °C) for type-I BGS is 0.36 × 10⁻³ W/mK2, which agrees with other experimental results.[23] Cu-doping enhances P dramatically, which reaches 0.44 × 10⁻³ W/mK2 (25 °C) due to superior σ. With temperature increasing, the P of I-BGCS increases up to a maximum of 0.51 × 10⁻³ W/mK2 at around 200 °C. On cooling, the P of I-BGS is improved, in contrast, the P of I-BGCS decreases due to the variations of α and σ.
4. ConclusionsThe structural stabilities and electrical properties of Cu-substituted Ba8Ga16−xCuxSn30 single crystals are explored by first principle and experiment. The theory indicates that Cu doping will reduce the stabilities of I- and VIII- Ba8Ga16Sn30. The DTA curve and powder XRD results indicate that type-I BGS transforms into type-VIII above 185 °C, and that the critical transform temperature of type-I BGCS is lower than that of type-I BGS. Type-VIII BGS is stable during heating and cooling. However, type-VIII BGCS decomposes into Sn and Ba(Ga/Sn)4 during cooling. The molten state of type-I BGS can transform directly into type-VIII BGS, and the melting type-VIII BGS can transform into type-I phase on cooling. The measured electrical properties suggest that Cu doping enhances the electrical conductivity of type-I BGS. However, the absolute value of the Seebeck efficiency decreases. The type-I sample after phase transformation exhibits type-VIII characteristics. After heating treatment, the power factor of BGS is improved, in contrast, the P of BGCS is reduced due to the variations of α and σ.


 ]
]