


Mechanism of contact angle saturation and an energy-based model for electrowetting
[Zhao Rui, Liang Zhong-Cheng†,  ]
]
]
|
|


† Corresponding author. E-mail:
Project supported by the Fund from the Research Center of Optical Communications Engineering & Technology, Jiangsu Province, China (Grant No. ZSF0402).
Electrowetting, as a well-known approach to increasing droplet wettability on a solid surface by electrical bias, has broad applications. However, it is limited by contact angle saturation at large voltage. Although several debated hypotheses have been proposed to describe it, the physical origin of contact angle saturation still remains obscure. In this work, the physical factors responsible for the onset of contact angle saturation are explored, and the correlated theoretical models are established to characterize electrowetting behavior. Combination of the proper 3-phase system employed succeeds in dropping the saturating contact angle below 25°, and validates that the contact angle saturation is not a result of device-related imperfection.
Electrowetting refers to reducing the contact angle of droplets by applying a voltage between a droplet and a dielectric coated electrode, which has found numerous potential applications in lab-on-chip,[1,2] optics,[3,4] and displays.[5–7] The contact angle change with voltage, described by the Young–Lippmann equation, predicts that the contact angle can be modulated to zero by increasing the voltage. However, the contact angle in fact reduces to a non-zero contact angle value beyond a critical external voltage, which deviates from the basic electrowetting theory, i.e., the Young–Lippmann equation. This phenomenon is widely known as contact angle saturation,[8–12] which restricts the electrowetting-based applications.[12–14]
In recent years, more and more investigations focused on exploring the underlying mechanisms responsible for contact angle saturation.[12–16] Several debated hypotheses such as dielectric breakdown,[11] zero interfacial tension,[12] charge trapping,[13] and air ionization[14] have been proposed to ascertain this saturation phenomenon. Unfortunately, the physical origin of contact angle saturation is still poorly clarified, and the relevant theory that can directly predict the onset of the saturation and reducing the saturation of contact angle for a specific system, is scarce.
In this work, the physical origins of contact angle saturation are explored, and also a theoretical model is constructed to describe the variation of contact angle change with applied voltage at higher voltage. In the experiment, a 3-phase system consisting of different combinations of conductive fluid and oil is employed to measure the saturating contact angle response to the increasing voltage. We deduce that electrowetting saturation is dominated by the interfacial tension of the 3-phase system and the surface tension of conductive liquid. The saturating contact angle occurs once ions escape from the main droplet and form into small droplets. The relevant results will enrich the theory of electrowetting saturation and expand its application scope in electrowetting devices where an even larger range of contact angle modulation is desired.
Here we divide the electrowetting evolution into three stages: the first stage is that the change of cosine of the apparent contact angle (θv) with voltage can be well described by the Young–Lippmann equation,[2] the second stage starts when the cosine of the contact angle deviates from the parabolic behavior predicted by the Young–Lippmann equation and ends when the contact angle ceases to respond to voltage, and the onset of the third stage corresponds to the point where the contact angle stops decreasing and keeps constant.
The classification criterion of the electrowetting evolution mentioned above mainly rests on the force analysis around the triple contact line and interface. When the applied voltage is low, the triple contact line is pinned and the local contact angle remains equal to Young angle θY.[16–18] The increase in electrostatic force tends to reduce the apparent angle θv while the local angle θY keeps constant.[18] The transition from the first stage to the second stage depends on the movement of the triple contact line, herein the potential point is defined as the first threshold potential (VTh1). Beyond Vth1, the electrowetting force is strong enough to conquer the pinning force at triple phase contact line and drive the triple contact line into movement, accordingly the electrowetting evolves into the second-stage. In this stage, the oil viscous effect, oil resistance, and dynamic friction hinder the movement of triple contact line and result in the discrepancy between the electrowetting behavior and the Young–Lippmann equation.[17] Keeping on increasing the voltage, the growing electrostatic force will eventually exceed the bonding force acting on the ions (or charges). The ions (or charges) start to escape from the main droplet once the interfacial tension can neither hold the ion(or charges) nor balance the electrowetting force,[19] here the point of potential is called the second threshold voltage VTh2. When V > VTh2, the contact angle stops decreasing and the corresponding electrowetting evolution transfers from the second stage to the third stage.
According to the classification listed above, the Young–Lippmann equation is accurate to describe the first stage, and the contact angle keeps constant in the third stage. The following work mainly focuses on the second stage. A theoretical model is established to predict the variation of transient contact angle with higher potential for the second stage. Since the size of droplet is smaller than the capillary length (droplet volume is 0.5 μl), the surface tension has an influence on the droplet shape while the gravity is ignored.[20] To simplify the problem, the droplet is considered to remain spherical in shape in the electrowetting process, which is illustrated in Fig.


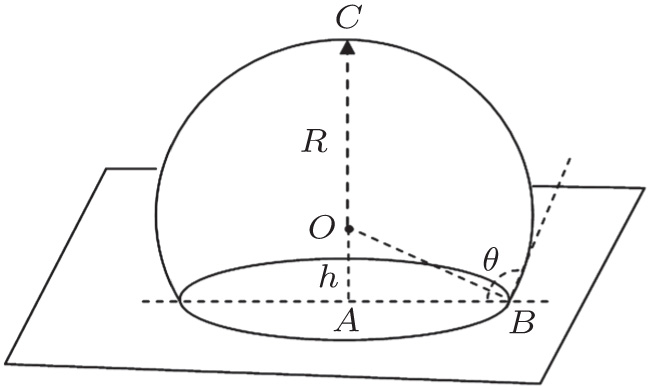 | Fig. 1. Diagram of a droplet with radius R and contact angle θ. |
Differentiating Eqs. (
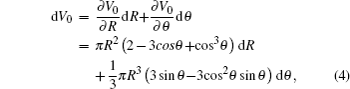


Assuming that the droplet volume keeps constant, the differential equation of droplet volume equals zero, i.e., dV0 = 0, and consequently

The changes of Helmholtz free energy from the side and base tension energy because of the droplet spreading, are


Here γci, γcd, and γid denote the interfacial tension between conductive fluid and insulating fluid, conductive fluid and dielectric surface, and insulating fluid and dielectric surface, respectively.
When the potential V is applied to the electrowetting system, change of Helmholtz free energy induced by electrostatic energy is

Substituting Eq. (

During the droplet spreading and contact line movement, the energy dissipation is dominated by the viscous effect, drag force, oil resistance, and dynamic friction around the triple contact line.[21]
The viscous friction force and drag force of the moving contact line are linear with respect to the velocity of droplet edge movement[17,21]


Here, n ∼ 10 is the logarithm of macroscopic length over microscopic length, and α is a constant. For simplicity, equation (

The components of energy dissipation caused by the viscous effect, oil resistance and dynamic friction are shown as[22]
The total change of Helmholtz free energy is expressed as

The electrowetting system satisfies the Helmholtz free energy minimization once it reaches equilibrium, one can have

Substituting Eqs. (
The relation for the whole electrowetting evolution is shown below

The threshold voltages VTh1 and VTh2 in Eq. (

When voltage increases to VTh2, the electrowetting force value Fel = ε0εr/2dV2 starts to exceed the capillary force Fcap = γci(cosθv−cosθY), the surface tension γ of the conducting fluid and static friction forces. Before the contact line moves and contact angle decreases, the ions start to break the fluid bondage because of the lower interfacial energy, escape from main drop and then lead to electrowetting saturation. By eliminating the static friction force FP, we can have

Rearranging Eq. (
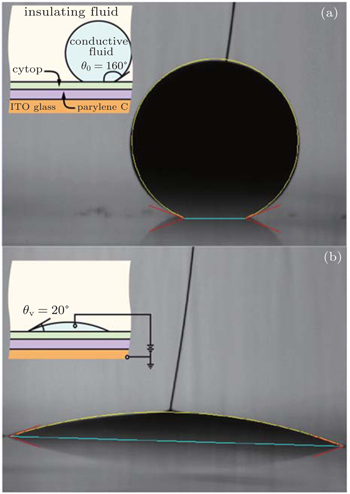
A series of experiments is implemented to verify the validity of the proposed theoretical model. The photos of electrowetting are shown in Fig.
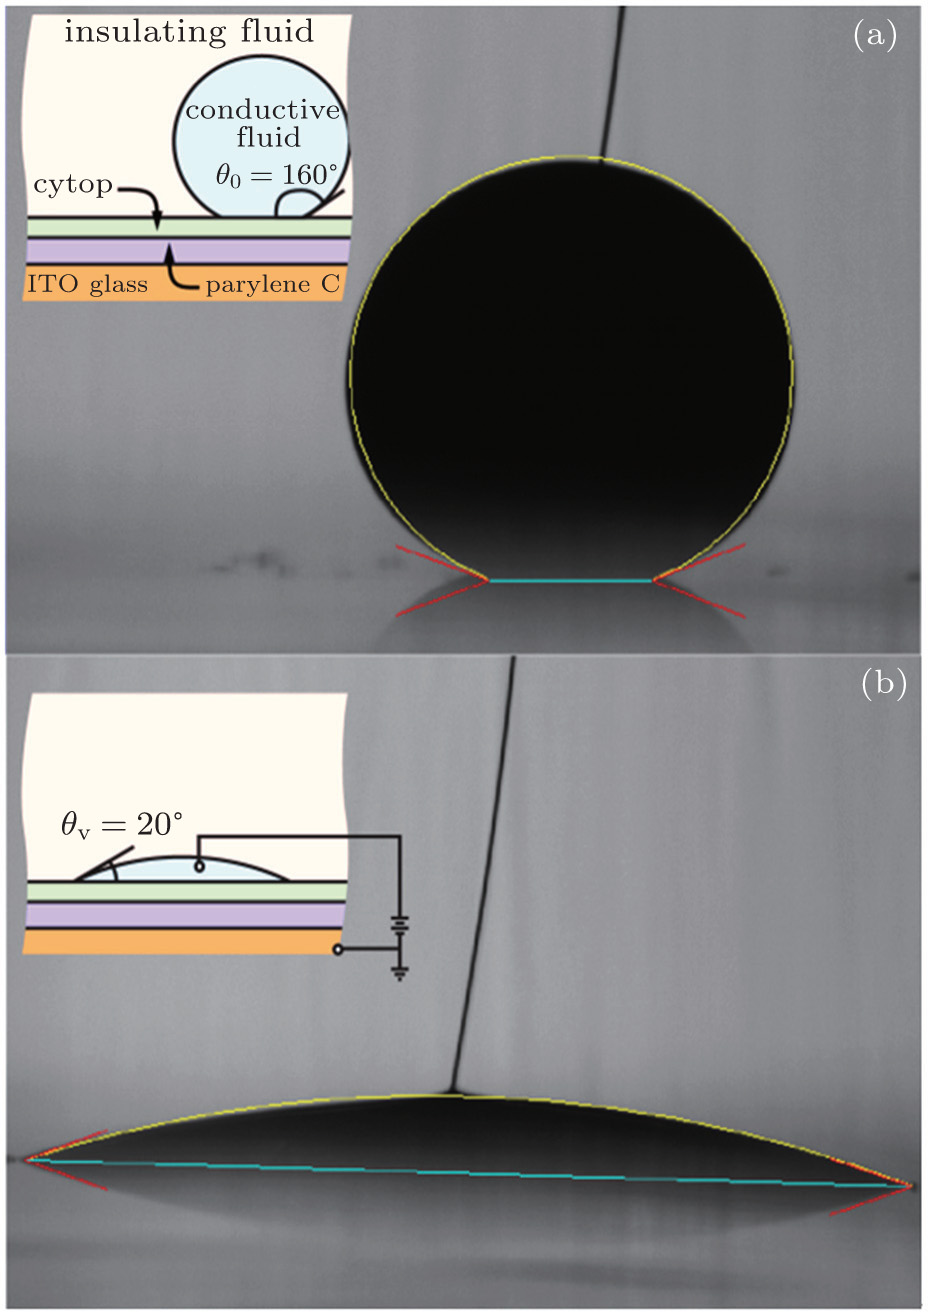 | Fig. 2. Diagrams and photos of electrowetting at (a) 0 V and (b) 180 V. |
The insulating fluid and the conductive fluid employed in Fig.
Figure
 | Fig. 3. Comparison of plot of contact angle versus applied voltage among experimental data (◼), results from Young–Lippmann equation (●), and theoretical data (▴). |
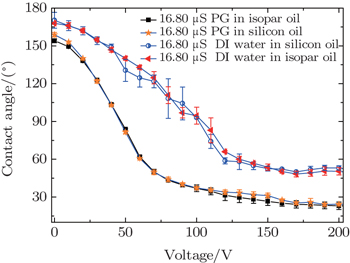
To elucidate the influences of interfacial and surface tension on electrowetting behavior more clearly, different combinations of conductive and insulating fluids with the same conductivity are employed for the test, and the results are shown in Fig.
 | Fig. 4. Plots of contact angle versus applied voltage for different combinations of conductive and insulating fluid. |
Figure
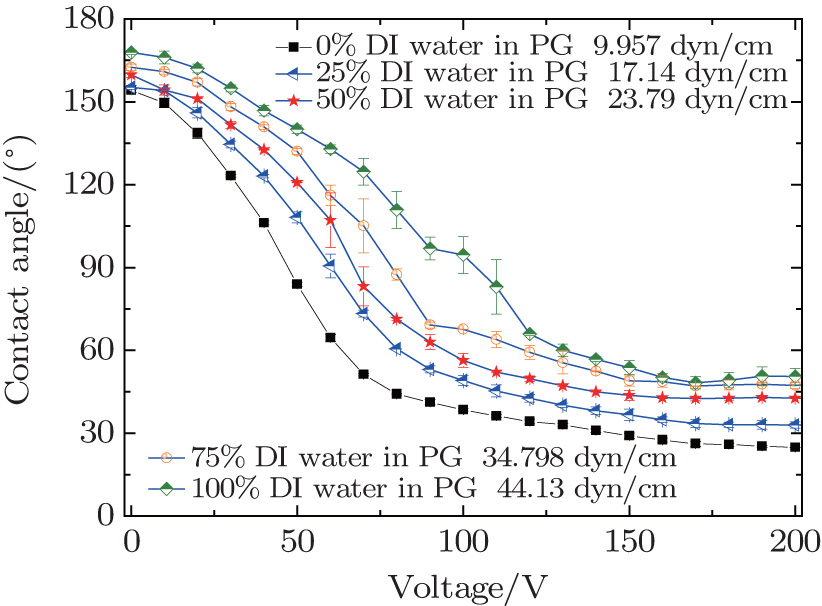 | Fig. 5. Plots of contact angle versus voltage for different volume percentages of DI water in PG, where DI water and PG have the same conductivity 16.8 μS. |
Figure
This work focuses on the exploration of the physical origin of electrowetting saturation, approaches to lowering the saturating contact angle, and the construction of a theoretical model for calculating the threshold potential and describing electrowetting behavior. Proper combination of the 3-phase system employed succeeds in dropping the saturating contact angle below 25° and achieving a good system stability performance. The theoretical model established to predict the transient contact angle change with higher potential shows good agreement with the relevant experiments. As for the electrowetting saturation, it is triggered once ions (or charges) escape through the interface of the droplet. A 3-phase system with higher interfacial tension and lower surface tension of conductive liquid facilitates to generate the lower contact angle and delay the formation of electrowetting saturation. The relevant results will enrich the research of electrowetting, promote the application in the area of micro-optics and opto-electronic information technology, and thus expand its application scope.
| 1 | |
| 2 | |
| 3 | |
| 4 | |
| 5 | |
| 6 | |
| 7 | |
| 8 | |
| 9 | |
| 10 | |
| 11 | |
| 12 | |
| 13 | |
| 14 | |
| 15 | |
| 16 | |
| 17 | |
| 18 | |
| 19 | |
| 20 | |
| 21 | |
| 22 | |
| 23 | |
| 24 | |
| 25 | |
| 26 |