Numerical modeling of condensate droplet on superhydrophobic nanoarrays using the lattice Boltzmann method
[Zhang Qing-Yu1, Sun Dong-Ke2, 3, Zhang You-Fa1, Zhu Ming-Fang1, †,  ]
]
]
 |


† Corresponding author. E-mail:
Project supported by the National Natural Science Foundation of China (Grant Nos. 51101035, 51371051, and 51306037).
In the present study, the process of droplet condensation on superhydrophobic nanoarrays is simulated using a multi-component multi-phase lattice Boltzmann model. The results indicate that three typical nucleation modes of condensate droplets are produced by changing the geometrical parameters of nanoarrays. Droplets nucleated at the top (top-nucleation mode), or in the upside interpillar space of nanoarrays (side-nucleation mode), generate the non-wetting Cassie state, whereas the ones nucleated at the bottom corners between the nanoarrays (bottom-nucleation mode) present the wetting Wenzel state. Time evolutions of droplet pressures at the upside and downside of the liquid phase are analyzed to understand the wetting behaviors of the droplets condensed from different nucleation modes. The phenomena of droplet condensation on nanoarrays patterned with different hydrophilic and hydrophobic regions are simulated, indicating that the nucleation mode of condensate droplets can also be manipulated by modifying the local intrinsic wettability of nanoarray surface. The simulation results are compared well with the experimental observations reported in the literature.
A droplet deposited at the top of superhydrophobic nanoarrays may present the non-wetting Cassie state with an apparent contact angle larger than 150°.[1] However, the wetting states of condensation-induced droplets can change when the superhydrophobic nanoarrays are exposed to humid air. This is because small condensation-induced droplets might nucleate and grow everywhere on the rough surface and hence degenerate the superhydrophobicity,[2,3] which influences the antifogging,[4] anti-icing,[5] and heat transfer efficiency[6] of the rough surfaces drastically. For investigating the evolution of the condensate droplets on superhydrophobic nanoarrays, researchers performed in-situ observations of the condensation process using environmental scanning electron microscopy (ESEM).[7,8] However, owing to heating effects of the electron beam and other unpredictable factors,[9,10] the resolution of ESEM is usually on a submicrometer scale, whereas the critical size of the condensation-induced droplet nucleus is on a nanoscale. As a result, people could only observe the final wetting states of the large droplets rather than the whole condensation process involving droplet nucleation.[11–13]
With the rapid development of computational technology, numerous numerical efforts have been made to study the wetting behavior of droplets on superhydrophobic surface.[14–17] In recent years, the lattice Boltzmann method (LBM) has rapidly developed into a powerful numerical approach and has been used in many fields.[18–26] The LBM has also attracted a lot of attention in the simulations of wettability of the nanoarray surface due to its simplicity and efficiency.[27–30] It is noted that most numerical activities using the lattice Boltzmann (LB) model have primarily been performed through placing a droplet on a micro- or nano-structured surface to investigate the wetting behavior, where the process of droplet nucleation was not involved. The numerical study of droplet nucleation using the LBM has so far remained scarce compared with the modeling of wetting behavior of artificially positioned droplets. As is well known, however, a better understanding of the nucleation process of condensate droplet is crucial to studying the final wetting state of droplets on superhydrophobic nanoarrays. Fu et al.[31] adopted a single-component multi-phase LB model to simulate droplet condensations on surfaces with different structures. It is found that the nucleation behavior depends on the spacing between and height of ridges on superhydrophobic surface. However, the structure with hydrophilic surface has little effect on the condensation. The present authors[32] employed a multi-component multi-phase pseudopotential LB model to simulate the droplet nucleation and growth on superhydrophobic nanoarrays. Three typical preferential nucleation modes of condensate droplets are observed through LB simulations with various geometrical parameters of nanoarrays, which are found to affect the wetting properties of nanostructured surfaces significantly. Since the nanostructures were regularly arranged, the droplet nucleation and growth took place uniformly on the nanoarray surfaces, producing the non-realistic droplet patterns, i.e., uniform liquid films, rather than individual liquid droplets.
In the present study, further simulations of the condensation process are carried out using the multi-component multi-phase pseudopotential LB model. The geometrical parameters and the local intrinsic wettabilities of nanoarrays are adjusted to be nonhomogeneous to investigate their influences on the preferential nucleation sites and the growth patterns of condensate droplets. The final wetting states of droplets simulated by the LB model are compared with the experimental observations reported in the literature.[33–36]
In the two-dimensional (2D) multi-component multi-phase pseudopotential LB model,[37] two sets of distribution functions are implemented for the two fluid components, namely, H2O and other non-H2O gases. The processes of particle propagation and collision are governed by the LB equations using the 2D nine-velocity (D2Q9) scheme as the following


The fluid–fluid cohesive force acting on the σ-th component is defined as


The fluid–solid adhesion force acting on the σ-th component is computed as


In the present work, periodic boundaries are employed on the left and right walls of the computation domain. A bounce-back rule is adopted on the fluid/solid boundaries. A constant density boundary condition, implemented by the non-equilibrium extrapolation approach,[38] is used on the top boundary as an air source. The densities of gaseous water and non-H2O gas components inside the domain are initialized to be 0.04 mu lu−2 and 0.96 mu lu−2 (mass unit per square lattice unit), while those on the top boundary are fixed to be 0.08 mu lu−2 and 0.92 mu lu−2, respectively. The humid air with higher gaseous water concentration on the top boundary enters into the computation domain and the gaseous water accumulates around the arranged solid nanoarrays due to the adhesive force. Droplet nucleation takes place around the nanoarrays once supersaturation has been achieved.
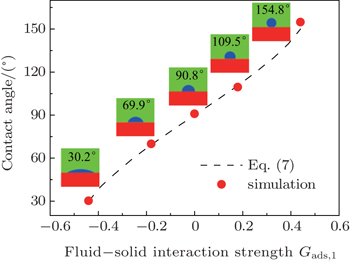
Different intrinsic contact angles of a droplet on smooth surfaces with different wettabilities are simulated. The simulation domain consists of 200 × 200 lattice units. A droplet with a radius of 26 lattice units is positioned on the flat surface. The relaxation time is set as τ = 1 for the two components. The fluid–fluid interaction strength is fixed as Gc = 2.1. The fluid–solid interaction strengths are specified as 
 | Fig. 1. Comparison between the LB simulations and the calculations from Eq. ( |
The phenomena of the nucleation and subsequent growth of condensate droplets are simulated using the LB model. To reasonably compare the LB simulations with the experimental observations, the relationship between the dimensionless LB lattice and the realistic length space is established through evaluating the critical nucleation diameters of condensate droplets. Under the experimental condition of 6 Torr (1 Torr = 1.33322 × 10² Pa) and 3 °C,[33–35] the critical nucleation diameter is 60 nm calculated by Kelvin’s equation.[40] In the LB model the critical nucleation diameter is measured to be 3 lattice units. Accordingly, it is obtained that 1 lattice unit in the LB model is equivalent to 20 nm in the real length space.[32] In addition, the fluid–solid interaction strengths are taken as 
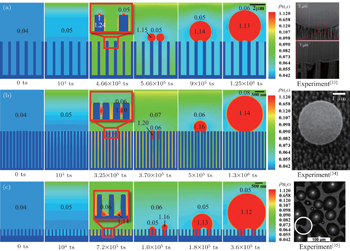
In our previous work,[32] three types of typical preferential nucleation positions, i.e., top-nucleation, side-nucleation, and bottom-nucleation modes were observed. The relationship between the geometrical parameters of nanoarrays and the preferential nucleation position was determined based on the exactly regular nanoarray arrangements. Considering that in experiments there must be some levels of nonhomogeneity in the geometrical size of the nanostructures in the present work, the patterns of the superhydrophobic nanoarrays are regulated to be nonuniform in the present work, i.e., they have slight differences in post width, post height, and inter-post spacing at some sites to test the influences of geometrical parameters on the preferential position of droplet nucleation.
Three types of droplet nucleations and the subsequent growths are presented in Fig.
Figure
Figure
It is noted that the simulation results presented in Fig.
 | Fig. 2. Simulated evolutions of droplet condensation shown in water (H2O) density field, for the cases: (a) top-nucleation mode, (b) side-nucleation mode, and (c) bottom-nucleation mode. Numbers in the figures indicate the local water (H2O) densities. |
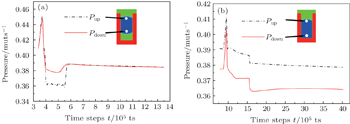
To illustrate the mechanism that drives the motion of the interpillar droplets growing from the side-nucleation mode, time evolutions of liquid pressures taken from the locations close to the upside and downside liquid/gas or liquid/solid interfaces of Figs.
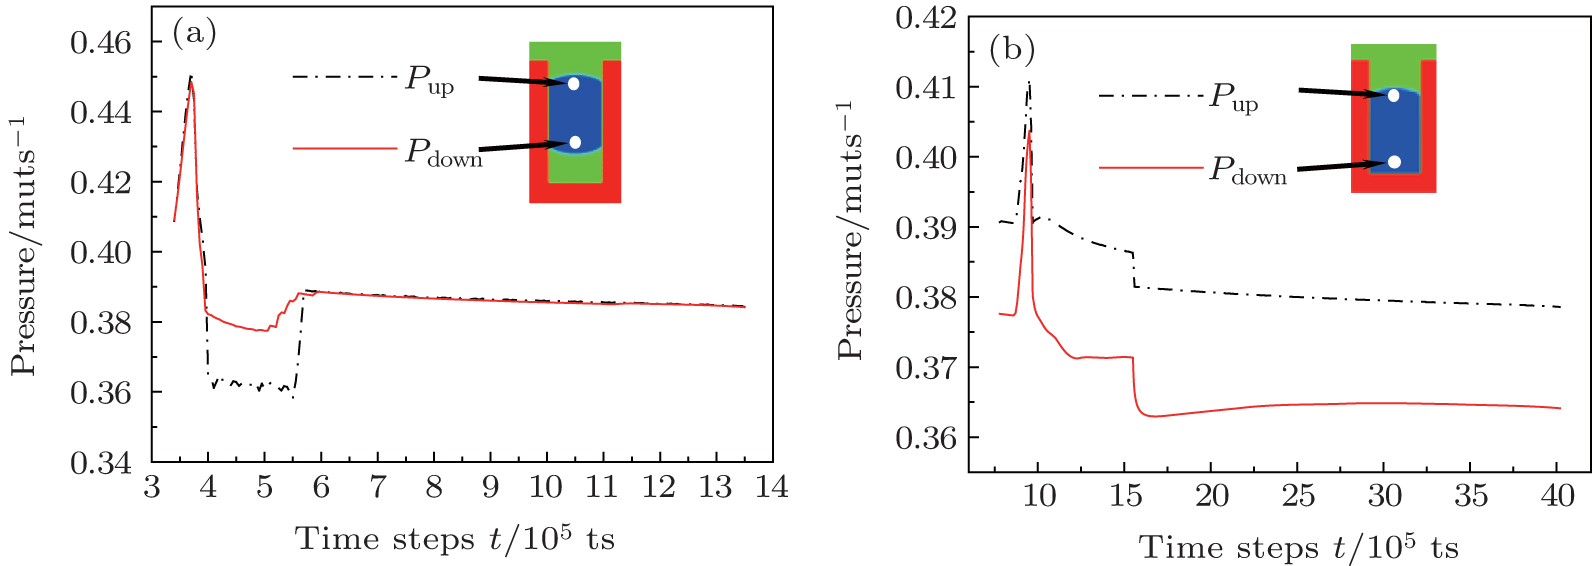 | Fig. 3. Evolutions of the upside and downside pressures of the liquid phase measured from (a) Fig. |
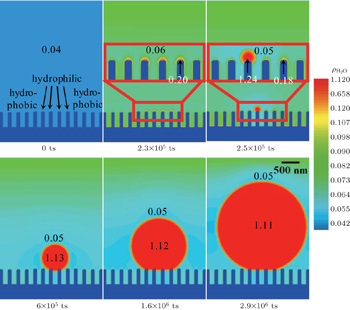
 | Fig. 4. Simulated evolution of droplet condensation on nanoarrays patterned with hydrophilic and hydrophobic surfaces, shown in water (H2O) density field. The geometrical parameters of the nanoarrays are identical to those of Fig. |
To investigate the influence of nonuniform local intrinsic wettability on the preferential nucleation mode of condensate droplets, the simulation is carried out using the nanostructures of Fig. 
Droplet nucleation and growth on nanoarrays are simulated using a 2D multi-component multi-phase LB model. Different intrinsic contact angles are simulated using various fluid–solid interaction strengths. By changing the geometrical parameters of the nanoarrays, three types of preferential droplet nucleation modes are observed. It is confirmed that the condensate droplets originating from the top-nucleation and side-nucleation modes display the non-wetting Cassie state, while the ones growing from the bottom-nucleation mode present the wetting Wenzel state. The slightly nonuniform geometrical configurations of nanoarrays can generate realistic individual condensate droplets. The simulation results compare reasonably well with the experimental observations reported in the literature.
The simulated time evolutions of droplet pressures show that the downside pressure of the droplet originating from side-nucleation mode is slightly higher than the upside pressure, which drives the droplets to move upwards until a non-wetting Cassie state is reached. However, the downside pressure of the droplet originating from bottom-nucleation mode is always lower than the upside pressure in the entire condensation process, which keeps the droplets in the wetting Wenzel state. The hydrophilic/hydrophobic modification of the local intrinsic wettability on the nanoarray surface can change the preferential droplet nucleation positions from the bottom-nucleation mode to the top-nucleation mode. It is demonstrated that the patterns of droplet condensation can be manipulated by controlling the geometrical parameters of nanoarrays, and the local intrinsic wettabilities on nanoarray surfaces.
| 1 | |
| 2 | |
| 3 | |
| 4 | |
| 5 | |
| 6 | |
| 7 | |
| 8 | |
| 9 | |
| 10 | |
| 11 | |
| 12 | |
| 13 | |
| 14 | |
| 15 | |
| 16 | |
| 17 | |
| 18 | |
| 19 | |
| 20 | |
| 21 | |
| 22 | |
| 23 | |
| 24 | |
| 25 | |
| 26 | |
| 27 | |
| 28 | |
| 29 | |
| 30 | |
| 31 | |
| 32 | |
| 33 | |
| 34 | |
| 35 | |
| 36 | |
| 37 | |
| 38 | |
| 39 | |
| 40 |