


Bismuth-content-dependent polarized Raman spectrum of InPBi alloy
[Wei Guan-Nan1, Tan Qing-Hai1, Dai Xing1, Feng Qi1, Luo Wen-Gang1, Sheng Yu1, Wang Kai2, Pan Wen-Wu2, Zhang Li-Yao2, Wang Shu-Min2, Wang Kai-You1, †,  ]
]
]
|
|


† Corresponding author. E-mail:
Project supported by the National Basic Research Program of China (Grant No. 2014CB643903) and the National Natural Science Foundation of China (Grant Nos. 61225021, 11474272, and 11174272).
We systematically investigate the optical properties of the InP1−xBix ternary alloys with 0 ≤ x ≤ 2.46%, by using high resolution polarized Raman scattering measurement. Both InP-like and InBi-like optical vibration modes (LO) are identified in all the samples, suggesting that most of the Bi-atoms are incorporated into the lattice sites to substitute P-atoms. And the intensity of the InBi-like Raman mode is positively proportional to the Bi-content. Linear red-shift of the InP-like longitudinal optical vibration mode is observed to be 1.1 cm−1/Bi%, while that of the InP-like optical vibration overtone (2LO) is nearly doubled. In addition, through comparing the Z(XX)Z̅ and Z(XY)Z̅ Raman spectra, longitudinal-optical-plasmon-coupled (LOPC) modes are identified in all the samples, and their intensities are found to be proportional to the electron concentrations.
The temperature-insensitive semiconductor laser is one of the future key devices in the field of optical communications.[1,2] Bismuth-diluted alloys are expected to have temperature-insensitive band gaps,[3,4] and therefore are the promising candidates for the application in the optoelectronic devices. Berding et al. theoretically predicted that InPBi is the best potential candidate for mid- and far-infrared (IR) optoelectronic applications in InSbBi, InAsBi, and InPBi.[5] Thus isoelectronic Bi-doped InP has become an important topic in the search for a new semiconducting material. However, the InPBi alloy is the most difficult to mix, and until recently, have the InP1−xBix materials been successfully grown by the gas source molecular beam epitaxy (GSMBE) technique.[2]
Raman scattering study is a very powerful technique to study the crystal quality and the associated vibration properties.[6] The vibration properties of the InPBi materials have been studied by using un-polarized Raman scattering measurement, where the InBi-like optical vibration modes were identified with Raman frequencies of 148 and 170 cm−1.[7,8] Yet in the previous work those Bi-induced modes were not subtracted from the background signals provided by the InP-like acoustical vibration modes. And the longitudinal-optical-plasmon-coupled (LOPC) modes have not been identified, nor have the shifts of the InP-like optical modes. Unlike the previous work, here we use polarized micro-Raman scattering system with much higher resolution to further investigate the Bi-content dependent vibration properties of the InP1−xBix alloys with 0 ≤ x ≤ 2.46%. To compare the Raman spectra under different polarized conditions, we are able to assign the InBi-like Raman features at about 148 cm−1 and 170 cm−1 to out-of-plane and in-plane vibration modes, respectively. Intensities of the InBi-like optical vibration modes are found to increase with increasing the Bi-content. Linear red-shift of the InP-like longitudinal optical vibration mode is observed to be 1.1 cm−1/Bi%, while that of InP-like optical vibration overtone (2LO) is nearly doubled. In addition, the occurrence of LOPC mode is verified by comparing two polarized Raman spectra, and the Bi-content dependent LOPC intensity and the free-electron concentration have the same variation trend.
The about 400-nm thick InP1−xBix films were grown on (100) semi-insulating InP substrates by V90 gas source molecular beam epitaxy (GSMBE) at a typical growth temperature of around 320 °C. Bi compositions of the samples were determined by employing high resolution x-ray diffraction (HRXRD) ω–2θ scans on two asymmetric (115) and two symmetric (004) planes and an InBi lattice constant of 6.52 Å. In the growth process, elemental In and Bi fluxes were controlled by adjusting the respective effusion cell temperature while P2 was cracked from PH3 at 1000 °C. The Bi content was just controlled by varying Bi cell temperature. The growth rate was 800 nm/h and the PH3 pressure was set to be 350 Torr (1 Torr = 1.33322 × 10² Pa) for the samples with Bi content < 2.2%. A larger PH3 pressure of 400 Torr was used for the sample with Bi content of 2.46%. The epilayers were cut into pieces each with a size of 1-cm square for Raman scattering measurements, with mirror-like surface.
Raman spectrum measurements were performed in a backscattering geometry using a Jobin-Yvon HR800 Raman system equipped with a liquid nitrogen cooled charge-coupled detector. The excitation wavelength was 632 nm from a diode-pumped solid-state laser. A power of 0.5 mW was used for excitation. The scattered light was analyzed by a triple monochromator (Dilor XY) equipped with aliquid-nitrogen-cooled CCD array. Using a high precision microscope, the laser spot size could be focused into a spot with around 1 μm in diameter, which enables us to investigate the spatial homogeneity of the sample. A 2400 g/mm diffraction grating (with ∼0.2 cm−1) was used. Correct instrument calibration was verified by checking the position of the Si band at ±520.7 cm−1. The widely used Porto notations Z(XX)Z̅ and Z(XY)Z̅ have been used for designating the crystal and polarization directions in this work.[9,10] The incident and scattered laser beams for both configurations are perpendicular to the sample surface. In the polarized Raman measurements, for Z(XX)Z̅ configuration, polarization direction of the scattered light was parallel to the polarization of incident laser beam. However, in Z(XY)Z̅ configuration, the polarization direction of the scattered light was perpendicular to that of the incident one. Because the thickness values of InPBi films were large compared with the optical absorption depth, the signal contribution from the substrate was negligible.
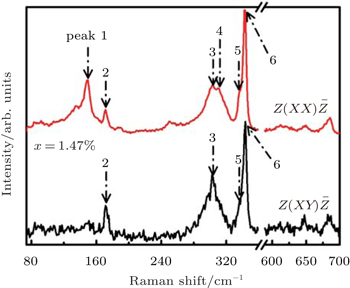
Polarized Raman scattering studies allow us to further confirm the symmetry of the main Raman feature. Taking the InP1−xBix alloys with x = 1.47% for example, figure
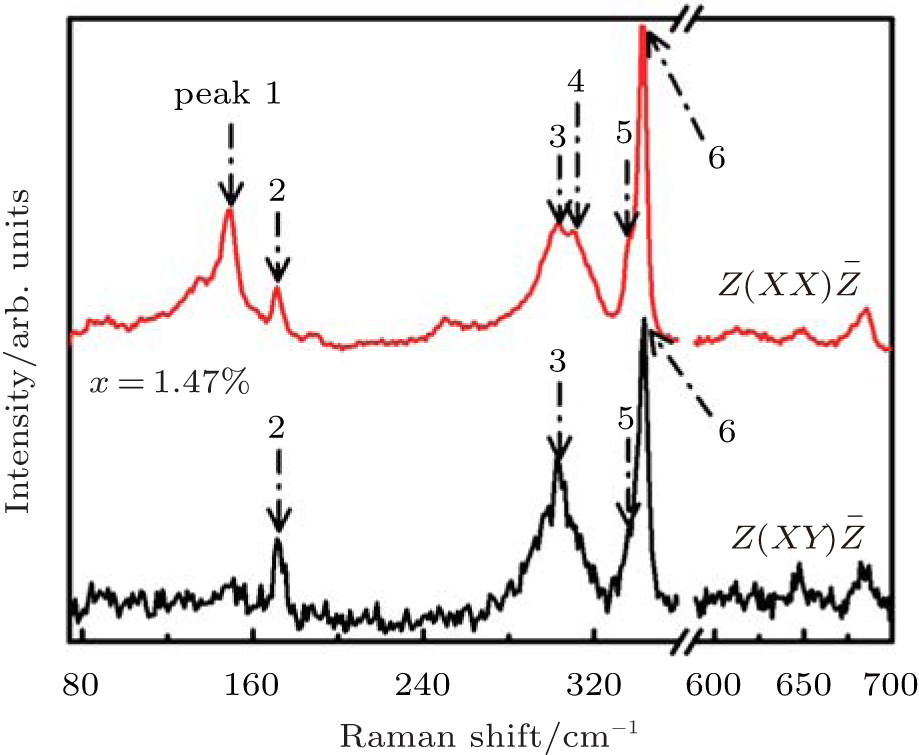 | Fig. 1. Raman spectra for InP1−xBix alloys with x = 1.47%, under Z(XX)Z̅ (red line (upper)) and Z(XY)Z̅ (black line (lower)) configurations. |
The Raman peaks 1 and 2 belonging to the InBi-like optical vibration modes[7] can be assigned to Raman optical modes TO and LO. The InBi mode in InP1−xBix should originate from the substitutional Bi atoms at the P site, resulting in the same Raman selection rules for both InBi and InP modes. Therefore, the Raman selection rules in the Z(XX)Z̅ and Z(XY)Z̅ scattering geometries for the InBi mode in InP1−xBix alloys.[13] The optical phonon frequency of InBi mode can be estimated from the equation: 
With many more Raman features appearing in Raman spectra for the Z(XX)Z̅ configuration, we present in Fig.
 | Fig. 2. Raman spectra under Z(XX)Z̅ configurations for InP1−xBix samples, with 0 ≤ x ≤ 2.46%, in the range from 75 cm−1 to 700 cm−1. InBi-like optical vibration modes are observed in the low-frequency region (marked I). InP-like optical vibration modes are observed in the medium frequency region (marked II), while InP-like optical vibration overtones are observed in the high frequency region (marked III). |
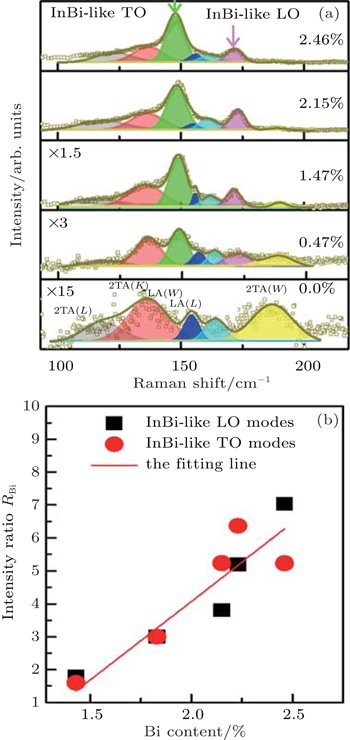
The low frequency region Raman spectra for the InP1−xBix alloys with are shown in Fig.
 | Fig. 3. (a) InBi-like vibration modes TO (represented by the red section) and LO (purple section), together with InP-like disorder-activated acoustical modes, which are used for the multi-peak fitting in the low frequency range from 93 cm−1 to 218 cm−1. The intensities of the Raman spectra are multiplied by 15, 3, and 1.5 for x = 0, 0.47%, and 1.47% samples, respectively. (b) The Bi content dependent TO (red solid) and LO (black square) intensity ratio RBi (RBi = [I(x) − I(0.47%)]/I(0.47%)) for the InP1−xBix sample, and the solid line is for the fitted results. |
Figure
 | Fig. 4. (a) Raman spectra between 280 cm−1 and 365 cm−1 with different Bi doping levels, where the dark yellow dots are the experimental data. InP-like TO(L) (green line), LOPC (red line), and TO(Γ) (purple line) modes are used to fit the spectra between 280 cm−1 and 325 cm−1, and LO(L) (blue line) and LO(Γ) (magneta line) modes are used to fit the spectra between 325 cm−1 and 365 cm−1. Navy lines are the fitted curves. (b) Comparison of the Raman spectra in the range from 270 cm−1 to 330 cm−1 between the Z(XX)Z̅ and Z(XY)Z̅ polarized configurations, for samples with x = 0.47% and 1.47%. (c) Bi content-dependent intensities of the LOPC and the corresponding electron concentrations for samples with Bi composition x ≤ 2.23%. (d) The Bi doping content-dependent shifts of the Raman frequencies of LO(L) and LO(Γ) modes. (e) The Bi composition-dependent full width at half maximum (FWHM) of LO(Γ). The black dots represent the experimental data, while the red line guides the eye. |
Red shifts for both of the LO(Γ) and LO(L) modes linearly increase with increasing the Bi doping level, which is shown in Fig.
Finally, in the high frequency region (region III), strong second order spectrum between 600 cm−1 and 700 cm−1 is observed. As have been confirmed by other researchers, Raman structures at 615, 649, and 683 cm−1 are attributed to a combined creation of LO and TO phonons at various critical points,[21] which are the 2TO, TO + LO, and 2LO phonons at Γ point, L point or X point. Raman frequencies of both the 2LO and TO + LO decrease with Bi-content increasing, while that of 2TO is insensitive to the Bi composition as shown in Fig.
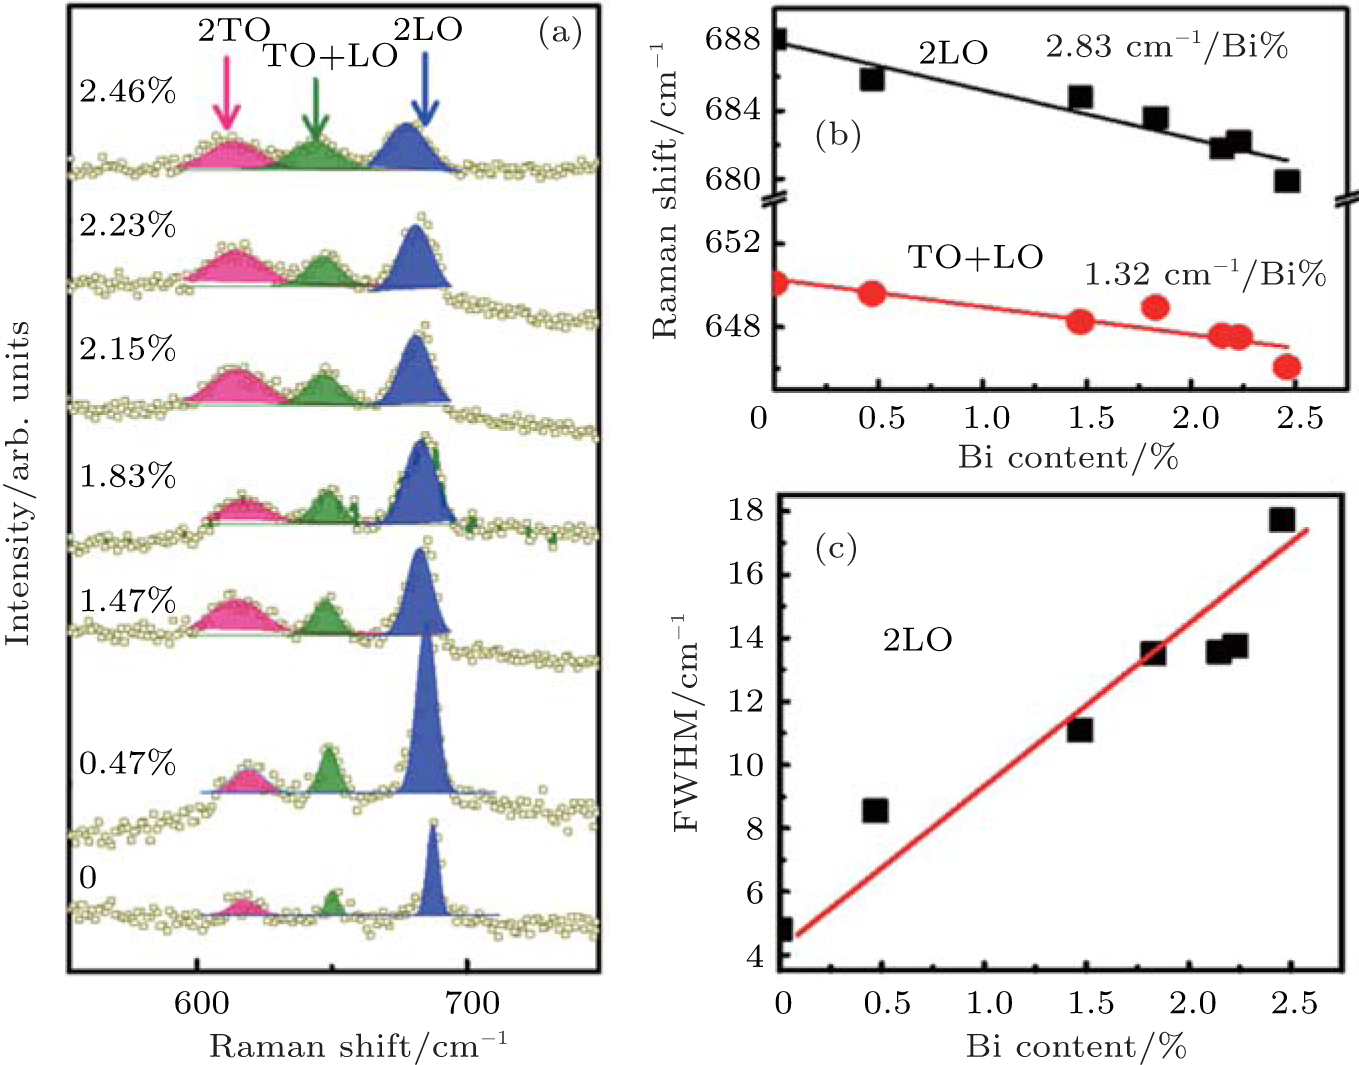 | Fig. 5. (a) Infrared Raman spectra for a series of InPBi samples. The pink sections (2TO), the olive sections (TO + LO) and blue ones (2LO) represent the overtones of TO and LO. (b) The Bi doping level dependent Raman shifts of the 2LO and TO + LO. The dots represent the experimental data, while the straight lines represent the linear fitting progress. (c) The Bi doping level dependent FWHM of 2LO, where the dots represent the experimental data, and the line guides the eye. |
In this work, we systematically investigate the vibration properties of the constituent alloys InP1−xBix with 0 ≤ x ≤ 2.46% by using the polarized high resolution micro-Raman. Both InP-like and InBi-like optical vibration modes (LO) are identified in all the samples, suggesting that most of the substitutional Bi-atoms are incorporated into the lattice sites to replace the P-atoms. The intensities of the InBi-like Raman modes increase linearly as Bi-content increasing. The red-shift of the Raman frequency of the InP-like longitudinal optical vibration mode is observed to be 1.1 cm−1/Bi%, while that of InP-like optical vibration overtone (2LO) is more than doubled. The crystal distortion of the InP-host material is found to increase with increasing the Bi doping concentration. In addition, LOPC modes are identified by comparing the Raman spectra under Z(XX)Z̅ and Z(XY)Z̅ configurations. The Bi content-dependent intensity ratio between the LOPC and InP-like LO(Γ) mode has the same trend as the electron concentration, which can be used as a rapid and sensitive method to determine the relative doping level in n-type InPBi semiconductors.
| 1 | |
| 2 | |
| 3 | |
| 4 | |
| 5 | |
| 6 | |
| 7 | |
| 8 | |
| 9 | |
| 10 | |
| 11 | |
| 12 | |
| 13 | |
| 14 | |
| 15 | |
| 16 | |
| 17 | |
| 18 | |
| 19 | |
| 20 | |
| 21 | |
| 22 | |
| 23 |