Analysis of algebraic reconstruction technique for accurate imaging of gas temperature and concentration based on tunable diode laser absorption spectroscopy
Xia Hui-Hui1, 2, Kan Rui-Feng1, Liu Jian-Guo1, †, , Xu Zhen-Yu1, He Ya-Bai1
Key Laboratory of Environmental Optics and Technology, Anhui Institute of Optics and Fine Mechanics, Chinese Academy of Sciences, Hefei 230031, China
University of Science and Technology of China, Hefei 230022, China


† Corresponding author. E-mail: jgliu@aiofm.ac.cn

Project supported by the Young Scientists Fund of the National Natural Science Foundation of China (Grant No. 61205151), the National Key Scientific Instrument and Equipment Development Project of China (Grant No. 2014YQ060537), and the National Basic Research Program, China (Grant No. 2013CB632803).

Abstract
Abstract

An improved algebraic reconstruction technique (ART) combined with tunable diode laser absorption spectroscopy(TDLAS) is presented in this paper for determining two-dimensional (2D) distribution of H2O concentration and temperature in a simulated combustion flame. This work aims to simulate the reconstruction of spectroscopic measurements by a multi-view parallel-beam scanning geometry and analyze the effects of projection rays on reconstruction accuracy. It finally proves that reconstruction quality dramatically increases with the number of projection rays increasing until more than 180 for 20 × 20 grid, and after that point, the number of projection rays has little influence on reconstruction accuracy. It is clear that the temperature reconstruction results are more accurate than the water vapor concentration obtained by the traditional concentration calculation method. In the present study an innovative way to reduce the error of concentration reconstruction and improve the reconstruction quality greatly is also proposed, and the capability of this new method is evaluated by using appropriate assessment parameters. By using this new approach, not only the concentration reconstruction accuracy is greatly improved, but also a suitable parallel-beam arrangement is put forward for high reconstruction accuracy and simplicity of experimental validation. Finally, a bimodal structure of the combustion region is assumed to demonstrate the robustness and universality of the proposed method. Numerical investigation indicates that the proposed TDLAS tomographic algorithm is capable of detecting accurate temperature and concentration profiles. This feasible formula for reconstruction research is expected to resolve several key issues in practical combustion devices.

1. Introduction

Over the past decades, tunable diode laser absorption spectroscopy (TDLAS) has become an indispensable method of making sensitive and fast in-situ measurements in gaseous detection, such as species concentration, pressure, temperature, and velocity.[13] Traditional absorption spectroscopy is a line-of-sight (LOS) technique, which can only reflect the averaged value along the light path without providing any spatially resolved information,[46] while the temperature and concentration among the combustion area are usually non-uniform, thus, it is necessary to accurately obtain the spatial distributions of fluid field parameters. Recently, TDLAS data have been combined with computer tomography (CT), herein referred to as tunable diode laser absorption tomography (TDLAT), to image two-dimensional (2D) distribution of combustion properties of a scramjet wind tunnel. TDLAT can be roughly divided into two categories in terms of reconstruction algorithm: one is the transformation method, in which the representative algorithm is the filtered back projection (FBP) algorithm,[7,8] which needs complete projection data to realize physical reconstruction, and the other is the iterative method, in which the main example is algebraic reconstruction technique (ART) algorithm.[912] Bryner and Sharma employed the filtered back projection algorithm to reconstruct the peak of the water vapor absorption transition centered at approximately 7164.9 cm−1 of a flat burner and indoor environment based on experimental measurements.[13] Li et al. designed a set of TDLAT systems with six parallel rays which were arranged at different positions, they reconstructed the temperature and concentration distribution of a scramjet combustor exit using ART.[14] Ma et al. used a tunable laser called “fiber Fabry–Perot tunable filter laser (FFP-TFL)” to scan over the 1333 nm–1377 nm range at ∼ 200 Hz in the 2D reconstruction of temperature and H2O concentration distributions over a Hencken burner flame.[15] Although the FBP algorithm can obtain highly accurate reconstructions of the objective area, especially in medical imaging, a large number of closely sampled angular views and projection rays may increase the difficulty of experimental design, therefore, FBP reconstruction study based on laboratory verification is rarely reported in the literature. Unlike FBP, ART tomography algorithm has been successfully used for combustion diagnosis because of its strong resistance to noise and availability with only limited projection data.[12,16] Recently, a new method called multispectral absorption tomography (MAT), which greatly facilitates the practical implementation and application of the tomography technique, has been proposed to obtain simultaneous tomographic images of temperature and species concentration. Even though many researchers have done relevant work for imaging, it is hard to evaluate the accuracies of reconstruction results, especially the concentration distribution result, it is usually not so satisfactory when compared with temperature reconstruction by using a traditional method.[17]

In this paper, we divide the combustion area into 20 × 20 grids, and theoretically discuss the reconstructions of temperature and concentration with different projection rays based on a modified adaptive algebraic reconstruction technique (MAART).[18] More importantly, we propose a novel way to eliminate the concentration reconstruction error, which greatly improves the accuracies of the results when compared with the traditional method, furthermore, an optimal spatial structure of the test system including parallel-beam projection rays and grid partition principle is also suggested in this paper later. At the same time, asymmetric temperature and concentration distribution models are created to analyze the robustness and universality of the proposed algorithm. By means of this paper, the temperature and concentration can be simultaneously and accurately reconstructed whatever the combustion flow field is like in the future.

2. Theoretical foundation

Generally the TDLAT can be divided into two parts: absorption spectrum theory and tomographic reconstruction algorithm.

2.1. Absorption spectrum principle

According to the Beer–Lambert law, when collimated light at a certain frequency penetrates a gas medium of path length, L, the relationship between the transmitted and incident intensity of radiation is expressed as

where It and I0 are the transmitted and incident laser intensity respectively, p is the total static pressure[atm], Xabs is the mole fraction of the absorbing species, Si(T) is the transition line strength [cm−2·atm−1] (1 atm = 1.01325×10⁵ Pa) for a single transition i, and ϕv is the normalization line-shape function[cm], namely, ∫ ϕvdν = 1, usually ϕv is approximated by the convolution of two dominant broadening mechanisms, i.e., Doppler and collisional broadening, representative of a typical combustion environment.

The integrated absorbance of the transition i can be inferred from the above as

The absorption coefficient can be defined from Eq. (2) for a uniform flow field whose concentration and temperature are constant as follows:

The line strength S of a single transition i, which is temperature-dependent, can be described in terms of the following formula at a reference temperature T0:

where h [J·s] is Planck’s constant, c [cm·s−1] the speed of light, k [J·K−1] the Boltzmann’s constant, Q(T) the partition function of the absorbing species,[19] v0 [cm−1] the line-center frequency, and E′ [cm−1] the lower state energy of the transition.

2.2. Tomography algorithm

Prior to the study of the tomography algorithm, we divide the region of interest (ROI) into N (N equals n × n) grids, and the flame parameters such as pressure, temperature and gas concentration are assumed to be constant in each grid, then the integrated absorbance A of transition i in Eq. (2) for each laser beam is calculated by the following discrete form:

where I and J are respectively the total beam and grid number, Li j is the path length of the i-th laser beam passing through the grid j, which can be automatically calculated from a fast algebraic reconstruction algorithm based on improved projection coefficient computation,[20] αv,j the absorption coefficient of the i-th laser beam within the j-th grid. In general, Eq. (5) can be rewritten in the form of matrix as follows:

where L is the I × J matrix of weights Li j, the column vector α = {αv,1, αv,2,…,αv,J}T and A = {Av,1, Av,2,…,Av,I}T.

Here we use a modified adaptive algebraic reconstruction technique (MAART),[18] instead of the matrix theory, to compute α, and use this ART method to solve linear equation (6) in iterative equation as follows:

where k represents the iteration time in the ART procedure, λk is the relaxation parameter, and β generally is a constant (β < 0.5)[18] during the calculation, here we let it be 0.25. The iterative process is terminated when the change of the absorption coefficient in Eq. (3) becomes less than 1 × 10⁻⁹ between two consecutive iterations. Considering the non-negativity of concentration and temperature value, restrictions are imposed in the iterative process:

In order to reduce the mutation of reconstruction results, the reconstructed value is to be restricted within a reasonable range for specific application in practice. Here a kind of smoothness regularization is employed,[21,22] and for grid (i, j), the absorption coefficient α is

Here, the after k-th iteration is not only relative to (k − 1)-th grid information, but also dependent on its nearest eight neighbors, and we keep the constant δ = 0.001.[18]

By using Eqs. (7)–(9), the tomographic reconstruction result of α can be obtained, subsequently the temperature of grid j would be approximately determined by the following formula:[23]

if we select a pair of appropriate transitions (v1 and v2) with different temperature dependences. The traditional way to infer concentration is that Xj can be simultaneously obtained from Eq. (3) at the atmospheric pressure with Tj in hand, but this algorithm may generate great reconstruction error, we propose a novel method instead of this way to solve the problem. More details will be given in the following text.

3. Methods
3.1. Absorption line selection

H2O is an attractive target species for combustion diagnosis due to the relative abundance of water vapor as a combustion product and a strong near-infrared absorption spectrum. In this work, two transitions 7153.722 cm−1 & 7153.748 cm−1 and 7154.354 cm−1, have been selected to infer temperature by the two-line scheme because of their suitable line-strength and freedom of significant interference from nearby transitions,[9,17] these two overlapped transitions 7153.722 cm−1 and 7153.748 cm−1 can be treated as one transition when we deal with their line strengths, integrated absorbances, and center frequencies. The dependences of the two line strengths on temperature can be obtained from HITRAN 2008 or be calculated by Eq. (4) as shown in Fig. 1(a), then the line strength ratio between the two absorption transitions and the relative sensitivity to temperature are derived as shown in Fig. 1(b).

Fig. 1. (a) Line strengths for selected transitions, and (b) ratio and sensitivity.
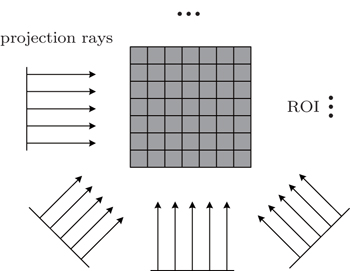
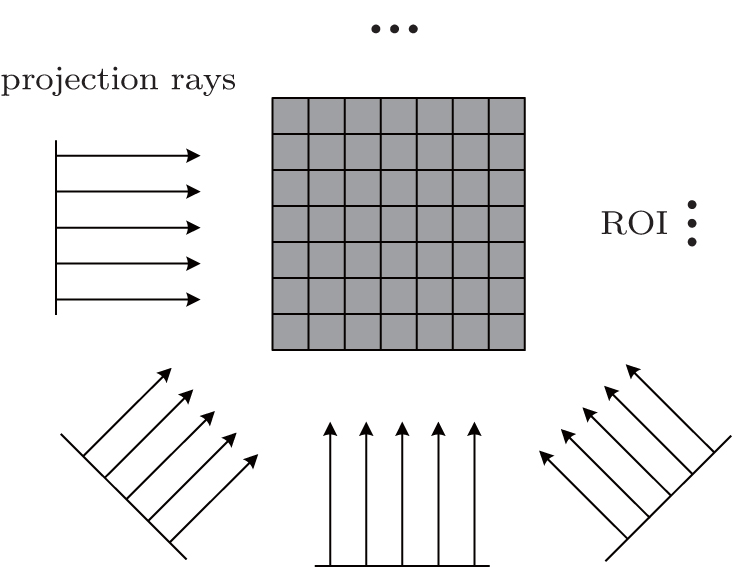
3.2. Numerical investigation for temperature reconstruction

In the simulation, we assume that the ROI is 20 cm×20 cm, then the ROI is divided into 20 × 20 grids, namely, the lengths for both X and Y axis directions of each grid are 1 cm, which is a relatively high spatial resolution to understand the information about combustion flow field. Parallel-beam possesses 20 light rays at each projection angle, and these rays rotate around the ROI for generating projection data in different views. This parallel laser-detector scanning geometry is shown in Fig. 2.

Fig. 2. Parallel beam collection geometry for multi-view with a fixed location.

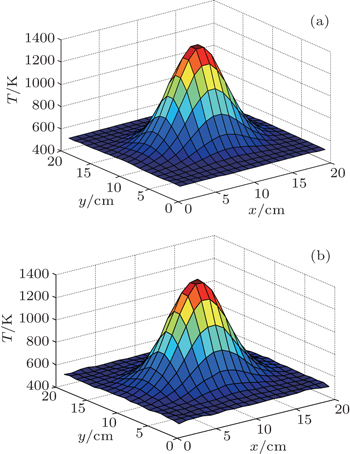
A Gaussian model is designed for simulating the temperature and concentration distributions of the combustor exit of a flat flame furnace, and we can arbitrarily specify a possible distribution using this Gaussian function. In this paper a temperature range (500 K–1400 K) of interest is taken for example, similarly, water vapor concentration, i.e., volume fraction varies from 0.15 to 0.25 for testing, and the total static pressure is always 1 atm, which is the case for many practical applications. First of all, projection data of the numerical phantom, which is exactly equivalent to the integrated absorbance A,[24] can be obtained directly from Eq. (5). Secondly, we change the magnitude of projection angle which is scattered between 0° and 180° to bring about the effect of projection rays on the overall reconstruction quality by the algorithm mentioned in this article. In the end, we specifically set up the projection rays to vary from 120 to 360 with 60 increments and keep 20 parallel rays invariably at each projection angle. Take one of the beam arrangements for example, the reconstructed profile is shown in Fig. 3. Here we just display the temperature result regardless of concentration, which would be studied later. In order to analyze the influence of projection rays on reconstruction accuracy clearly, rather than other influencing factors, we do not add measurement noise to the projection data.

Fig. 3. Temperature image reconstruction for Gaussian model by ART with a total of 300 projection rays scattered between 0° and 180°. Panel (a) shows the original temperature distribution, and panel (b) displays the reconstructed temperature distribution.

As can be seen from Fig. 3, very good agreement is achieved between the reconstruction image and the original image. The maximum relative error between the tomographic images and the phantoms is utilized to quantitatively evaluate the accuracy of the reconstructions, and this criterion is mathematically expressed as[25]

where oj and rj represent the true temperature value and reconstructed one for grid j respectively, N represents the total grid number in reconstruction area, and omax represents maximum value of original pixel, similarly, omin is the minimum, e reflects the maximum reconstruction difference among all pixels compared with original image. Another criterion for evaluating reconstruction quality is the average error, that is shown in Eq. (13),[25] which inflects average difference of each pixel between reconstructed image and original one.

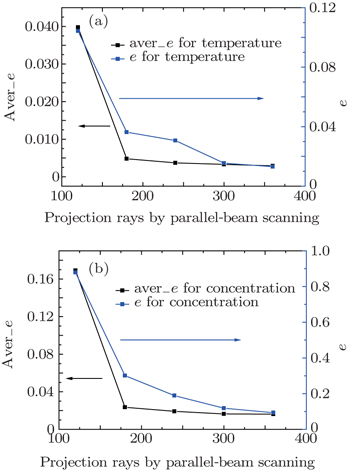
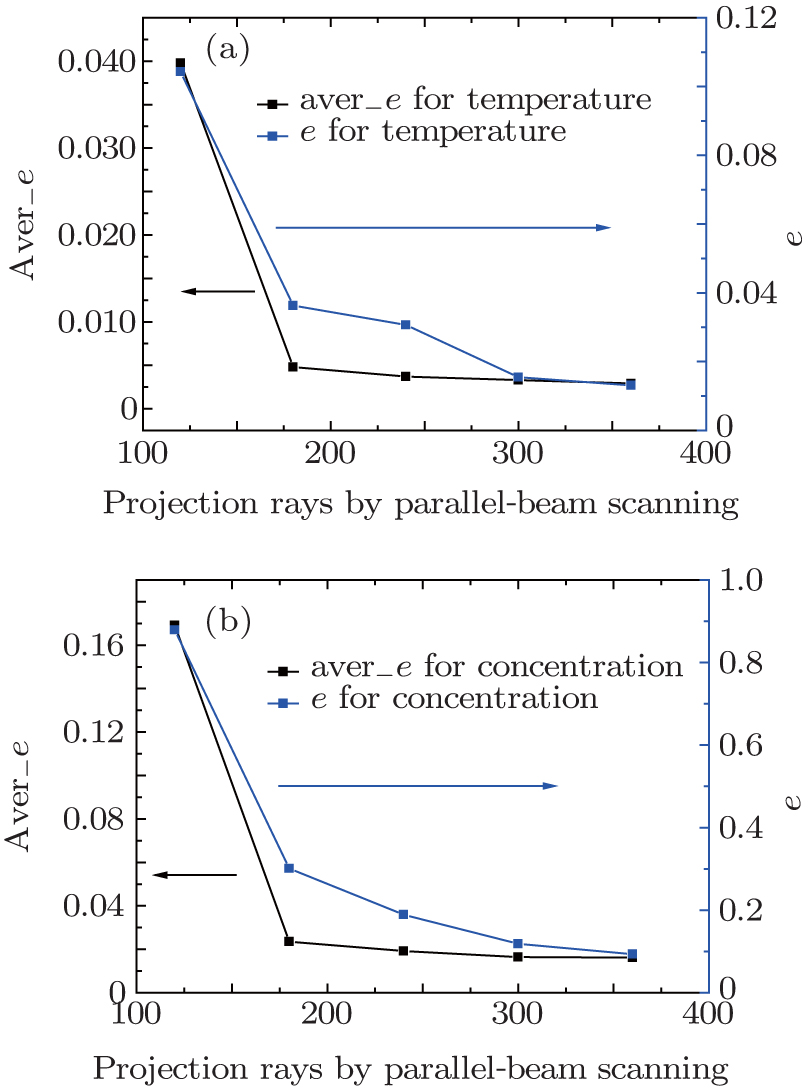
After scanning by the different parallel-beam projection rays, the temperature reconstruction error is plotted in Fig. 4(a) by calculating Eqs. (12) and (13).

Fig. 4. (a) Temperature and (b) concentration reconstruction errors versus projection ray number.

From the figure above we can obviously see some typical trend: the error decreases with the number of the projection data increasing, and the reconstruction accuracy is significantly dependent on the number of projection rays when it is less than 180, and after this point, it has little influence on e and avere, which indicates that there is no need to increase as many projection rays as possible in the TDLAT experiment. For 20 × 20 grid partition, in consideration of laboratory verification and experimental condition, the arrangement of about 180 projection rays is accurate enough to reconstruct the temperature distribution.

3.3. Modified algorithm for concentration reconstruction

Just as described in most of the research, once the temperature of each grid is known, the line-strength S can be calculated, and then the local concentration is obtained from Eq. (3) as

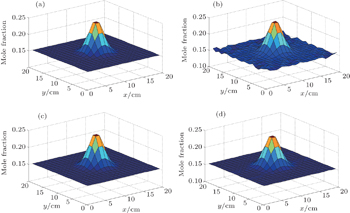
In terms of the water vapor concentration reconstruction involved in this paper, we analyze the results just like temperature mentioned in the above. The original and reconstructed concentration images are plotted respectively in Figs. 5(a) and 5(b) under the same conditions as those of temperature case.

Fig. 5. Concentration image reconstruction for Gaussian model by traditional and modified ART with a total of 300 projection rays scattered between 0° and 180°. Panels (a) and (b) show original and reconstructed concentration distribution by TM, and panels (c) and (d) display original and reconstructed concentration distribution by MM, respectively.

Figures 5(a) and 5(b) show the water vapor concentration reconstruction results under a specific parallel-beam layout. We can also plot the trend curve of the maximum relative error e and the average error aver_e versus different projection rays by Eqs. (12) and (13) as displayed in Fig. 4(b).

It turns out that the concentration can be easily reconstructed as long as the temperature has been imaged correctly. However, it is evident that the concentration reconstruction results are usually worse than the temperature reconstruction from either Fig. 4 or Fig. 5. The error of the reconstructed value of concentration is larger at the edge of ROI than in the center region, which is explained in Ref. [17]. Many researchers have focused on temperature measurement for a long time, but they pay little attention to the accuracy of concentration reconstruction.

Currently, a unique and standard way of solving the concentration distribution is through directly iterative calculation instead of indirect derivation by temperature reconstruction results. In practical measurements, with T in hand, the line strength S(T) for each grid can be figured out easily, then we define another projection weight L′, called normalized L, which is described by the multiplication of original weight L at each grid and the corresponding line-strength, and shown as follows:

Since the pressure of the combustion region remains 1 atm in our study, integrated absorbance A for every transition of a certain laser beam will be converted into Eq. (16), which would be called absorption formula for transition i:

According to the previous text, there are 2I absorption formulas because the total number of projection laser beams is I, now we combine all these 2I equations together as follows:

where Xj represents the concentration of grid j, , and are the normalized path lengths of the i-th laser beam within the j-th grid with regard to the absorption transition v1 and v2, respectively, Av1,i and Av2,i represent integrated absorbances of absorption v1 and v2, respectively for i-th laser beam. Equation (17) is a linear equation array with J unknown variables and 2I equations, and the solution of the equations is greatly restricted because of the increased I equations when compared with Eq. (5), which can help us to obtain a more accurate solution than before. As is well known, from the matrix theory there must be at least x equations to solve x variables if we want to obtain the unique and accurate solution, therefore, it provides a reference guideline for us to select the appropriate laser projection beam arrangement in TDLAT, in other words, the number of projection rays should approximate to half of the grids if we want to obtain accurate results, with the number of beam scannings being as small as possible.

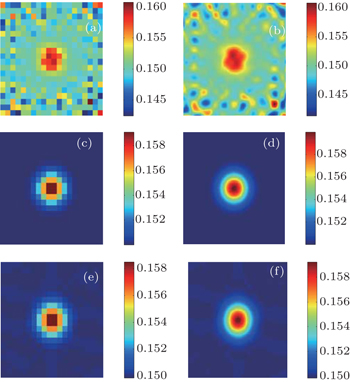
In order to reconstruct the concentration distribution by ART from Eq. (17), we treat Xj as iteration variable and the final convergence value is exactly concentration value. In combustion diagnosis, there could be a wide variety of flow field models. A relatively large range (0.15 to 0.25) of water vapor concentration has been tested above, and now another concentration layout varying from 0.15 to 0.1591, which is an almost uniform distribution, is supposed by changing the parameters of Gaussian function to assess the capability and accuracy of the proposed method, for simplicity, temperature value is still the reconstructed result listed previously. Figure 6 shows the reconstructions for 20 × 20 grids by traditional method (TM) and the modified method (MM) on the condition that the combustion zone is scanned by 300 projection rays.

Fig. 6. Reconstruction image of assumed concentration distribution: (a) H2O concentration of reconstruction by TM, (b) interpolation operation result, (c) original concentration distribution, (d) interpolation operation result, (e) H2O concentration of reconstruction by MM, and (f) interpolation operation result.

In order to obtain a high spatial resolution image, cubic spline interpolation algorithm is used to realize a 200 × 200 grid distribution, which is displayed in Figs. 6(b), 6(d), and 6(f). It is evident from Fig.6 that the TM generates a much larger mistake than the MM, especially at the edges, where obvious fluctuation exists whether the original reconstruction or the interpolated image shown in Fig. 6(a) and Fig. 6(b). While the proposed calculation scheme is implemented extremely well, the reconstructed results are almost the same as original images shown in Figs. 6(e) and 6(f). To quantitatively compare the reconstruction accuracy between TM and MM, we calculate the maximum relative error e and the average error aver_e respectively by using Eqs. (12) and (13) again, the calculation results are shown in Table 1 for comparison.

Table 1.

Error analyses for 300 parallel-beam scannings.

.

It can be seen that the tomographic accuracy of concentration reconstruction can be greatly improved by the proposed method. To further validate the modified concentration calculation algorithm, we employ this modified way to conduct the reconstruction whose ROI is the same as the distribution depicted in Fig. 5(a) again. Figure 5(d) shows the concentration reconstruction result.

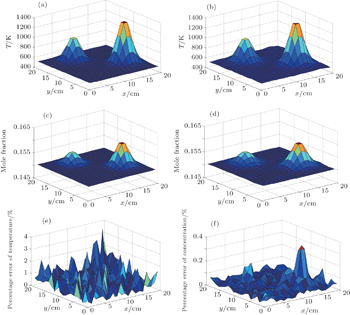
In some complicated combustion environments, the very specific case of the centrosymmetrical Gaussian distributions of temperature and mole fraction discussed above should be expanded to include a range of possible cases. Here we consider a bimodal structure to validate the universality and robustness of the proposed method, and the reconstruction results are displayed in Fig. 7.

Fig. 7. Reconstructions of asymmetry structure for a bimodal distribution: (a). original temperature distribution, (b) reconstructed temperature distribution, (c) original concentration distribution, (d) reconstructed concentration distribution by MM, (e) temperature reconstruction error, and (f) concentration reconstruction error.

It is obvious from Figs. 5 and 7 that the modified concentration calculation algorithm can not only reconstruct different kinds of concentration distributions easily but also provide a more accurate reconstruction image than the traditional method, especially at the edge of ROI, and the irregular fluctuation of reconstructed phantom is greatly eliminated. In general, the modified method of reconstructing concentration distribution is basically a universal approach in practical combustion diagnosis.

4. Conclusions

The high-quality and simultaneous tomographic images of temperature and gas concentration are comprehensively analyzed in this paper. We numerically demonstrate a spatial resolution with 20 × 20 grids by an improved ART algorithm. Quantitatively calculating the reconstruction errors of different parallel-beam scanning arrangements proves that reconstruction accuracy is greatly dependent on projection rays only when they are less than a certain value. Additionally, the concentration reconstruction results are always worse than the temperature reconstruction by traditional algorithm. Therefore, a modified concentration calculation method is introduced in order to directly reconstruct concentration instead of being derived from temperature. This proposed method facilitates the high-quality concentration reconstruction without adding extra projection rays. The conclusions presented in the above indicate that the projection rays should be approximately equal to half the grid number or nearly this magnitude if we simultaneously consider the reconstruction accuracy and simplicity in engineering application. At the end of this article, we apply this proposed method to a more complicated flow field model for demonstrating the robustness and universality of the method. The present study validates an available and feasible approach to precisely reconstructing temperature and concentration distribution, and we believe that it certainly can offer a good theoretical foundation for experimental verification in the future.

Reference
1Arroyo M PHanson R K 1993 Appl. Opt. 32 6104
2Tang Y YLiu W QKan R FLiu J GHe Y BZhang Y JXu Z YRuan JGeng H 2011 Opt. Express 19 20224
3Owen KyleFarooq Aamir2014Appl. Phys. B116371
4Zhou XLiu XJeffries J BHanson R K 2003 Meas. Sci. Technol. 14 1459
5Sanders Scott T.Wang JJeffries J BHanson R. K 2001 Appl. Opt. 40 4404
6Zhang G LLiu J GKan R FXu Z Y 2014 Chin. Phys. 23 124207
7Martin Elizabeth FGoyne Christopher PDiskin Glenn S 2010 International Journal of Hypersonics 1 173
8Song J LHong Y JWang G Y 2012 High Power Laser and Particle Beams 24 2073 (in Chinese)
9Wang FWu QHuang Q XZhang H DYan J HCen K F 2015 Opt. Commun. 346 53
10Kasyutich V LMartin P A 2011 Appl. Phys. 102 149
11Song J LHong Y JWang G Y 2012 Acta Phys. Sin. 61 240702 (in Chinese)
12Liu CXu L JCao ZYang Y H2012Imaging Systems and Techniques (IST), IEEE International Conference117
13Bryner ESharma M GGoyne C PMcDaniel J CSnyder MKrauss R HMartin E F201048th AIAA Aerospace Sciences Meeting Including the New Horizons Forum and Aerospace ExpositionJanuary 4–7Orlando, Florida, USA299
14Li FYu X LLin X2012Hypersonic Symposium and 5th National Hypersonic Science and Technology ConferenceCSTAM2012-B03-0300
15Ma LCai WCaswell A W 2009 Opt. Express 17 8602
16Guha ASchoegl I2012American Society of Mechanical Engineers International Mechanical Engineering Congress and Exposition305
17Xia H HXu Z YKan R FHe Y BLiu J GZhang G L 2015 Infrared Phys. Technol. 72 170
18Li NWeng C S 2011 Chin. Opt. Lett. 9 061201
19Nagali VChou S LBaer D SHanson R KSegall J 1996 Appl. Opt. 21 4026
20Yang W LWei D B2012CT Theory and Application2187
21Piccolomini E LZama F1999Appl. Math. Comput.10287
22Ma LCai W 2008 Appl. Opt. 47 3751
23Zhou X2005“Diode-laser Absorption Sensors For Combustion Control”Ph. D. DissertationCaliforniaStanford University
24Zhuang T G1992CT Principle and AlgorithmShanghaiShangHai Jiaotong University Press26
25Xu Z Y2012“Research on temperature measurement and 2D distribution for transient combustion process by infrared absorption spectroscopy”Ph. D. DissertationHefeiAnhui Institute of Optics and Fine Mechnics, Chinese Academy of Sciences(in Chinese)