


Experimental optimum design and luminescence properties of NaY(Gd)(MoO4)2:Er3+ phosphors
[Sun Jia-Shi†,  , Xu Sai‡, , Li Shu-Wei, Shi Lin-Lin, Zhai Zi-Hui, Chen Bao-Jiu]
, Xu Sai‡, , Li Shu-Wei, Shi Lin-Lin, Zhai Zi-Hui, Chen Bao-Jiu]


† Corresponding author. E-mail:
‡ Corresponding author. E-mail:
Project supported by Education Reform Fund of Dalian Maritime University, China (Grant No. 2015Y37), the Natural Science Foundation of Liaoning Province, China (Grant Nos. 2015020190 and 2014025010), the Open Fund of the State Key Laboratory on Integrated Optoelectronics, China (Grant No. IOSKL2015KF27), and the Fundamental Research Funds for the Central Universities, China (Grant No. 3132016121).
Three-factor orthogonal design (OD) of Er3+/Gd3+/T (calcination temperature) is used to optimize the luminescent intensity of NaY(Gd)(MoO4)2:Er3+ phosphor. Firstly, the uniform design (UD) is introduced to explore the doping concentration range of Er3+/Gd3+. Then OD and range analysis are performed based on the results of UD to obtain the primary and secondary sequence and the best combination of Er3+, Gd3+, and T within the experimental range. The optimum sample is prepared by the high temperature solid state method. Photoluminescence excitation and emission spectra of the optimum sample are detected. The intense green emissions (530 nm and 550 nm) are observed which originate from Er3+ 2H11/2→ 4I15/2 and 4S3/2→4I15/2, respectively. Thermal effect is investigated in the optimum NaY(Gd3+)(MoO4)2:Er3+ phosphors, and the green emission intensity decreases as temperature increases.
In recent years, trivalent rare earth ions have attracted much attention, due to their substantial advantages such as sharp emission lines, high color purity, strong capacity of light absorption, and high photoelectric conversion efficiency, etc.[1–3] Among numerous rare earth ions, Er3+ ions which act as activators for host material have been extensively studied and the research is concentrated on their high luminescent efficiencies. Currently, researchers pay more attention to Er3+ doped phosphors due to their plentiful energy levels and more pumping ways of up-conversion luminescence.[4–6] Though Er3+ has received great attention for the past few years, the relatively low absorption cross section of Er3+ ions leads to very poor luminescent efficiency.[7,8] On the other hand, Gd3+ is a special lanthanide element which can act as a good activator as well as a good sensitizer due to its half full 4f shell which can absorb and transfer energy effectively between trivalent rare earth ions. Moreover, Gd3+ with simple level structure and long excited state lifetime can easily match with Er3+ energy level Gd3+ and Er3+ co-doped materials can improve the luminescence efficiency.[9–11] Additionally molybdates have aroused considerable interest as a momentous host material possessing some specific properties to accommodate optically active rare-earth ions.[12,13] Molybdates can availably absorb blue or purple LED light and transfer to the rare earth ions. Studies on molybdates mainly focus on AX(MoO4)2 with a similar scheelite structure which has high randomness to broaden the spectrum inhomogeneously, augments the excited absorption cross section and weakens laser thermal effect.[14]
Luminescence intensity is a critical index to evaluate the luminescence performance of phosphor. The primary problem is how to figure out the optimum synthesis parameters of the phosphors in the experimental domain. Orthogonal design (OD) is the most prevalent fractional factorial design using orthogonal table to design scheme, choose the most effective test sites without losing the main information in the experimental range, which can significantly reduce the number of experimental runs.[15,16] The key to a successful experiment is the appropriate factors and the related variable span. In our experiment several factors will affect the luminescence intensity of luminescence material, and we consider three factors: the doping concentrations of Er3+ and Gd3+, and synthesized temperature T at the green emission intensity of NaY(Gd3+)(MoO4)2:Er3+ phosphors.
In order to obtain NaY(Gd3+)(MoO4)2:Er3+ phosphors with a maximum green emission intensity, the method of UD[17–20] is primarily employed to quickly narrow down the scope of factors and achieve the probable concentration ranges of Er3+ and Gd3+, and then OD and range analysis are used to ascertain the optimum combinations of Er3+, Gd3+, and T. The OD is proved to be a fairly straightforward and cost-effective optimization strategy that can be employed to assign test factors in a series of experimental trials.[21] It is worth noting that this method emphasizes the global optimization throughout the whole process of experimental design and datum analysis. The optimum NaY(Gd3+)(MoO4)2:Er3+ phosphor sample is synthesized by the high temperature solid state method. Photoluminescence excitation (PLE) and emission (PL) spectra are measured. The green emission integrated intensity of NaY(Gd3+)(MoO4)2:Er3+ phosphor under the optimal condition is in good agreement with the theoretical optimum result. In addition, the temperature-quenching mechanism of the optimum sample is also analyzed.
Reagent grade Gd2O3, Er2O3, Y2O3, MoO3, and Na2CO3 were used while NH4HF2 was used as a flux. The composition of the compound used was Na2CO3–z1Gd2O3–z2Er2O3–(1 − z1–z2)Y2O3–4MoO3, where z1 varies from 60 mol% to 90 mol% and z2 from 5.5 mol% to 8.5 mol% based on UD result as shown in Table
| Table 1. Design and result of UD. . |
The orthogonal table L16(45) was used in the experiment, and four levels were set for each factor. Based on the investigation factors and the corresponding levels, the combination of doping concentrations and T are arranged by orthogonal table shown in Table
| Table 2. Design and results of L16(45) OD. . |
The traditional high-temperature solid-state method was used for synthesizing the phosphors. The starting materials were accurately weighed according to the certain doping concentrations assigned through orthogonal design. These weighed powders should be fully ground to ensure a homogeneous blend and then the mixtures were poured into an alumina crucible. Afterwards, the mixture powders were calcined at different temperatures (from 700 °C to 1100 °C) for 4 h. Finally the wanted phosphors were obtained by grinding the bulk materials into powders.
The crystalline structure of the optimum phosphor was characterized by x-ray diffraction (XRD) (Shimadzu XRD-6000 diffractometer with Cu Kα1 radiation source radiation (λ = 0.15406 nm)). The scanning region of 2θ angles was from 10 °C to 70 °C in scanning step of 0.02°. PLE and PL spectra of the samples were measured by a Hitachi F-4600 fluorescence spectrometer equipped with a 150-W Xenon lamp.
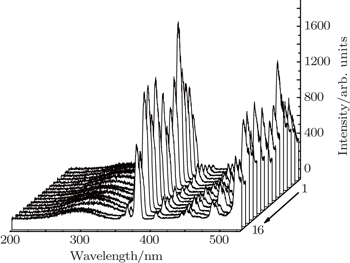
PLE and PL spectra for all the prepared samples are measured under the same experimental conditions. The integrated intensities denoted as Y value for the green emission are calculated and shown in Table unit in the NaY2(MoO4)2 host lattice. In the excitation spectrum of NaY(Gd3+)(MoO4)2:Er3+ phosphor, the broad absorption band from 250 nm to 350 nm is observed, which does not originate from Er3+ but from
group. Thus, we think there exists an energy transfer process between
group and Er3+. In this process,
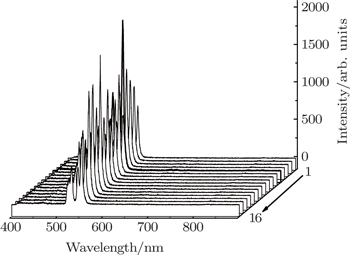
group acts as an energy transfer donor, and Er3+ ion acts as an acceptor. The other excitation bands peaking at around 365.2, 378.4, 407.2, 451.4, 488.2, and 521.4 nm are derived from Er3+ 4I15/2 → 2K15/2, 4I15/2 → 4G11/2, 4I15/2 → 2H9/2, 4I15/2 → 4F3/2, 4I15/2 → 4F5/2, and 4I15/2 → 4F7/2, respectively. The emission spectrum of Er3+ is obtained under the 380 nm excitation. From Fig.
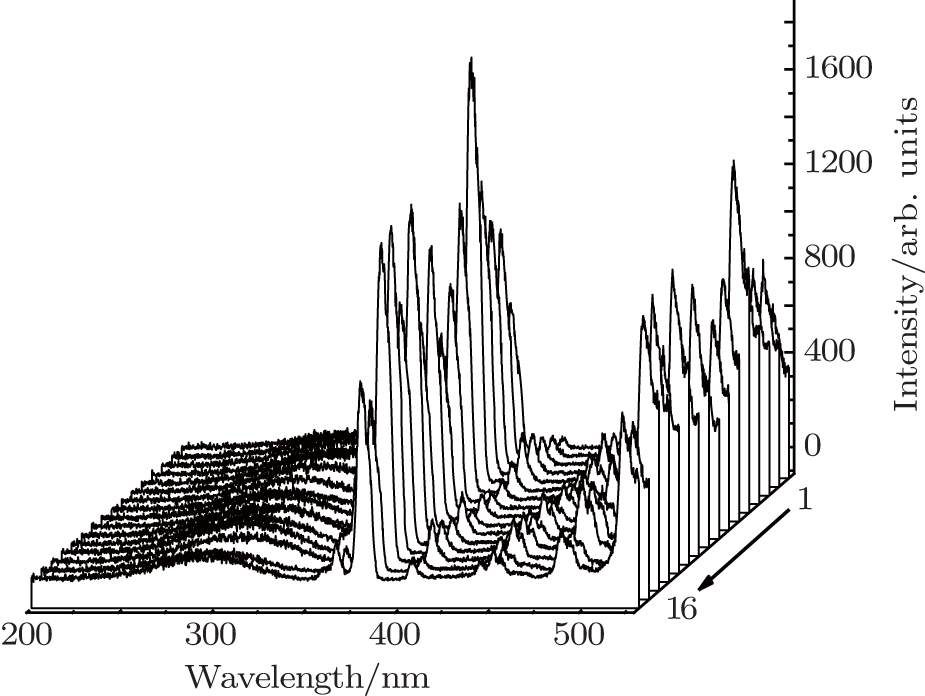 | Fig. 1. Excitation spectrum of NaY(Gd3+)(MoO4)2:Er3+ phosphor. |
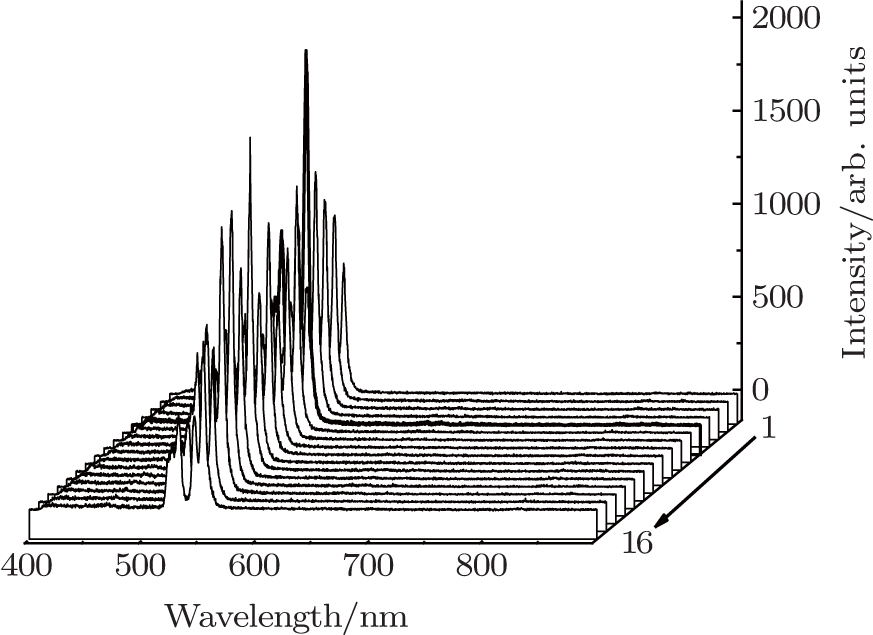 | Fig. 2. Emission spectrum of NaY(Gd3+)(MoO4)2:Er3+ phosphor. |
A reliable experimental result largely depends on appropriate analysis methods; moreover optimal design analysis is an indispensable component of orthogonal design. Even the best experimental design cannot struggle to meet the requirements for its experimental goals without appropriate optimal analysis methods. We have employed several analysis methods in previous work[25] such as variance analysis and GA (Genetic Algorithm). However, range analysis[26–28] has been proved to be a visual and vivid method through simple calculation and judgment, which can optimize the experimental results: preliminary and secondary factors, optimal levels and optimum combination. Range analysis aims to illustrate the significant levels of various influencing factors on the green light luminescence intensity and ascertain the best combination of z1, z2, and z3. Summarized in Table
The K value for each level of a parameter is the average of four values shown in the last column in Table
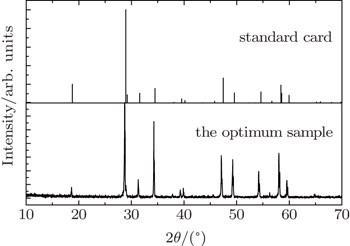
Figure
 | Fig. 3. Comparison of XRD of the optimal sample with that from standard card of NaY(MoO4)2. |
The position of the main peak has a gradual shift towards the lower degree, which indicates that Gd3+ doping is mainly in the way of replacing Y3+ rather than Mo6+. If Gd3+ replaces the site of Mo6+, the characteristics of crystal will change a lot due to the large radius gap between the two ions. Reversely, the radius, valence and electronegativity of Gd3+ ion are close to those of Y3+ ion, so replacing can easily be realized. This fact indicates that NaY(Gd3+)(MoO4)2:Er3+ phosphors can be produced by the traditional high temperature solid state reaction method and that the NaY(Gd3+)(MoO4)2:Er3+ phosphors doping at the present level does not cause any remarkable change in crystal structure.
In recent years, many researchers have studied the thermal stability of phosphors. Figure
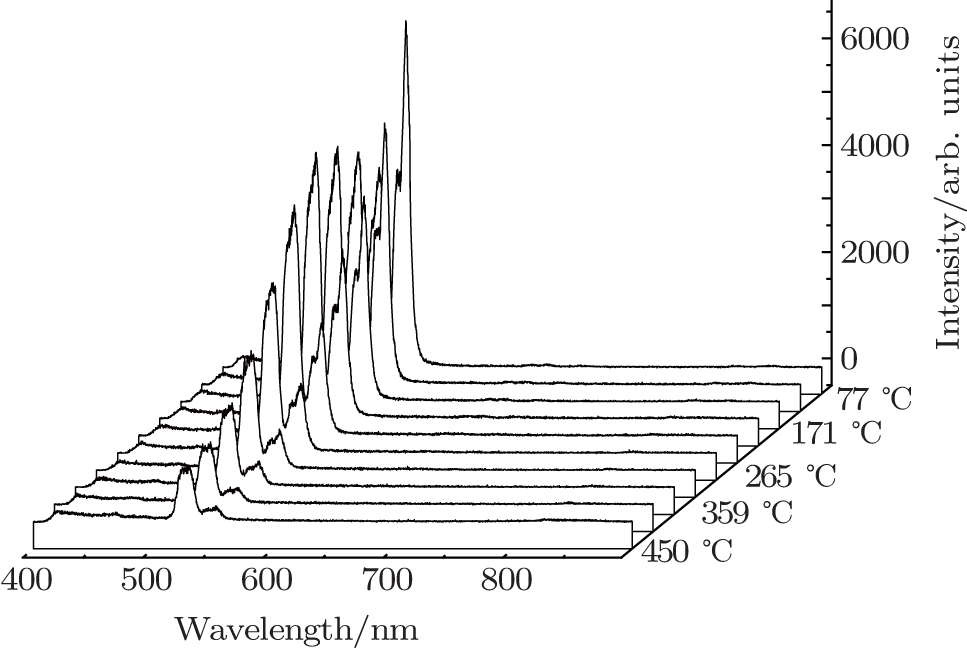 | Fig. 4. Emission spectra of the optimal NaY(Gd3+)(MoO4)2:Er3+ phosphor at different temperatures. |
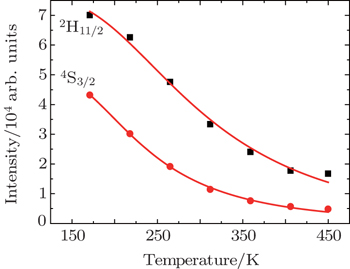
 | Fig. 5. Dependences of luminescence intensities (■ for 2H11/2−4I15/2 and • for 4S3/2−4I15/2 on temperature. |
As the energy difference between 2H11/2 and 4S3/2 levels is small, the green emission integrated intensities at various temperatures can be fitted by the following equation according to classical thermal quenching theory:[30,31]

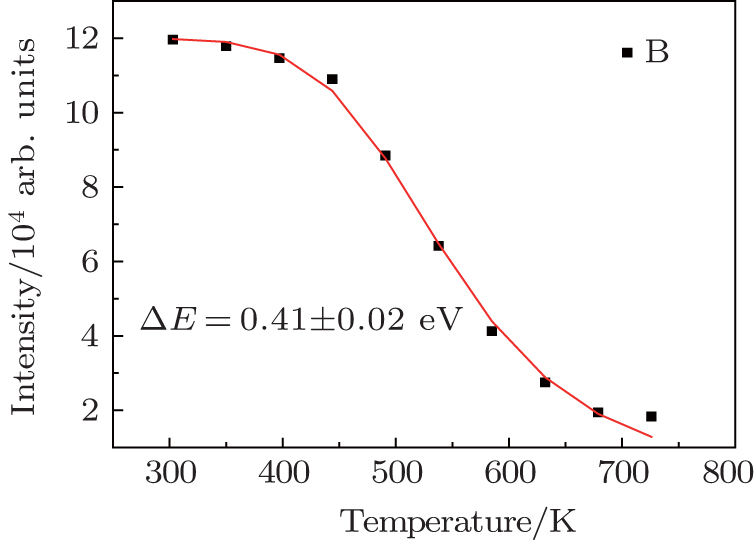 | Fig. 6. Dependence of luminescence intensity on temperature. |
The degradation of green emission intensity originating from temperature increasing is half the initial intensity at 550 K, thus the quenching temperature (T50) is confirmed to be 550 K. The temperature stability of the optimal NaY(Gd3+)(MoO4)2:Er3+ phosphors is higher than that of CaLa2(MoO4)4:Sm3+/Eu3+ phosphors. The green emission intensity reduces minutely with the increasing of the temperature, which adequately indicates that the optimal NaY(Gd3+)(MoO4)2:Er3+ phosphors may work at higher temperature and can be effectively applied to illumination, display and other practical applications. The thermal stability of the optimum sample is worthy to be favorable.
The uniform design is used to obtain the doping concentration of rare earth ions with Er3+[5.5%, 8.5%]*Gd3+[60%, 90%]*T[700 °C, 1100 °C]. The three-factor orthogonal design of Er3+/Gd3+/T and range analysis are employed to acquire the optimum combination of Er3+/Gd3+/T with 5.5 mol%Er3+, 70 mol%Gd3+, and 1100 °C. The optimum NaY(Gd3+)(MoO4)2:Er3+ phosphor with maximum green emission is synthesized by the high-temperature solid-state method. The XRD of optimum sample is characterized to verify its purity. Down-conversion excitation and emission spectra are also measured and the temperature effect on the optimum sample is analyzed according to the theory of the quenching temperature.
| 1 | |
| 2 | |
| 3 | |
| 4 | |
| 5 | |
| 6 | |
| 7 | |
| 8 | |
| 9 | |
| 10 | |
| 11 | |
| 12 | |
| 13 | |
| 14 | |
| 15 | |
| 16 | |
| 17 | |
| 18 | |
| 19 | |
| 20 | |
| 21 | |
| 22 | |
| 23 | |
| 24 | |
| 25 | |
| 26 | |
| 27 | |
| 28 | |
| 29 | |
| 30 | |
| 31 |