Kumaresh A, Arun Kumar R, Ravikumar N, Madhusoodanan U, Panigrahi B S, Marimuthu K, Anuradha M. Structural and photoluminescence studies on europium-doped lithium tetraborate (Eu:Li2B4O7) single crystal grown by microtube Czochralski (μT-Cz) technique. Chinese Physics B, 2016, 25(5): 058105
Permissions
Structural and photoluminescence studies on europium-doped lithium tetraborate (Eu:Li2B4O7) single crystal grown by microtube Czochralski (μT-Cz) technique
Project supported by the Department of Science and Technology–Science and Engineering Research Board (Grant No. SR/S2/LOP-0012/2011), the Government of India for Awarding Major Research Project, the University Grants Commission–Department of Atomic Research–Consortium for Scientific Research (Grant No. CSR–KN/CSR–63/2014–2015/503), and the Kalpakkam and Indore, India.
Abstract
Abstract
Rare earth europium (Eu3+)-doped lithium tetraborate (Eu:Li2B4O7) crystal is grown from its stoichiometric melt by microtube Czochralski pulling technique (μT-Cz) for the first time. The grown crystals are subjected to powder x-ray diffraction (PXRD) analysis which reveals the tetragonal crystal structure of the crystals. UV–vis–NIR spectral analysis is carried out to study the optical characteristics of the grown crystals. The crystal is transparent in the entire visible region, and the lower cutoff is observed to be at 304 nm. The existence of BO3 and BO4 bonding structure and the molecular associations are analyzed by Fourier transform infrared (FTIR) spectroscopy. The results of excitation and emission-photoluminescence spectra of europium ion incorporated in lithium tetraborate (LTB) single crystal reveal that the observations of peaks at 258, 297, and 318 nm in the excitation spectra and peaks at 579, 591, 597, 613, and 651 nm are observed in the emission spectra. The chromaticity coordinates are calculated from the emission spectra, and the emission intensity of the grown crystal is characterized through a CIE 1931 (Commission International d’Eclairage) color chromaticity diagram.
Potential field such as micromachining, lithography and medicine continuously creates demand for the low-cost and high-power ultraviolet (UV) laser source. Under these circumstances, infra-red solid state laser (Nd:YAG) combined with frequency converting single crystals provides a low-cost, highly-reliable and easily maintainable alternative to the source of solid-state UV laser.[1] Corrosive gases, which are bulkier in dimension and require complicated maintenance, are inevitable in using excimer lasers even as they emit wavelengths of coherent light in the UV and deep-UV spectral region. Hence, compact and efficient solid-state lasers with nonlinear optical (NLO) crystals in this spectral region are still needed.[2] Many nonlinear optical oxide crystals have been discovered in the past five decades. However, all of them are not good enough for practical applications. Some of the potential non-linear oxide single crystals that are used in current commercial applications include KTiOPO4 (KTP),[3] KH2PO4 (KDP), β-BaB2O4 (BBO),[4] LiB3O5 (LBO),[5] etc. In the search for identifying superior nonlinear optical frequency converting single crystals to emit light in the UV region, researchers have turned their focuses to borate crystals because of their high transmittances in the UV region. Komatsu et al.[6] in 1997 reported that the lithium tetraborate (LTB) single crystal with the chemical formula Li2B4O7, was used as a potential frequency converting material in generating the fourth (266 nm) and fifth (213 nm) harmonic of Nd:YAG laser. LTB exhibits a high laser induced damage threshold value (40 GW/cm2, Nd:YAG laser) and its mohs hardness is about 6, which is as hard as quartz.[6] The viscosity at the melting point is 280 mPa·s.[7] The first report on the phase diagram of Li2O−B2O3 by Sastry and Hummel in 1959[8] shows the existence of a congruent melting behavior in lithium tetraborate (Li2B4O7) with a melting point of 917 °C. Single crystals of LTB were grown for the first time by Garrett et al. in 1977 by the Czochralski technique.[9] Lithium tetraborate (LTB) single crystals were obtained from the hydrothermal method for the first time in 1992 by Byrappa and Shekar.[10] High-quality large sized crystals of LTB (diameter 5.1 cm, length 10.2 cm) were successfully grown for the first time by Fan et al. in 1990 using the Bridgman technique.[11] Li2B4O7 single crystals were grown using an accelerated crucible rotation technique by Xu and Fan,[12] and using the multi-crucible Bridgman method by Xu et al.,[13] and using a modified Bridgman method by Tsutsui et al., respectively.[14] The microtube Czochralski pulling technique paves the way to growing bulk crystal from the melt, if the seed crystal is not available for the material to be grown.[15]
A variety of host materials can be value added as a laser and luminescent materials by adding rare earth ions such as Eu3+, Er3+, Nd3+, Tm3+, Sm3+, Yb3+ as dopants. These rare earth ions act as activator centers in laser and luminescent materials and they show superior luminescence efficiencies as well as emissions in a desired spectral range.[16] Among the rare earth ions, the trivalent europium ion (Eu3+) is most widely used due to the fact that the Eu3+ ions exhibit narrow emissions, almost monochromatic behaviors, and possess a long excited state lifetime. Eu3+-doped materials are capable of producing red color emission with higher luminescence efficiency in the field emission technology and light-emitting diodes (LEDs).[17] In this paper, we report europium doped lithium tetraborate (Eu:LTB) single crystal by the micro-capillary Czochralski crystal pulling technique for the first time, and structural and luminescence properties of the grown crystals are discussed.
2. Experimental details
2.1. Synthesis
A platinum crucible was used in the synthesis process. Stoichiometric quantities of high-pure (99.9% purity) chemicals of Li2CO3, Eu2O3, and H3BO3 were properly weighed and were taken for the synthesis of 3 mol% of europium doped LTB (Eu:LTB) polycrystalline material by the solid-state reaction method. The chemical reactions to synthesize the polycrystalline materials are given as
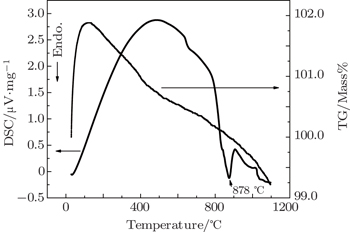
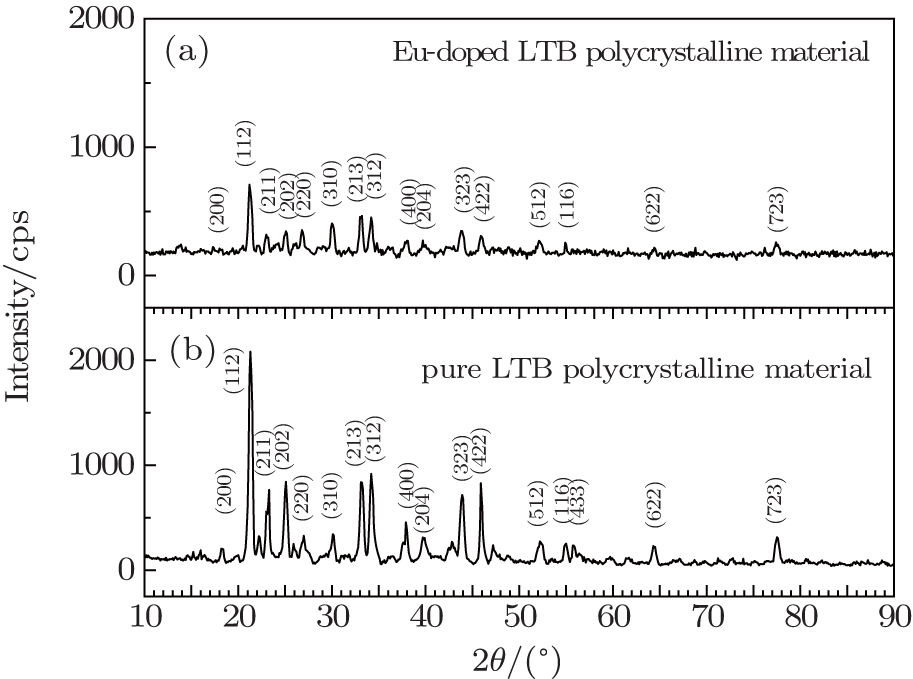
The polycrystalline materials of pure and 3 mol% Eu-doped LTB were confirmed by powder XRD which is shown in Fig. 1. The melting point (878 °C) of the Eu-doped LTB was identified by thermogravimetric/differential scanning calorimetry (TG/DSC) thermal analysis using a NETZSCH STA 449F3 thermal analyzer which is shown in Fig. 2.
Fig. 2. TG spectrum and DSC spectrum of Eu-doped LTB polycrystalline materials.
2.2. Growth of single crystal
Growing single crystals from melt using the Czochoralski (Cz) crystal pulling technique is an efficient and suitable method to grow large-sized single crystals with high growth rate and high quality, if the material exhibits congruently melting behavior. LTB is the congruently melting material. Owing to the non-availability of Eu-doped lithium tetraborate seed crystal, the microtube Czochralski pulling technique (μT-Cz) was adopted in which a platinum capillary tube with a 0.8-mm inner diameter and 40-mm length was kept just above the melt surface in order to attain the thermal equilibrium. After the attainment of thermal equilibrium, the platinum-microtube was made to contact the melt surface. The melt rose inside the platinum tube due to capillary action, then the temperature was reduced at an optimized rate until the growth was initiated.
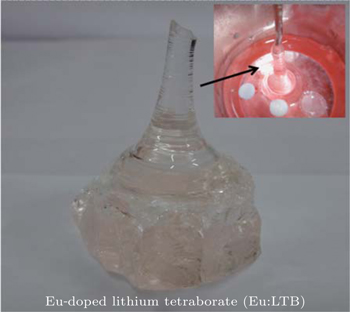
The melt in the microtube was allowed to crystallize then it was used as a primary seed. Successful growth was achieved by the optimized growth pulling rate of 0.3–0.8 mm/h and with the simultaneous rotation rate of 5 rpm. Good-quality Eu-doped LTB single crystals were grown and one of them is shown in Fig. 3.
Fig. 3. Photograph of as-grown crystal of Eu-doped LTB.
3. Results and discussion
3.1. Powder XRD analysis
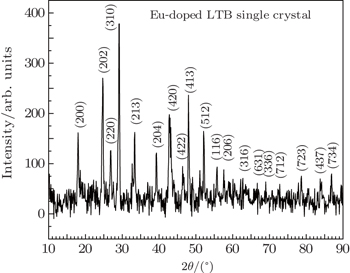
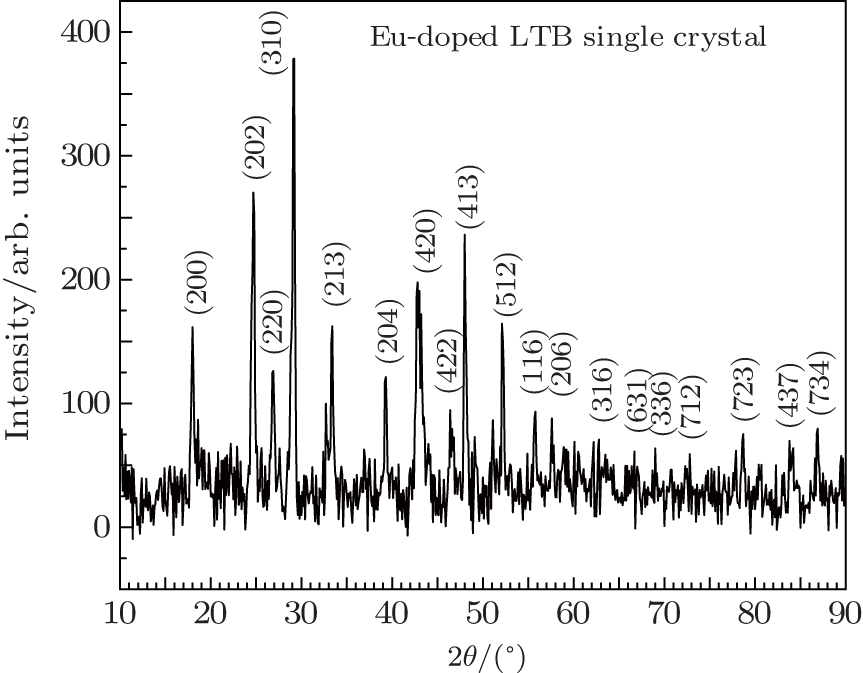
Powder x-ray diffraction studies were performed on the grown crystals to analyze the crystalline quality and their cell dimensions using a Rigaku x-ray diffractometer with a Cu Kα radiation (λ = 1.540 Å) source in the 2θ range of 10°–90°. The powder XRD pattern of Eu-doped LTB crystal is shown in Fig. 4. The majority of the peaks in the diffractogram are indexed based on a body centered tetragonal crystal structure having the space group I41cd (110, PCPDF #790963). The lattice parameters of the grown crystals are calculated and are listed in Table 1. This is the main crystallographic phase exhibited by the synthesized LTB sample. After doping with europium, the smaller lithium ions are replaced by larger europium ions, a slight decrease in the lengths of a and b axes and an increase in the length of c axis and an overall increase in the unit cell volume are observed.
Fig. 4. Powder XRD spectrum of Eu-doped LTB single crystal.
Table 1.
Table 1.
Table 1.
Unit cell parameters of pure LTB single crystal and Eu-doped LTB single crystal.
.
Sample
Lattice parameter
Cell volume/Å3
(α = β = γ)/(°)
Structure
(a = b)/ Å
c/Å
Pure LTB
9.4790
10.2901
924.5730
90
tetragonal
Eu:LTB
9.4558
10.4199
931.6672
90
tetragonal
Table 1.
Unit cell parameters of pure LTB single crystal and Eu-doped LTB single crystal.
.
3.2. UV–vis–NIR analysis
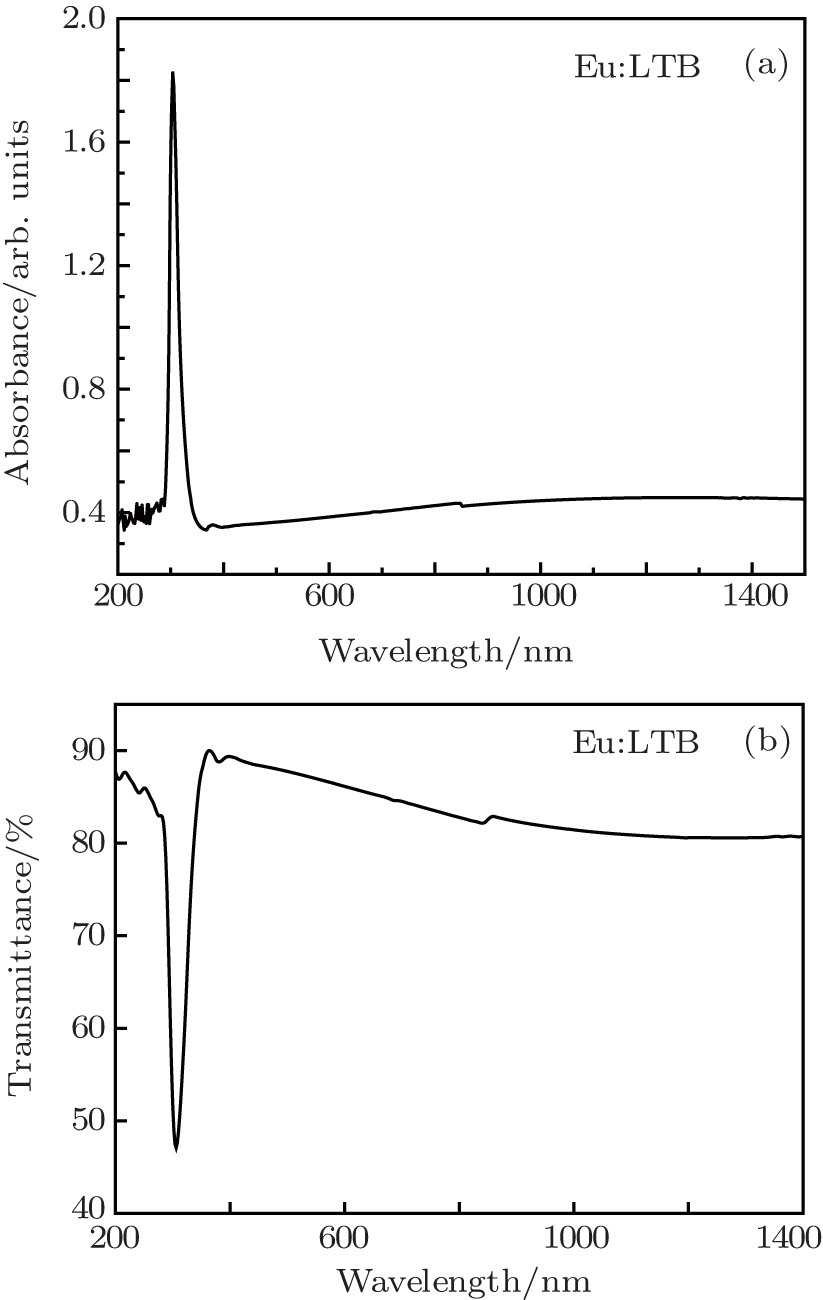
For optical applications, especially for second harmonic generation, the material of interest must possess a wide transparency window in the entire visible and near IR region. The UV–vis–NIR absorption and transmission spectra were recorded using a Jasco V-570 UV–vis–NIR spectrophotometer in a wavelength ranging from 200 nm to 1400 nm and are shown in Figs. 5(a) and 5(b).
Fig. 5. (a) Absorption curve and (b) transmittance curve of Eu-doped LTB single crystal.
The transmittance spectrum of a sample (T) is the measure of a fraction of photons that pass through the sample with respect to the incident number of photons. In a typical UV–vis–NIR spectroscopy measurement, the photons that are not absorbed nor scattered by the sample are measured and are usually expressed as a percentage of transmittance (T/%). For the grown Eu:LTB crystal, a strong absorption was observed at 304 nm. After the UV cutoff wavelength, it can be clearly observed from the spectra that there is an absence of characteristic absorption in the region between 310 nm and 1400 nm and a high degree of transmittance (≈ 85) that signifies that a majority of incident photons can pass through the grown crystal, which leads to its superior optical quality, thereby enabling the growing of crystals for second, third harmonic generations of Nd:YAG laser and other NLO applications.
3.3. FTIR analysis
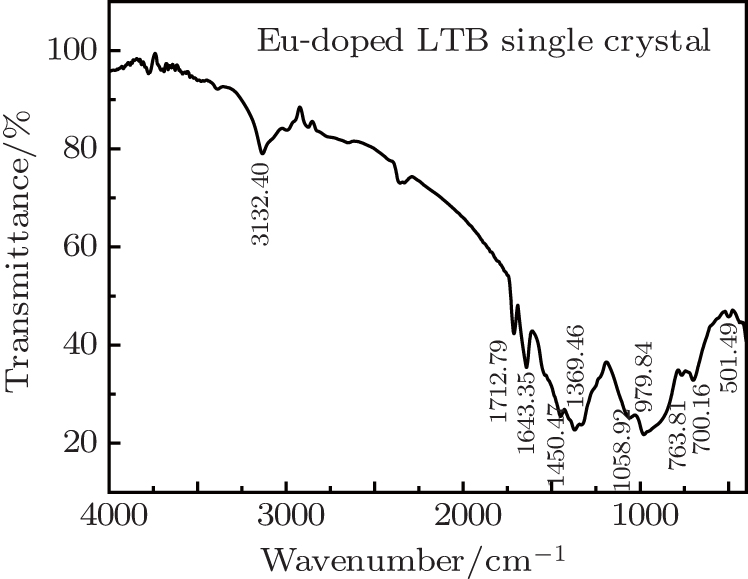
The Shimadzu FTIR-8400S spectrometer was adopted to record the Fourier transform infrared (FTIR) spectrum on the powdered sample of Eu-doped Li2B4O7 single crystal in the range of 400 cm−1–4000 cm−1. The prominent peaks in the FTIR pattern are indexed as shown in Fig. 6.
Fig. 6. FTIR spectrum of Eu-doped LTB single crystal.
The FTIR spectrum reveals the characteristic peaks located at 716.16 cm−1, 979.84 cm−1, 1058.92 cm−1, 1369.46 cm−1, 1450.47 cm−1, 1643.35 cm−1, and 1712.79 cm−1. In the measured infrared spectral range, the vibrational modes of borate show three distinct regions. The first region in the 1200–1750 cm−1 band is due to asymmetric stretching and bending vibration of the B–O bond of trigonal BO3 units. The second region in the 800–1200 cm−1 band is due to the B–O bond stretching of tetrahedral BO4 units. The third region is in the 600–800 cm−1 band originating from the bending vibrations of B–O–B linkages in the borate network. The band at 3123.40 cm−1 is assigned to hydrogen bonding due to O–H stretching vibration.[18,19] The characteristic absorptions and bonding assignments are listed in Table 2.
Table 2.
Table 2.
Table 2.
Vibrational frequency assignments of pure and Eu-doped LTB single crystals.
.
Characteristic absorption/cm−1
Bond assignments
Pure lithiumtetraborate
Eu-doped lithiumtetraborate
700
700.16
bending of B–O–B linkage in theborate network
1008
979.84, 1058.92
stretching vibrations ofBO4 unit (780–1100 cm−1)
1257, 1411
1369.46, 1450.47,1643.35, 1712.79
B–O stretching vibrations in trigonal(BO3) units (1200–1750 cm−1)
Table 2.
Vibrational frequency assignments of pure and Eu-doped LTB single crystals.
.
3.4. Excitation and luminescence spectral analysis
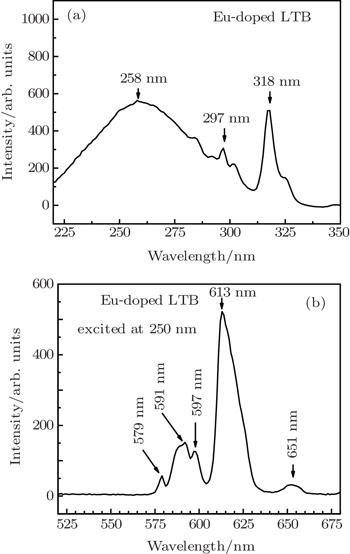
The excitation spectra of the Eu3+-doped lithium tetraborate single crystal are recorded in the wavelength range of 220–350 nm by monitoring an emission at 613 nm, which is shown in Fig. 7(a). In the excitation spectra, peaks at 258 nm, 297 nm, and 318 nm are observed. A comparison among them shows that the peak at 258 nm is more prominent than any of the other peaks. Hence, the wavelength closer to this prominent peak is used as a source of excitation to record the emission spectra in the 520–680 nm wavelength region as shown in Fig. 7(b). Both the spectra are recorded at room temperature by employing a Shimadzu spectrophotometer. Photoluminescence study of Eu-doped LTB crystal reveals that the Eu3+-doped LTB crystal can emit red color radiation upon proper excitation. Emissions with the following wavelengths are observed and attributed to the transitions in Eu3+ ions mentioned in brackets: 5D0 → 7F1 (591 nm),5D0 → 7F2 (613 nm), and 5D0 → 7F3 (651 nm). It is observed from the luminescence spectra that the intensity is higher for the 5D0 → 7F2 transition than for other transitions. This transition is due to the electric dipole in nature which makes an Eu3+ ion more sensitive to the environment around its site and follows the selection rule ΔJ = 2. The absence of a center of symmetry and the mixing of 4f orbitals with the opposite parity orbital are the main reasons for the occurrence of electric dipole transitions. The observed 5D0 → 7F1 transition is due to the magnetic dipole interaction and obeys the selection rule ΔJ = 1, which is independent of the local symmetry.[20]
Fig. 7. (a) Excitation spectrum and (b) emission spectrum of Eu-doped LTB single crystal.
3.5. CIE chromaticity coordinates
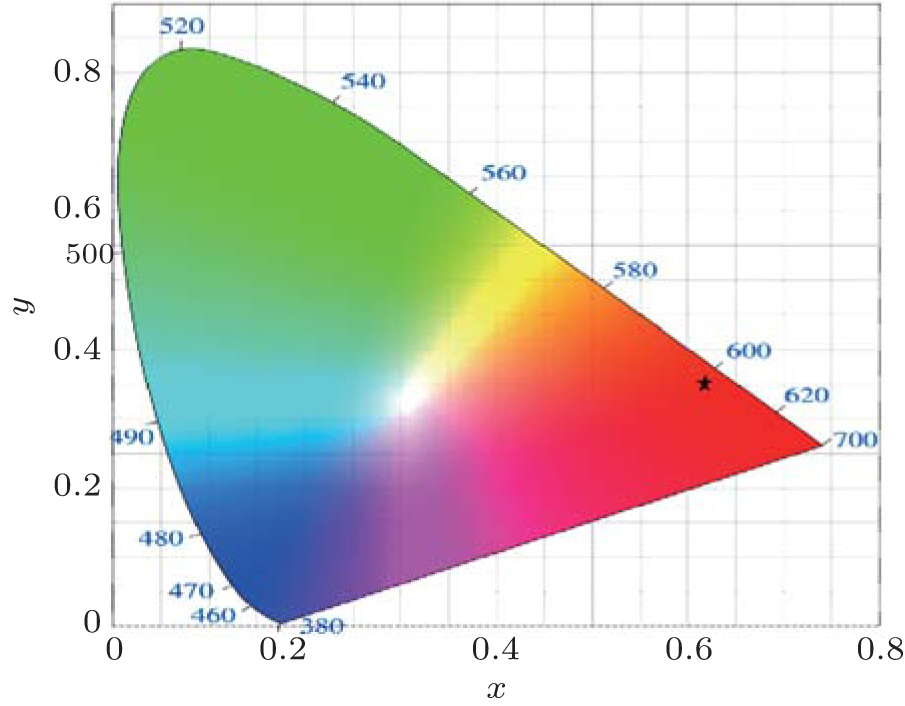
To characterize the true color emitted nature of the material, it is necessary to study the color coordinates marked on a standard chromaticity diagram.[21] The CIE 1931 (Commission International d’Eclairage) diagram is a universal method to represent all the possible colors by combining three primary colors and is used to quantify the tunability of emission wavelength and the change in intensity of the emission band. The emission intensities of the Eu-doped LTB crystals are characterized through a CIE 1931 color chromaticity diagram. Three color matching functions such as x̅ (λ), y̅ (λ), and z̅ (λ) provide enough description of the color produced by any light source. The real spectral colors can be obtained by adding three artificial ‘colors’ denoted as X, Y, and Z called the tristimulus values. The degree of stimulation necessary to match the color of a given power spectral density P(λ) can be expressed as
where X, Y, and Z are the tristimulus values and give the power for each of the three primary colors required to match with the color of P(λ). From these tristimulus values, the color chromaticity coordinates x and y can be determined from the following expression:[22]
The calculated (x, y) coordinates are found to be (0.6137, 0.3519) corresponding to the grown crystal. The location of the chromaticity coordinates (x, y) of the crystal is shown in Fig. 8. It is evident from the figure that the color co-ordinates of Eu-doped LTB crystals fall in the reddish-orange region of the CIE-1931 chromaticity diagram under the 258-nm wavelength excitation.
Fig. 8. CIE colour chromaticity diagram of Eu3+ ion-doped LTB single crystal.
4. Conclusions
Eu-doped LTB polycrystalline materials are synthesized from their precursors. The polycrystalline materials of pure and Eu-doped LTB are confirmed by powder XRD. The melting point of Eu:LTB is found to be 878 °C by thermal analysis (TG/DSC). Single crystals of Eu:LTB are grown by the melt growth technique through using the microtube Czochralski pulling (μT-Cz) set-up without a seed for the first time. The crystal structure of Eu:LTB is analyzed by powder XRD, which reveals that the grown crystal belongs to the tetragonal crystal system and the unit cell dimensions are calculated. UV–vis–NIR analysis reveals that the grown crystal is transparent in the region of 310–1400 nm, which enables the growing of crystals for luminescence, NLO and other optical applications. Molecular associations of the functional groups are confirmed by FTIR analysis. The Eu-doped LTB single crystal is characterized by photoluminescence in the region of 520–680 nm. Europium ion in the trivalent state in the host LTB is confirmed by its characteristic emission. The x, y color chromaticity coordinates of the Eu:LTB are found to occur in the reddish-orange region in the CIE 1931 diagram and is suitable for red laser applications and display devices.
Structural and photoluminescence studies on europium-doped lithium tetraborate (Eu:Li2B4O7) single crystal grown by microtube Czochralski (μT-Cz) technique


 , Ravikumar N1, 2, Madhusoodanan U3, Panigrahi B S3, Marimuthu K4, Anuradha M5]