
Magnetoresistance and exchange bias in high Mn content melt-spun Mn46Ni42Sn11Sb1 alloy ribbon
[Huang Qingxue1, †,  , Chen Fenghua1, ‡, , Zhang Mingang1, Xu Xiaohong2]
, Chen Fenghua1, ‡, , Zhang Mingang1, Xu Xiaohong2]
 |


† Corresponding author. E-mail:
‡ Corresponding author. E-mail:
Project supported by the National Basic Research Program of China (Grant No. 2012CB722801), the Postdoctoral Science Foundation of China (Grant No. 2015M571285), the National Natural Science Foundation of China (Grant No. 51401140), the Postdoctoral Research Station Foundation of Taiyuan University of Science and Technology, China (Grant Nos. 20142014, 20152041, and 20151082), the Natural Science Foundation of Shanxi Province, China (Grants Nos. 2015021019, 2015091011, and 2015081011), and the Key Team of Scientific and Technological Innovation of Shanxi Province, China (Grant No. 2013131009).
Highly textured Heusler alloy Mn46Ni42Sn11Sb1 ribbons were prepared by melt spinning. The annealed high Mn content Mn46Ni42Sn11Sb1 ribbon cross-section microstructure, crystal structure, martensitic transformation (MT), and magnetoresistance (MR) properties were investigated. The MR in the annealed ribbon was assessed by the magnetic field direction perpendicular to the ribbon surface with the magnetic field up to 30 kOe. The large negative value of 25% for MR was obtained at 244 K. The exchange bias (EB) effects of the as-spun and annealed ribbons were investigated. After annealing, the EB effects have been improved by about 25 Oe at the temperature of 50 K. The magnetizations have increased approximately by 10% more than the as-spun ribbon.
The fact that the off-stoichiometric Ni2Mn1+xX1−x (X = In, Sb, or Sn) ferromagnetic shape memory alloys (FSMAs) undergo martensite transformation (MT) was reported by Sutou et al. for the first time.[1] Later, there were several research groups which studied the magnetic properties and magnetoresistance (MR) in both NiMnSn and NiMnIn alloys.[2–19] In 2006, giant MR (50%) was obtained in Ni50Mn34In16 alloys in a magnetic field of 1 T,[2] while the Ni50Mn36Sn14 got the same level (50%) in magnetic fields up to 17 T.[3] Even though a larger MR can be obtained in the NiMnIn than that in NiMnSn alloys, the necessity to the success of commercial use lies in the low-cost materials being available. By comparing the price of nickel and manganese, a high manganese content of alloy composition can effectively reduce the production cost.
Up to now, most of the research works have mainly focused on the Ni2Mn1+xSn1−x alloys in which the content value of Mn is less than that of Ni,[4–8] and only a few reports are about high-Mn content Mn–Ni–Sn FSMAs.[9–14] Excessive Mn atoms occupy the vacant Sn sites, and their moments are coupled antiferromagnetically to those of the surrounding Mn atoms on the regular Mn sites.[9,11] It was pointed out that the MT temperatures in FSMAs were relative to the valence electron concentration e/at (electrons per atom).[3,11] The valence electron is determined as the number of 3d and 4s electrons of transition metals (Ni, Mn, Co, Fe, Cu, etc.) and the number of 5s and 5p electrons of In, Sn, or Sb. It is common knowledge that the coexistence of ferromagnetic (FM) and antiferromagnetic (AFM) phases in martensitic and the coupling at the AFM/FM interface would result in an exchange bias (EB) behavior in Ni–Mn based on FSMAs.[20,21] Researchers have reported the MCE changes in Ni43Mn46Sn11−xSbx and Ni43Mn46−xCuxSn11 alloys at a low field.[22,23] As to the MR, exchange bias (EB) in these alloy ribbons are not well reported. Recently, some new research works suggest that the Mn-rich Heusler alloys such as Co2MnAl, Mn2CoAl, etc. have been found to present the possibility of high MR.[24–27]
Compared with the bulk material alloys, rapid quenching by melt spinning will provide a possibility to prepare a ribbon with a specific texture which could be favorable to MR and EB at a suitable magnetic field. In the present work, highly textured Heusler alloy Mn46Ni42Sn11Sb1 ribbons were prepared by melt spinning. The MR on textured Mn46Ni42Sn11Sb1 ribbons during the martensitic phase transitions were investigated. For a better understanding of the relationship among the magnetic field, magnetic resistance, and temperature, the isothermal MR-H was tested at the respective MT temperatures. EB behavior between as-spun and annealed ribbon is also studied.
The ingot was induction melted in a quartz tube and melt-spun at a typical wheel surface speed of 10.0 m/s. The resulting ribbon was annealed at 1073 K for 1 h and cooled in the vacuum furnace. The average compositions of the ribbons were considered by the x-ray energy dispersive spectroscopy (EDS) analysis. The crystal structure of the sample was analyzed with a Panalytical X’Pert pro type x-ray diffractometer (XRD) with Cu Kα radiation. The lattice parameters were calculated through using Jade 5.0 XRD analytical software. The magnetic properties were measured using a multi-use vibrating sample magnetometer VersaLab system (Quantum Design), in a magnetic field up to 30 kOe. The temperature dependence of magnetization M–T curves was performed at a cooling/heating rate of 2 K/min. The electrical resistance was carried out by using a press contact assembly four-probe technique. The magnetic field direction was perpendicular to the free surface of the ribbon (H⊥ the current). Resistance and MR were set as functions of the field (0 and 30 kOe) at different temperatures (150–300 K). Acquisition and control of the measurements were performed by using electrical transport option software (ETO, Quantum Design). Before the isothermal magnetic field MR curves were recorded, the sample was cooled down to the Curie temperature of the martensitic phase 
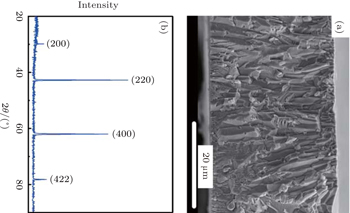
Typical SEM image of the fracture cross-section of the melt spun ribbon was presented in Fig.
The XRD patterns of annealed ribbons measured at room temperature are presented in Fig.
 | Fig. 1. The Mn46Ni42Sn11Sb1 alloy ribbons annealed at 1073 K for 1 h. (a) SEM micrograph of ribbon fractured cross section, and (b) the room-temperature XRD pattern. |
The temperature dependence of the magnetization (M–T) curves and the temperature dependence of electrical resistance (R–T) for the Mn46Ni42Sn11Sb1 alloy ribbons were measured. Figure 


 | Fig. 2. The M–T curves for Mn46Ni42Sn11Sb1 alloy ribbons on heating and cooling under a magnetic field of 100 Oe (a), the R–T curves measured on heating and cooling without magnetic field (b). |
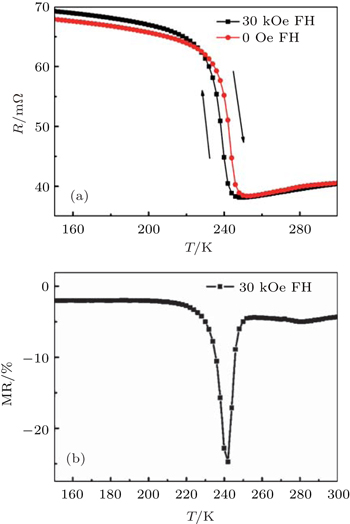
The R–T curves for the Mn46Ni42Sn11Sb1 ribbons at 0 and 30 kOe on heating are plotted in Fig.
 | Fig. 3. (a) R–T curve at 0 and 30 kOe magnetic fields on heating. (b) MR as a function of temperature for Mn46Ni42Sn11Sb1 alloy ribbons on heating at 30 kOe. |
As we already know, the large MR in these ribbons is likely to be caused by the field-induced change in electronic structure, which modifies the density of the states near the Fermi surface and leads to an abrupt change in resistance near the MT temperatures.[10,14]
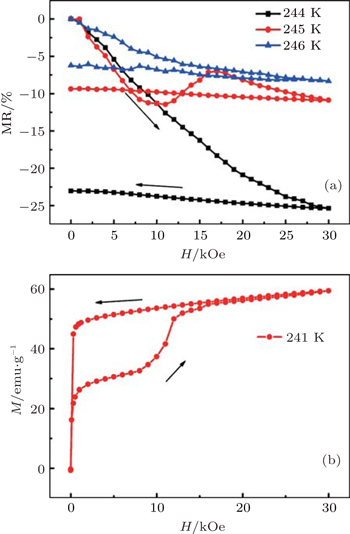
In order to get a better understanding of the relationship among the magnetic field, magnetic resistance, and temperature, especially the relationship of the martensitic transformation processes, we tested the isothermal MR–H near the respective MT temperatures. In order to prevent austenite and martensitic phases in the sample from coexisting with each other, before the isothermal magnetic field MR–H curves were recorded, the sample was cooled down to 

The isothermal M–H curves for the Mn46Ni42Sn11Sb1 alloy ribbon were measured at 241 K at a magnetic field up to 30 kOe. In Fig.
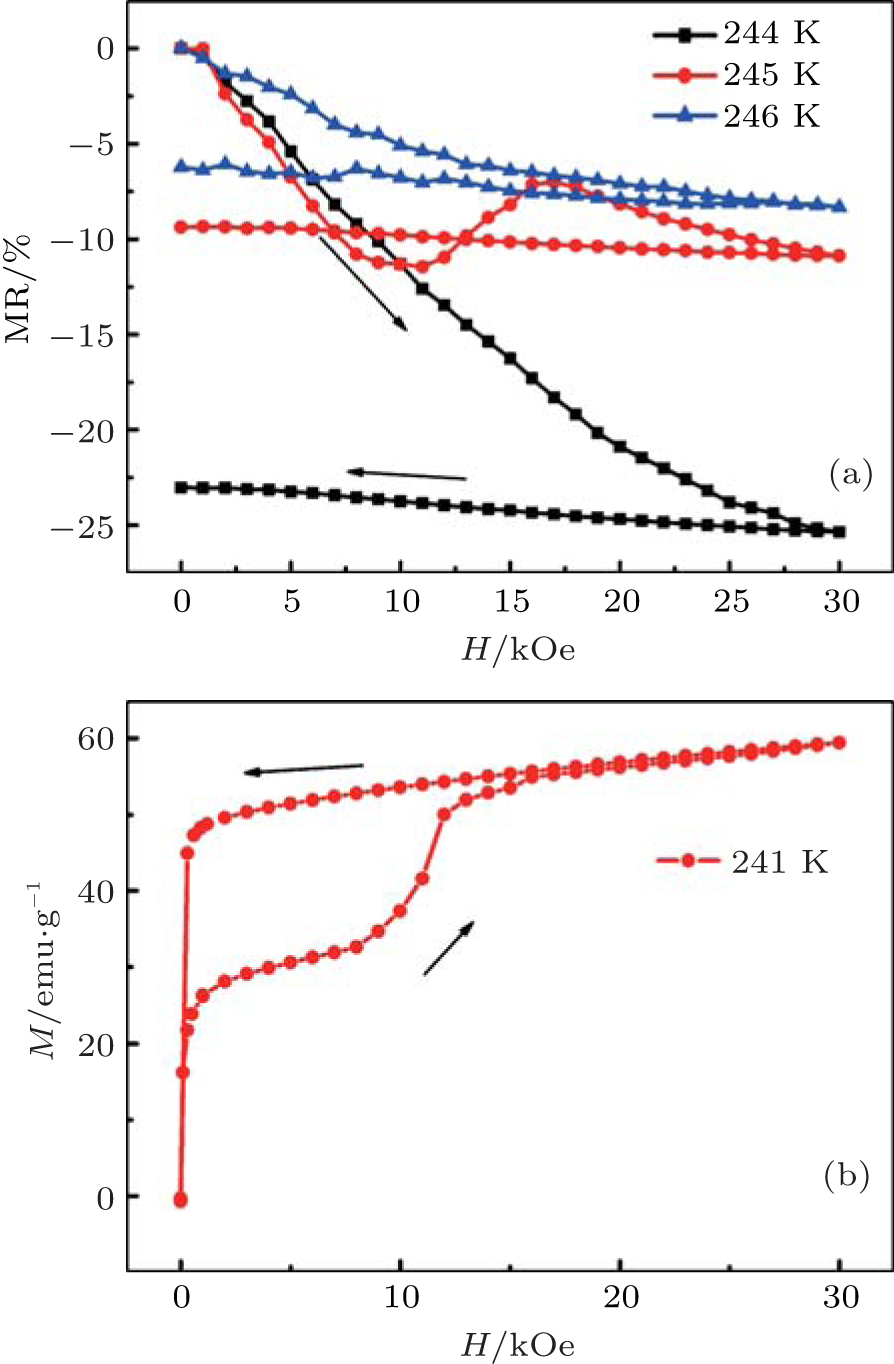 | Fig. 4. The MR–H curves at different constant temperatures for Mn46Ni42Sn11Sb1 alloy ribbons (a). The typical isothermal M–H curves at constant temperatures (b). The sample was first cooled to 150 K and then heated back to the respective constant temperatures for MR measurement. |
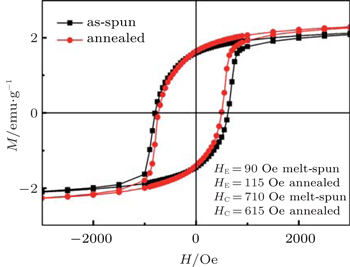
Figure
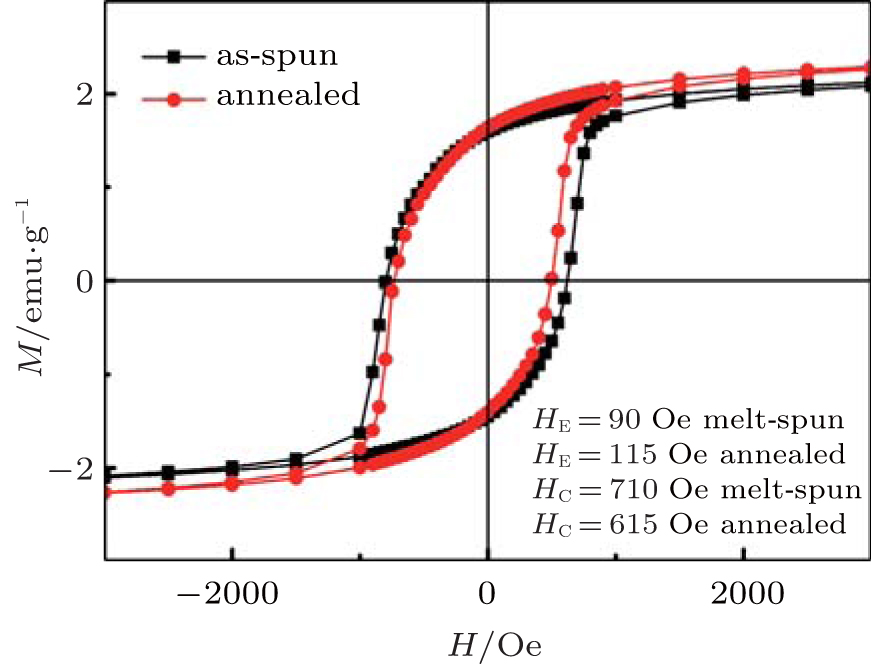 | Fig. 5. The M–H loops of melt-spun and annealed Mn46Ni42Sn11Sb1 ribbons measured at 50 K. |
Highly textured Heusler alloy Mn46Ni42Sn11Sb1 ribbons were prepared by melt spinning. The annealed high Mn content Mn46Ni42Sn11Sb1 ribbon prepared by melt-spun and cross-section microstructure, martensitic transformation (MT), and magnetoresistance (MR) properties were investigated. From the XRD patterns, it is clear that the sample crystal structure is in the cubic L21, and the intensity ratio of I(400)/I(220) is about 69.39%. The ribbons exhibit that crystallographic texture is in agreement with their grain-oriented columnar microstructure. The crystal directions [400] are preferentially oriented perpendicular to the ribbon plane. The large negative value of 25% for MR is obtained at 244 K. At 245 K, a field-induced MT happens; we use the isothermal M–H curve to explain the reasons. The exchange bias (EB) effects of the as-spun and annealed ribbons were investigated. After annealing, the EB effects have been improved at the temperature of 50 K.
| 1 | |
| 2 | |
| 3 | |
| 4 | |
| 5 | |
| 6 | |
| 7 | |
| 8 | |
| 9 | |
| 10 | |
| 11 | |
| 12 | |
| 13 | |
| 14 | |
| 15 | |
| 16 | |
| 17 | |
| 18 | |
| 19 | |
| 20 | |
| 21 | |
| 22 | |
| 23 | |
| 24 | |
| 25 | |
| 26 | |
| 27 | |
| 28 | |
| 29 | |
| 30 | |
| 31 | |
| 32 |