

Homopolar bonds in Se-rich Ge‒As‒Se chalcogenide glasses
[Xu Si-Wei1, 2, Wang Rong-Ping2, †,  , Yang Zhi-Yong3, Wang Li1, Barry Luther-Davies2]
, Yang Zhi-Yong3, Wang Li1, Barry Luther-Davies2]
|
|


† Corresponding author. E-mail:
Project supported by the Australian Research Council (ARC) Centre of Excellence for Ultrahigh Bandwidth Device for Optical System (Project CE110001018), Australian Research Council Discovery Programs (Project DP110102753), and the Importation and Development of High-Caliber Talents Project of Beijing Municipal Institutions, China.
We have prepared three groups of Ge–As–Se glasses in which the Se content is 5.5 mol%, 10 mol%, and 20 mol% rich, respectively. We explored the possibility of suppressing the formation of the Ge–Ge and As–As homopolar bonds in the glasses. Thermal kinetics analysis indicated that the 5.5 mol% Se-rich Ge11.5As24Se64.5 glass exhibits the minimum fragility and thus is most stable against structural relaxation. Analysis of the Raman spectra of the glasses indicated that the Ge–Ge and As–As homopolar bonds could be almost completely suppressed in 20 mol% Se-rich Ge15As14Se71 glass.
Chalcogenides are materials containing one of the chalcogen elements (S, Se, and Te) covalently bonded to the elements such as Ge, As, Si, and Sb. Depending on their chemical composition and structure, chalcogenides can display metallic, semi-conducting, or insulating properties. They have an increasing number of important applications in electronics and photonics because of their high optical nonlinearity and wide transmission range.[1–5] For example, researchers have used chalcogenide glasses for all-optical processing of high speed telecommunication signals.[6,7] It has been demonstrated that the glass properties can be tuned in a widely compositional range, therefore, it is possible to optimize the glasses for specific applications by tuning the material composition.[8–10]
Low optical loss and high stability are two important parameters for the application of the glasses in photonics. In terms of stability, Bulla et al. and Su et al. investigated the properties of Ge–As–Se thin films with different chemical compositions,[11,12] and found that stable glass films exist for a mean coordination number (MCN) of 2.45, where MCN is the sum of the products of the individual abundance times the coordination of the constituent atoms.[13] More recently, Ting et al. investigated 34 samples of Ge–As–Se glasses with compositions distributed across the glass forming region and covering wide ranges of stoichiometry and MCN. In these samples, the activation energy for enthalpy relaxation showed a sharp minimum at the percolation threshold MCN = 2.40, but the minimum extended to cover a wide range of non-stoichiometric glasses which were up to 20 mol% Se-rich.[9] On the other hand, the fragility, which is defined by the rate at which the constraints are broken with increasing temperature above Tg, appears to be rather independent of MCN but is controlled by the departure from stoichiometry. Therefore, MCN is considered only properly defined at low temperature.[9] The activation energy at Tg may correlate with MCN because it reflects the energy required to gain mobility relative to a state where all constraints are intact. Therefore, strong glasses with the smallest fragility indices are relatively stable against structure relaxation and are likely to be the best for the applications in photonics.
In terms of optical loss, our evidence indicates that the losses in the glasses are correlated with the number of the Ge–Ge and As–As homopolar bonds.[14,15] Ideally, such homopolar bonds should be completely suppressed in chemically stoichiometric glasses since all chalcogen elements should be consumed by the network-forming elements such as Ge, As, and Sb. However, it has been found that homopolar Ge–Ge, As–As, and Sb–Sb bonds all exist in chalcogen-rich glasses and chalcogen–chalcogen bonds even exist in chalcogen-poor glasses.[16,17] Our recent measurements of Raman and x-ray photoelectron spectra confirmed that finite numbers of homopolar Ge–Ge and As–As bonds appeared, indicating that Se was not always bonded with Ge or As in chemically stoichiometric Ge–As–Se glasses.[18] It is expected that, increasing the Se concentration can eliminate the Ge–Ge and As–As homopolar bonds in the Se-rich glasses. Moreover, it is possible to identify the Se-rich glasses that have the minimum fragility index with stable properties against structural relaxation.
To elucidate this, we prepared three groups of Se-rich Ge–As–Se glasses (5.5 mol%, 10 mol%, and 20 mol% Se-rich, respectively). We measured the Raman scattering spectra of the glasses, and decomposed them into different structural units with the aim of understanding the evolution of the number of homopolar bonds as a function of the chemical composition.
GexAsySe1−x−y bulk glasses were prepared by the melt-quenching technique. High purity (5N) raw materials Ge, As, and Se were weighed (15 g) inside a dry nitrogen glove box and loaded into a pre-cleaned quartz ampoule, which was then evacuated to 10−6 Torr and dried at 160 °C for 4 h to ensure the removal of surface moisture from the raw materials. The ampoule was sealed under a vacuum using an oxygen hydrogen torch, and introduced into a rocking furnace to melt the contents at 900 °C for 30 h. Then the ampoule was removed from the rocking furnace and quenched in air. Subsequently, the glass sample was annealed below the glass transition temperature Tg and finally slowly cooled to room temperature.
The quality of the glasses was examined using x-ray diffraction (XRD) and infrared (IR) microscopy. The XRD patterns indicated that the glass structure was amorphous, and the IR microscopy revealed the absence of any observable bubbles in all the samples. The x-ray energy dispersive spectra (EDS) were used to check the composition of the glasses. Generally, we examined several different positions. We found that the fluctuations in the glass compositions were less than 0.5%. The glass transition temperatures (Tg) were measured using a differential scanning calorimetry (DSC) (Mettler-Toledo, DSC1) with different scanning rates from 5 K/min to 30 K/min under a uniform nitrogen gas flow of 50 mL/min. In all cases, we raised the temperature above Tg to erase the thermal history in the first run, and then the inflection point along the step transition in the second run was read as Tg using STARe analysis software (Mettler-Toledo) and the error bar of the reading was within 0.5 °C. The activation energy and fragility were extracted from Tg measurements using the procedure presented in Ref. [9].
Raman spectra were recorded using a T64000 Jobin-Yvon-Horiba micro-Raman spectrometer equipped with a liquid-nitrogen-cooled CCD detector. The 830 nm laser line was used as an excitation source, and the laser power was kept as small as possible to avoid any photo-induced effects. The resolution of the spectrometer was about 0.5 cm−1. We first collected Raman spectra from various parts of the glass rod. The identical profiles of the spectra indicated the homogenization of the glass. Then the Raman spectra were reduced by the removal of the Bose–Einstein factors following the standard procedures and then were decomposed into different structural units.[18] We used PeakFit software and an iterative method to simulate the peak center, full width at half maximum, and the height of each Raman vibrational peak. In all cases, we only set up the initial value of the peak position, the final value of the real position could be different. In other words, the individual Raman peak had the freedom to change its position, width, and height during the fitting process.
It is well accepted that Tg is a measure of the glass network connectivity. All the compositions we studied are in the glass-forming region and have an MCN between 2.4 and 2.6, and therefore should have a continuous network structure.[19,20] Therefore, with increasing content of 4-folded coordinated Ge, the MCN increases and the glass exhibits better network connectivity which corresponds to an increasing Tg. This is evident as shown in the fourth column of Table
| Table 1. Composition and corresponding mean coordination number (MCN), glass transition temperature (Tg), activation energy (Ea), and fragility index (m) of GexAsySe1−x−y glasses. . |
The compositions and the corresponding MCN, Tg, Ea, and m of GexAsySe1−x−y glasses are reported in Table
Indeed, the fragility defines the rate at which the system departs from equilibrium upon losing ergodicity, thus it reflects the tendency of the glass to undergo structural relaxation below Tg. Chalcogenide glasses usually have low Tg and thus the relaxation processes could be significant even at room temperature. A fragile glassy system departs from equilibrium at a faster rate than a strong system, and this is highly undesirable for applications such as integrated infrared optics where the relaxation processes can lead to the change of the physical properties like refractive index and bandgap which may degrade the device performance.[11,12,14,21] The last column in Table
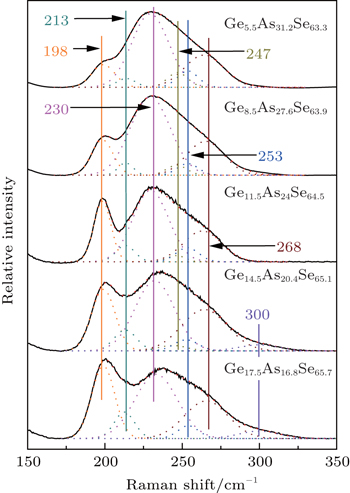
Raman spectra of the glasses are recorded from 150 cm−1 to 350 cm−1. Generally, there are two broad bands. One is centered at 200 cm−1 and the other is at 230 cm−1 with a broad tail extending to 300 cm−1. It is well accepted that depending on the composition, GeSe4/2 tetrahedral AsSe3/2 pyramidal, and some homopolar bonds are cross-linked to form the Ge–As–Se glass network. Corner-sharing (CS) and edge-sharing (ES) GeSe4/2 tetrahedral units have Raman peaks at 195 cm−1 and 213 cm−1, respectively.[22,23] AsSe3/2 pyramidal units have Raman peaks at 230 cm−1 and 268 cm−1.[18] The peak at 250 cm−1 is due to the vibrational modes of Se chains or rings.[22] One peak at 175 cm−1 and another peak at 300 cm−1 are the characteristic of the Ge–Ge mode of the ethane-like (Se3)Ge–Ge(Se3) structural unit.[24,25] The peak at 247 cm−1 is ascribed to the As–As vibration modes.[18,26–30]
In order to quantify the structural evolution, the Raman spectra of these glasses (5.5 mol%, 10 mol%, and 20 mol% Se-rich, respectively) are decomposed into multiple Gaussians based on the structural units. Figure
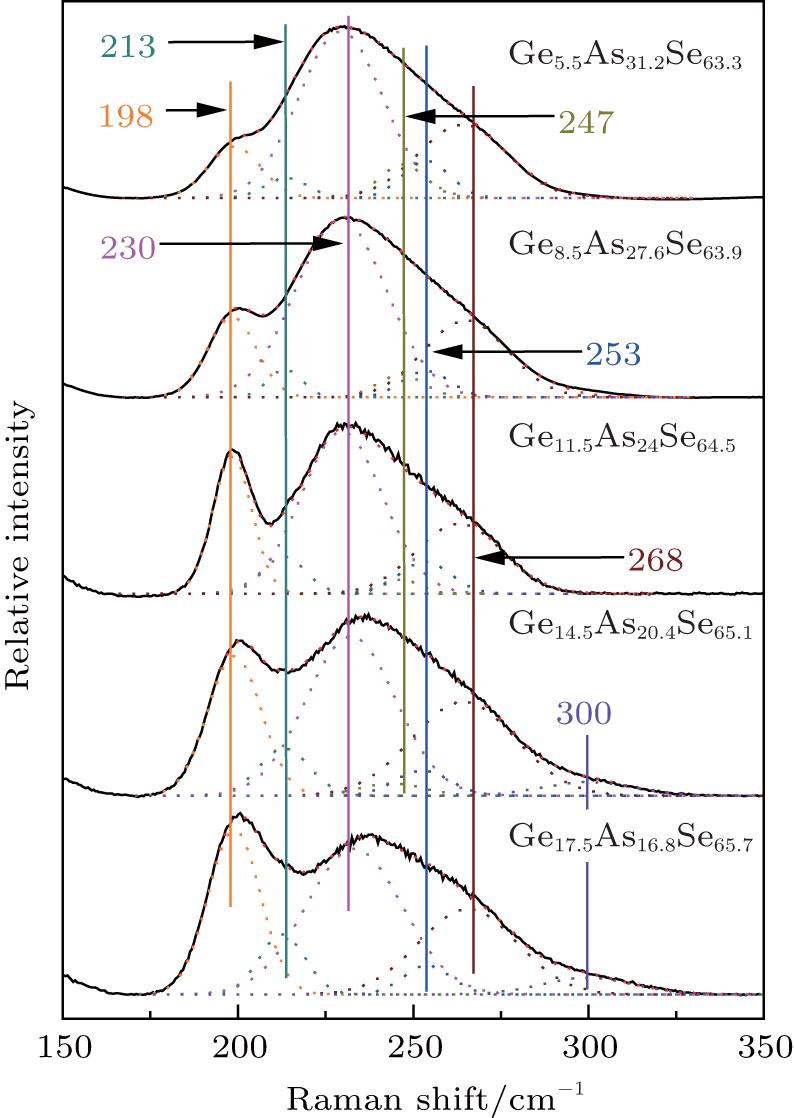
Figures
 | Fig. 1. Raman spectra of the 5.5 mol% Se-rich glasses with different chemical compositions and their decompositions. |
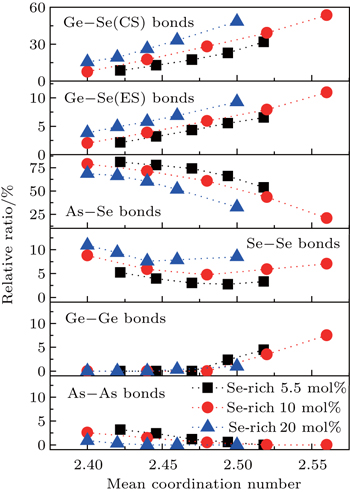
The relative ratio of the integrated area of each decomposed peak to that of the whole area of Raman spectra as a function of MCN is plotted in Fig.
For the evolution of the chemical bonds in Fig.
 | Fig. 2. (a) Raman spectra of the 10 mol% Se-rich glasses with different chemical compositions and their decompositions. (b) Raman spectra of the 20 mol% Se-rich glasses with different chemical compositions and their decompositions. |
 | Fig. 3. Relative number of the chemical bonds derived from the simulation of each Raman spectrum according to the area under each fitted peak in ratio to the total area under the spectrum. |
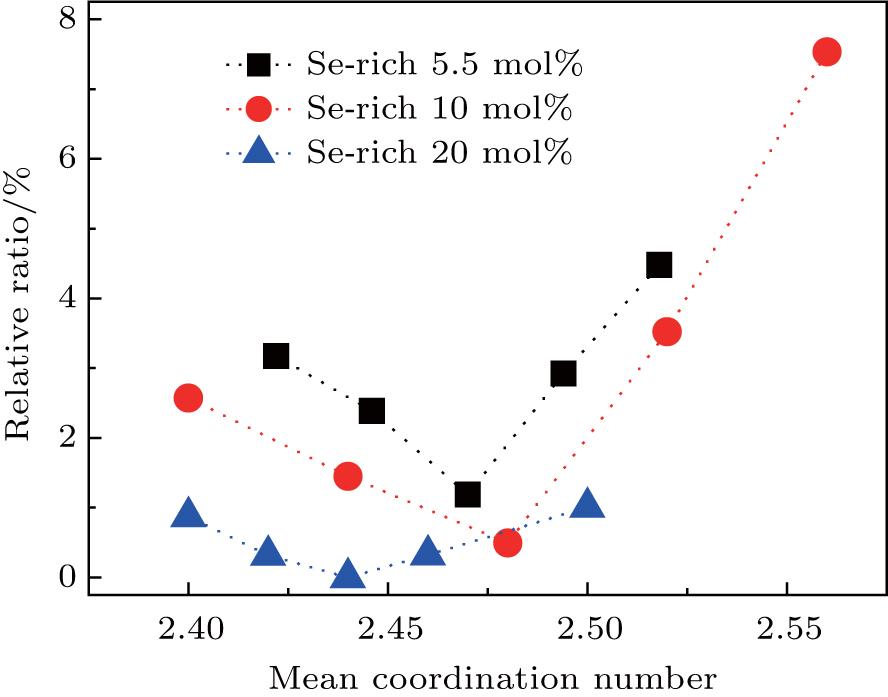 | Fig. 4. Total number of Ge–Ge and As–As homopolar bonds as a function of MCN derived from the sum of the areas under the Ge–Ge and As–As fitted Raman peaks in ratio to the total spectral area. |
Our results also reinforce the previous evidence from thermal kinetics that Ge11.5As24Se64.5 has the minimum fragility index and thus should be most stable against relaxation.[9] In fact, thermal and optical annealing of Ge–As–Se thin films have confirmed that the refractive index and the optical bandgap are almost constant under long time thermal annealing or irradiation by subbandgap light,[11,12] whilst our earlier work on film-forming properties suggested that this composition could be evaporated to create films with chemical bonding indistinguishable from the bulk glass.[11] However, the Ge–Ge and As–As bonds are not eliminated for this composition and hence the optical losses would be expected to be significant. Nevertheless, the favorable film-forming properties of this composition make it a good choice for planar waveguides where the interaction pathways are generally short (cm) and hence the intrinsic material losses are generally less important than the fabrication losses associated with factors such as waveguide side-wall roughness. Thus, for waveguide applications, it is more important to have a glass with a stable structure and hence stable optical properties. In fact, the glass with this composition has been successfully used in various optical devices and the stable performance of the devices has been demonstrated.[6,14]
We have prepared three groups of Ge–As–Se glasses in which Se is 5.5 mol%, 10 mol%, and 20 mol% rich, respectively. Thermal kinetics analysis of the fragility indicated that the 5.5 mol% Se-rich Ge11.5As24Se64.5 glass exhibits the minimum fragility and thus is most stable against structural relaxation. Analysis of the results through decomposing the Raman spectra into different structural units showed that the minimum number of the Ge–Ge and As–As homopolar bonds can be found in Ge15As14Se71 glass but these homopolar bonds can never be completely suppressed. The glasses with low fragility, the minimum number of homopolar bonds, and thus lowest optical loss are promising for applications in photonics.
| 1 | |
| 2 | |
| 3 | |
| 4 | |
| 5 | |
| 6 | |
| 7 | |
| 8 | |
| 9 | |
| 10 | |
| 11 | |
| 12 | |
| 13 | |
| 14 | |
| 15 | |
| 16 | |
| 17 | |
| 18 | |
| 19 | |
| 20 | |
| 21 | |
| 22 | |
| 23 | |
| 24 | |
| 25 | |
| 26 | |
| 27 | |
| 28 | |
| 29 | |
| 30 |