Lasing dynamics study by femtosecond time-resolved fluorescence non-collinear optical parametric amplification spectroscopy
Dang Wei1, 2, Liao Qing3, Mao Peng-Cheng1, Fu Hong-Bing3, Weng Yu-Xiang1, †,
Key Laboratory of Soft Matter Physics, Institute of Physics, Chinese Academy of Sciences, Beijing 100190, China
Hebei Key Lab of Optic-electronic Information and Materials, College of Physics Science and Technology, Hebei University, Baoding 071002, China
Beijing Key Laboratory for Optical Materials and Photonic Devices, Department of Chemistry, Capital Normal University, Beijing 100048, China


† Corresponding author. E-mail: yxweng@aphy.iphy.ac.cn

Project supported by the National Natural Science Foundation of China (Grant Nos. 20925313 and 21503066), the Innovation Program of Chinese Academy of Sciences (Grant No. KJCX2-YW-W25), the Postdoctoral Project of Hebei University, China, and the Project of Science and Technology Bureau of Baoding City, China (Grant No. 15ZG029).

Abstract
Abstract

Femtosecond time-resolved fluorescence non-collinear optical parametric amplification spectroscopy (FNOPAS) is a versatile technique with advantages of high sensitivity, broad detection bandwidth, and intrinsic spectrum correction function. These advantages should benefit the study of coherent emission, such as measurement of lasing dynamics. In this letter, the FNOPAS was used to trace the lasing process in Rhodamine 6G (R6G) solution and organic semiconductor nano-wires. High-quality transient emission spectra and lasing dynamic traces were acquired, which demonstrates the applicability of FNOPAS in the study of lasing dynamics. Our work extends the application scope of the FNOPAS technique.

1. Introduction

Lasing[1,2] and cooperative emissions (super-radiance[3] and superfluorescence[4,5]) are two types of coherent emissions. Lasing and cooperative emissions all feature a fast decay component in their radiative dynamics.[69] The evolution of emissive state, induced by energy transfer[10] or band gap renormalization,[11] is another important property with coherent emission. With respect to emission spectrum, the evolution of an emissive state would affect peak position and spectral shape. Time-resolved photoluminescence provides information on the radiative dynamics of an excited state directly for coherent emission. Among various time-resolved fluorescence spectroscopies, streak camera and fluorescence up-conversion technique have been extensively utilized in the study of coherent emission. The streak camera can provide an excellent spectrum coverage, but the poor time resolution is beyond one picosecond. Fluorescence up-conversion technique only provides the spectrum coverage of 10–20 nm in the collinear sum-frequency style,[12] while its time resolution is up to the limit of laser pulse duration. Compared to streak camera and fluorescence up-conversion technique, FNOPAS technique combines features of high time resolution and broad spectrum coverage together.

In 2005, Fita reported the first proof-of-principle experiment for FNOPAS.[13] This technique gates fluorescence photons and amplifies them in energy through a non-collinear optical parametric amplification process, which endows the FNOPAS with high sensitivity, broad detection bandwidth, and sub-picosecond time resolution. With the low detection limit, about 19 non-coherent fluorescence photons[14] and a single photon[15] for a coherent light source, have been reported in the condition of 150 fs gating width. With the broad detection bandwidth, the FNOPAS can afford a uniform gain bandwidth of 2500 cm−1 when using a 2-mm-thick β-BaB2O4 (BBO) crystal.[16] Moreover, an intrinsic spectrum correction function can be extracted from the parametric superfluorescence spectrum of FNOPAS.[16] By use of this intrinsic spectrum correction function, distortions of transient fluorescence spectrum are well corrected.

In this letter, the FNOPAS is employed to resolve the lasing process, one type of coherent emissions. First, the lasing from R6G dye solution in micro-cell was measured. The evolution of transient emission spectrum, laser build-up time, and feedback for lasing process were well demonstrated. The lasing dynamics of organic semiconductor nano-wires were also acquired by FNOPAS, including high-quality transient emission spectra and lasing dynamic trace. Our experimental results confirm the applicability of FNOPAS in the study of lasing dynamics.

2. Experimental setup

The R6G ethanol solution (3 × 10⁻³ mol/L) fills a quartz micro-cell with an optical length of 1 mm. Two windows of the micro-cell are parallel to each other. Most stimulated emission photons transmit through the window of micro-cell, while a few of them are reflected by these two windows to undergo multiple gains. 1,4-chloride-2,5-di[4’-(methlthio)styryl-benzene (CDSB) nano-wire is prepared by the solution self-assembly method.[17] In the nano-wire, the CDSB molecules are arranged along the [100] direction to form a monoclinic crystal. The facet of the CDSB nano-wire displays a good rectangular shape (width: W = 1–2 μm; height: H = 0.5–0.8W), and uniformly distributes along the entire length (L) of several to several tens of micrometers. The detailed characterizations of CDSB nano-wire have been provided in Ref. [9]. The CDSB nano-wire and its two facets constitute a Fabry–Pérot microcavity, demonstrated by a set of resonant cavity modes.[9]

The experimental setup for the FNOPAS is schematically shown in Fig. 1. A Ti:sapphire laser provides 150 fs, 300 μJ pulses at 800 nm with the repetition rate of 1 kHz. This fundamental beam is split into two beams with a 1:1 energy ratio. The reflected fundamental beam passes through a delay line, and its beam size is reduced by an inverted telescope consisting of a lens pair L2/L3 with a focal length of +200 mm and −75 mm, respectively. Then this fundamental beam is frequency doubled to 400 nm in a 1-mm-thick β-BaB2O4 (BBO) crystal (θ = 29.2°). This second-harmonic (SH) generation beam works as both a gating pulse and a pump source for the parametric amplification process. While the transmitted fundamental beam drives a home-built non-collinear optical parametric amplifier (NOPA) to deliver 532-nm pulses with horizontal polarization. A band pass filter F1 (central wavelength at 532 nm, band width of 10 nm) is used to constrain the spectrum of 532-nm pulses. After being focused by the lens L1 (f = 75 mm), 532-nm pulses pump the R6G solution. To suppress the triplet population and heat effect, R6G solution is continuously stirred by a tiny magnetic bar during the measurement. The emission of R6G solution is collected and imaged onto a 2-mm-thick BBO crystal (θ = 31.5°) by the lens L5 (f = 38.1 mm). A 550-nm-long pass band filter (F2) is placed to remove the scattered light from 532-nm excitation pulses. The emission of R6G solution is gated and amplified through the non-collinear optical parametric amplification process in the BBO crystal, then is recorded as the transient emission spectrum or lasing dynamic trace of a given wavelength, respectively, by choosing CCD detector or Si photodiode detector. The detailed description of the FNOPAS technique has been reported in Ref. [18]. For CDSB nano-wires, the SH of the fundamental beam is used as excitation pulses. The emission from nano-wires is collected in a backward way. To suppress the thermal active quenching and photo-oxidation process, the CDSB nano-wire ensemble is fixed in a nitrogen cryostat (Oxford Instrument, OptistatDN2) of 77 K.

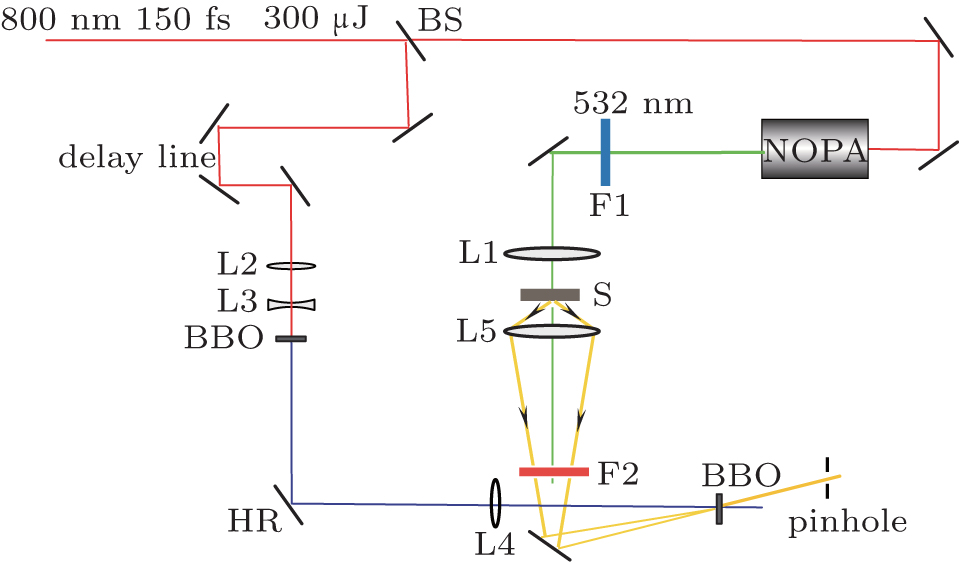
Fig. 1. Setup of femtosecond time-resolved fluorescence non-collinear optical parametric amplification spectroscopy. BS: beam splitter; L1–L5: plano-convex lens; F1–F2: filter; S: sample; HR: high reflective mirror at 400 nm; NOPA: non-collinear optical parametric amplifier.
3. Results and discussion

The time integrated emission spectrum of R6G solution displays a pump energy dependence, shown in Fig. 2. Under low pump energy of 300 nJ per pulse, the time integrated emission spectrum features a broad spontaneous emission spectrum of Rhodamine 6G, peaked at 564 nm. When the pump energy increases to 460 nJ per pulse, a narrow peak superimposes on the broad spontaneous emission spectrum. This narrow peak implies that the stimulated emission (SE) process occurs. With respect to the peak of spontaneous emission spectrum, the SE peak has a 6 nm blue shift, indicating that the SE process occurs on a short timescale before the relaxation of excited electrons to the bottom of the excited electronic state.[19] As the pump energy further increases to 500 nJ pe pulse, more excited molecules are depopulated through the SE process, resulting in the increase of spectral weight of SE peak in the whole emission spectrum. When the pump energy increases to 800 nJ per pulse, the SE peak dominates the emission spectrum of R6G solution. In this case, the SE peak shifts further to 556 nm, and its spectral width decreases to about 5 nm (full width at half maximum).

Fig. 2. Time integrated emission spectra of R6G solution under four different pump energies: 300, 460, 500, 800 nJ per pulse. In the case of 800 nJ per pulse, the spectral intensity is scaled for comparison.

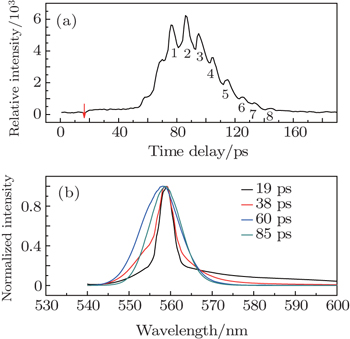
The lasing from R6G solution, under the pump energy of 800 nJ per pulse, was measured by the FNOPAS technique, shown in Fig. 3. When optically pumped by 800 nJ per pulse, R6G solution works in the gain switch mode. In this mode the pumping pulse is so fast that the population of excited molecules and hence the gain reach a value considerably high before the number of photons has time to build up to a sufficiently high level to deplete the excited molecule population.[20] The lasing emission starts at the time delay of 18 ps, being marked up by a red arrow on the lasing dynamic trace of 556 nm (see Fig. 3(a)). At first, photons in the micro-cell are very few, and the spontaneous emission is the main decay channel of excited molecules. Meanwhile, lasing emission intensity experiences a slowly increasing plateau till the time delay of 53 ps. Now the photon number in the micro-cell is so high that the SE process is the main decay channel of excited molecules. Following the fast population decay of excited molecules, photons in the micro-cell start to increase significantly, forming the rising phase of the lasing dynamic trace (see Fig. 3(a)). At the time delay of about 86 ps, the lasing emission intensity reaches the maximum, then starts to decrease, and ends at the time delay of about 200 ps. The entire lasing dynamic trace forms a Gaussian-function-like shape, and obviously deviates from the normal spontaneous emission decay of R6G which can be well fitted by a mono-exponential decay function with a time constant of 2.5 ns (lifetime of excited electronic state).[18] The laser build-up time is defined as the time interval between the lasing starting time and the time of intensity maximum. According to the lasing dynamic trace, we can estimate the laser build-up time as 68 ps for R6G solution under the pump energy of 800 nJ per pulse.

Corresponding to the lasing dynamic trace (Fig. 3(a)), some transient emission spectra of R6G solution are presented in Fig. 3(b). At the time delay of 19 ps, the transient emission spectrum exhibits a superimposition of spontaneous emission and SE peak at 558 nm. As the time delay increases (38, 60, 85 ps), the relative spectral intensity above 567 nm decreases continuously, indicating the weight reduction of spontaneous emission in the whole spectrum.

More interestingly, there are eight peaks on the lasing dynamic trace (labeled with arabic number 1–8, at 76.5, 86.3, 95.1, 104.6, 114.6, 125.4, 134.6, 143.9 ps, see Fig. 3(a)). Time intervals between these peaks are nearly the same, with an average value of 9.6 ps. Taking the cavity length as 1 mm and group velocity refractive index of ethanol at 556 nm as 1.383,[21] the photon round-trip time in the micro-cell is calculated as 9.2 ps. This photon round-trip time approximately matches the average time interval of 9.6 ps. Here our calculation takes the optical length as 1 mm. The actual optical length may be longer than 1 mm due to the fabrication error of the micro-cell. Thus, the average time interval of 9.6 ps can be viewed as the photon round-trip time in the micro-cell. Then peaks on the lasing dynamic trace in Fig. 3(a) represents lasing emissions after photons’ one round-trip within the micro-cell. These peaks also provide the direct evidence of the feedback from the micro-cell for the lasing process.

Fig. 3. The lasing dynamic trace (556 nm) of R6G solution under the pump energy of 800 nJ per pulse (a) and its transient emission spectra (b).

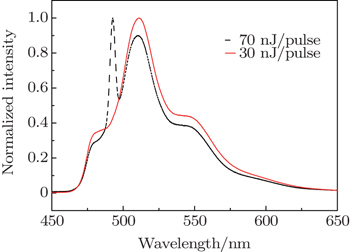
The above analyses have demonstrated the good performance of FNOPAS on the study of lasing from R6G solution. Now we extend the application of FNOPAS to the lasing dynamics of CDSB nano-wires. The spectral shape of CDSB nano-wires also depends on the pumping energy. Under weak pump energy (30 nJ per pulse), emission spectrum features the spontaneous emission (Fig. 4, red solid line). Under the high pump energy (70 nJ per pulse), an SE peak at 492 nm superimposes the emission spectrum of CDSB nano-wires (Fig. 4, black dashed line). This SE peak has an 18 nm blue shift with respect to the peak of spontaneous emission at 510 nm. The blue shift of SE peak suggests that the SE process occurs on timescales comparable to or faster than exciton energy migration.[22]

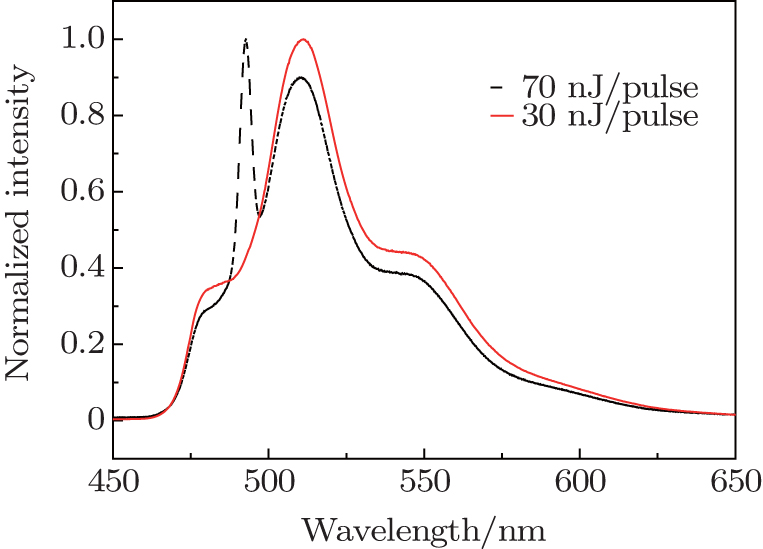
Fig. 4. Normalized time integrated emission spectrum of CDSB nano-wires at 77 K.

Under the pump energy of 100 nJ per pulse, transient emission spectra and lasing dynamic trace of CDSB nano-wires were measured (Fig. 5). The lasing from nano-wires starts at the time delay of 1.7 ps, labeled by a red arrow on the lasing dynamic trace in Fig. 5(a). After the optical pump, the emission from nano-wires is dominated by a broad spontaneous emission, then rapidly evolves to a sharp SE peak at 492 nm, which means that exciton population is mainly depleted by the SE process (Fig. 5(b)). The lasing dynamics of CDSB nano-wire laser also features a Gaussian-function-like shape and an elongated rising phase, and is obviously different from the normal emission decay trace of CDSB nano-wires (inset of Fig. 5(a)). Under the pump energy of 30 nJ per pulse, two lifetimes 16 ps (τ1) and 470 ps (τ2) can be extracted from the emission decay of CDSB nano-wires. The 16 ps lifetime is induced by the bi-molecule quenching process,[9] and 470 ps represents radiative recombination lifetime. According to the lasing dynamic trace of CDSB nano-wires, the laser build-up time can be determined as 4 ps, being much shorter than that of R6G solution (68 ps). Compared with R6G solution in micro-cell, the CDSB nano-wire has a much larger stimulated emission cross-section and a shorter cavity length. Under high pump energy, the increasing rate of photon number in the CDSB nano-wire is much higher than that in R6G solution. Correspondingly, the laser build-up time of CDSB nano-wires would be much shorter than that of R6G solution.

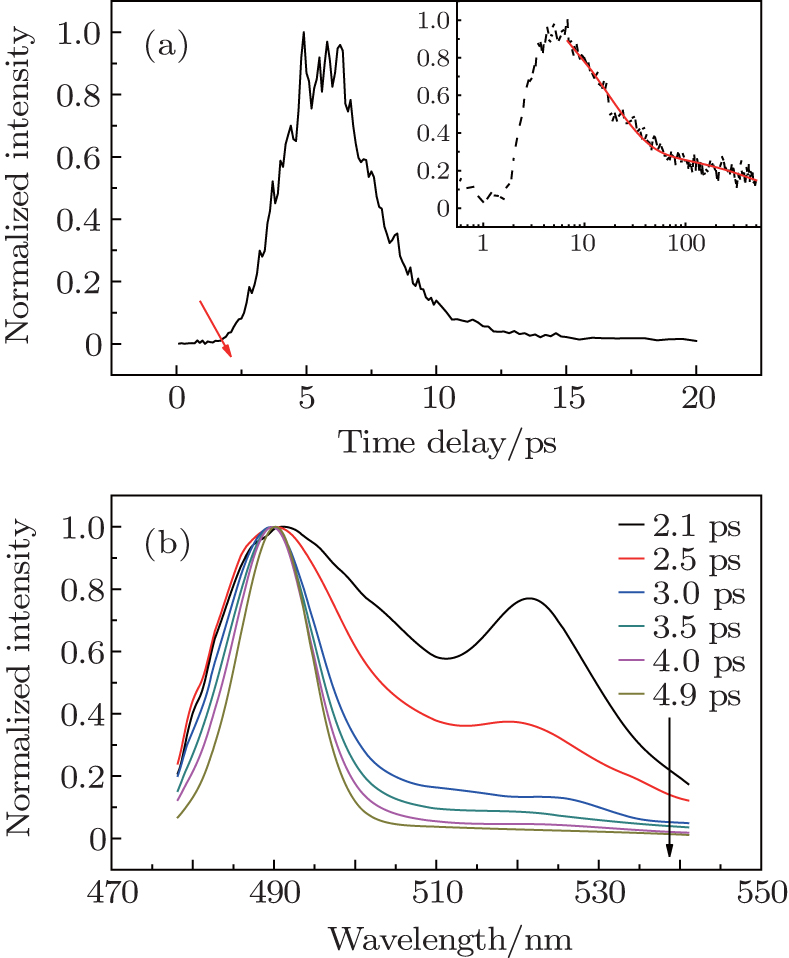
Fig. 5. (a) The lasing dynamic trace (492 nm) of CDSB nano-wires. Inset: emission decay trace of CDSB nano-wires at 492 nm under the pump energy of 30 nJ per pulse (black dashed line) and its fitting (red solid line). (b) Transient emission spectra from CDSB nano-wires under the pump energy of 100 nJ per pulse (arrow direction represents the increase of time delay).

Under the pump energy of 100 nJ per pulse, the lasing dynamic trace of CDSB nano-wires also exhibits some peaks (Fig. 5(a)). The experimental system noise is excluded as the origin of these peaks by use of a second order differential curve of the lasing dynamic trace. We consider the first 10 peaks after the time delay of 2.8 ps. Time intervals between these peaks are approximately equal, and their average value is about 0.4 ps. Even so, we would not assign this 0.4 ps time constant as the photon round-trip time in the nano-wires directly, because the nano-wire ensemble is used in our measurement, where random lasing process, another means of lasing generation, is probably present in the lasing process. Now we can not exclude or evaluate the effect of random lasing process. Hence, it is not justifiable to assign the time constant of 0.4 ps solely to the photon round-trip time in the nano-wires. To exclude the effect of random lasing process, we will make a further measurement on the lasing dynamics of a single nano-wire in our next work.

4. Conclusions

The feasibility of FNOPAS in the study of lasing dynamics was examined in this letter. The evolution of transient emission spectrum, laser build-up time and feedback for lasing process were well demonstrated for R6G solution. Furthermore, lasing dynamics of CDSB nano-wires was also obtained by the FNOPAS. High-quality transient emission spectra and lasing dynamic trace provide access to the analyses of energy transformation in the organic semiconductor nano-wires. Our work suggests that the FNOPAS technique will be a powerful tool in the study of lasing dynamics.

Reference
1Zhang C FDong Z WYou G JQian S XDeng H 2006 Opt. Lett. 31 3345
2Koschorreck MGehlhaar RLyssenko V GSwoboda MHoffmann MLeo K 2005 Appl. Phys. Lett. 87 181108
3Ding C RLin WChen B CZhao F LDong J WShi MWang H ZHsu Y FDjurišić A B 2008 Appl. Phys. Lett. 93 151902
4Ding C RLi Z LQiu Z RFeng Z CBecla P 2012 Appl. Phys. Lett. 101 091115
5Dai D CMonkman A P 2011 Phys. Rev. 84 115206
6Wang H ZZheng X GZhao F LGao Z LYu Z X 1995 Phys. Rev. Lett. 74 4079
7Zhang W LChai LXing Q RWang Q Y 1999 Chin. Phys. Lett. 16 728
8Zhu H MFu Y PMeng FWu X XGong Z ZDing QGustafsson M VTrinh M TJin SZhu X Y 2015 Nat. Mater. 14 636
9Liao QXu Z ZZhong X LDang WShi QZhang CWeng Y XLi Z YFu H B 2014 J. Mater. Chem. 2 2773
10Marciniak HTeicher MScherf UTrost SRiedl TLehnhardt MRabe TKowalsky WLochbrunner S 2012 Phys. Rev. 85 214204
11Song J KWiller USzarko J MLeone S RLi S HZhao Y P 2008 J. Phys. Chem. 112 1679
12Schanz RKovalenko S AKharlanov VErnsting N P 2001 Appl. Phys. Lett. 79 566
13Fita PStepanenko YRadzewicz C 2005 Appl. Phys. Lett. 86 021909
14Weng Y XHan X FZhang J Y 2008 J. Opt. Soc. Am. 25 1627
15Han X FWeng Y XWang RChen X HLuo K HWu L AZhao J M 2008 Appl. Phys. Lett. 92 151109
16Chen H LWeng Y XZhang J Y 2008 J. Opt. Soc. Am. 26 1627
17Xu Z ZLiao QShi QZhang H LFu H B 2012 Adv. Opt. Mater. 24 216
18Dang WMao P CWeng Y X 2013 Rev. Sci. Instrum. 84 073105
19Fang H HChen Q DYang JWang LJiang YXia HFeng JMa Y GWang H YSun H B 2010 Appl. Phys. Lett. 96 103508
20Svelto O2010Principles of Lasers4th edn.New YorkSpringer337338337–8
21Kedenburg SVieweg MGissibl TGiessen H 2012 Opt. Mater. Express 2 1588
22Hide FSchwartz B JDíaz-García M AHeeger A J 1997 Synth. Met. 91 35