Coulomb explosion of CS2 molecule under an intense femtosecond laser field
Wang Xiao1, Zhang Jian1, Zhang Shi-An1, 2, †, , Sun Zhen-Rong1
State Key Laboratory of Precision Spectroscopy, East China Normal University, Shanghai 200062, China
NYU-ECNU Institute of Physics at NYU Shanghai, Shanghai 200062, China


† Corresponding author. E-mail: sazhang@phy.ecnu.eddu.cn

Project supported by the National Natural Science Foundation of China (Grant Nos. 51132004 and 11474096), and the Science and Technology Commission of Shanghai Municipality, China (Grant No. 14JC1401500). We acknowledge the support of the NYU-ECNU Institute of Physics at NYU Shanghai, China.

Abstract
Abstract

We experimentally demonstrate the Coulomb explosion process of CS2 molecule under a near-infrared (800 nm) intense femtosecond laser field by a DC-sliced ion imaging technique. We obtain the DC-sliced images of these fragment ions S+, S2+, CS+, and CS2+ by breaking one C–S bond, and assign their Coulomb explosion channels by considering their kinetic energy release and angular distribution. We also numerically simulate the dissociation dynamics of parent ions by a Coulomb potential approximation, and obtain the time evolution of Coulomb energy and kinetic energy release, which indicates that the dissociation time of parent ions decreases with the increase of the charge number k. These experimental and theoretical results can serve as a useful benchmark for those researchers who work in the related area.

1. Introduction

With the dramatic development of ultrashort laser technique in the past few decades, the ultrashort intense laser field has brought out some unprecedented physical phenomena, such as multi-photon ionization (MPI),[13] enhanced ionization (EI) or charge-resonance enhanced ionization (CERI),[49] above-threshold ionization (ATI),[10] dissociative ionization,[1114] Coulomb explosion (CE),[1523] and so on. As is well known, when the laser intensity is up to 1014 W/cm2, the laser field magnitude is comparable to the Coulomb field generated by an atomic nucleus, the molecular geometry structure can be modified, and thus the molecular chemical bond will be broken by the strong Coulomb repulsive force. Several experimental results indicated that the chemical bond will be stretched from the equilibrium nuclear distance (Re) in the neutral molecule to a critical distance (Rc), and the CE process occurs at this critical distance.[6,2328] Schmidt et al.[29] explained this phenomenon on the basis of a laser-induced stabilization, and found that the bond elongation is mainly determined by the molecule itself. Based on this viewpoint, Corkum et al.[4] proposed a theoretical model of laser-induced electron localization enhanced ionization, which concluded that the ionization of the parent ion will be dramatically enhanced around the critical distance Rc since the electron can directly tunnel through the narrow internal barrier to the continuum. Similarly, Bandrauk et al.[5,6] presented a charge resonance enhanced ionization model, and showed that the enhanced ionization probability at the critical distance Rc is attributed to the transitions between a pair of charge-resonant states that are strongly coupled to the laser field.

As a prototypical linear triatomic molecule, the photoionization and photodissociation of CO2 and CS2 molecules under the intense femtosecond laser fields have been extensively studied. As a representative study of the CO2 molecule, Wu et al.[30,31] studied the three-body fragmentation dynamics of CO2 molecule in intense laser fields by using a triple ion coincidence technique, and showed that the geometric structure of before fragmentation is close to that of neutral CO2, and both the sequential and non-sequential fragment processes can occur in the parent ions while the parent ions can only produce the non-sequential fragment process. In the studies of the CS2 molecule, Graham et al.[32] measured the angular distributions of those fragment ions from the CE process of parent ions, and found that the distribution of fragment ions Sm+ is perpendicular to that of fragment ions Cn+. Mathur et al.[33] defined CS2 molecule as the boundary between a “heavy” molecule (like I2 or its derivatives) and a “light” molecule (like H2 or N2), and showed that the geometric alignment mechanism dominates for the 100-fs laser pulses, while dynamic alignment occurs for the 35-ps laser pulses. Yamanouchi et al.[1820] utilized a triple coincidence momentum imaging technique to study both sequential and non-sequential three-body CE processes, i.e., and demonstrated that the significant structural deformation occurs for along both bending and stretching coordinates. In previous studies, this coincidence measurement technique can identify a specific single event of Coulomb explosion from a single parent ion, but it has relatively high requirement for the chamber vacuum pressure and sample vapor temperature. Recently, the DC-sliced ion imaging technique has shown to be a well-established tool to study the molecular photoionization and photodissociation process, where both the speed and angular distributions of the produced ions can be directly measured without any mathematical transformation, and so can provide a more intuitive method. In this paper, we experimentally investigate the CE process of CS2 molecule under an intense near-infrared (800 nm) femtosecond laser field by the DC-sliced ion imaging technique. The DC-sliced images of four ions S+, S2+, CS+, and CS2+ by breaking one C–S bond are measured, and their Coulomb explosion channels are assigned by calculating kinetic energy release (KER) and their angular distributions are extracted from the DC-sliced images. The dissociation dynamics of parent ions is numerically simulated by using a Coulomb energy approximation, and it is shown that the dissociation time decreases when the charge number increases.

2. Experimental setup

Details of our home-built DC-sliced ion imaging system have been described in our earlier publication,[27] and only a brief description is given here. The CS2 sample (99.9% purity) carried by 1 atm helium gas is expanded adiabatically into the source chamber through a pulsed valve with the repetition rate of 100 Hz, and then skimmed into the high-vacuum main chamber with a base pressure of ∼ 10−8 mbar. The multi-stage ion lens in the main chamber has a similar configuration described by Suits et al.,[34] and the optimized voltages applied on the electrodes are URepeller = 2000 V, U1 = 1760 V, U2 = 1660 V, and U3 = 0 V. The super-sonic molecular beam interacts with the intense femtosecond laser field in the main chamber, and the fragment ions are first accelerated by a multi-lens velocity mapping apparatus and then fly freely to a dual micro-channel plate (MCP) coupled with a P47 phosphor screen. The sliced images of the fragment ions are obtained with an intensified charge-coupled device (ICCD) camera, and the time-of-flight (TOF) mass spectra are achieved by a photomultiplier tube (PMT) connected to a digital oscilloscope. All the timing sequence control is implemented by a digital delay pulse generator (DG535 Stanford Research System).
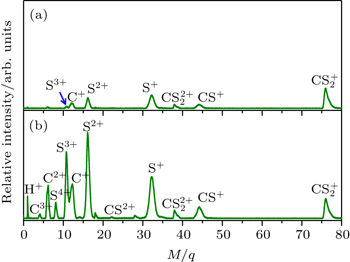
3. Results and discussion

Figure 1 shows two typical TOF mass spectra of CS2 molecule irradiated by the 800-nm femtosecond laser field with a laser central wavelength of 800 nm and the pulse duration of 70 fs for the laser intensity of 4.9 × 10¹³ W/cm2 (see Fig. 1(a)) and 1.3 × 10¹⁴ W/cm2 (see Fig. 1(b)). In our experiment, the laser polarization direction is always perpendicular to the TOF axis. When the laser intensity is set at 4.9 × 10¹³ W/cm2, as shown in Fig. 1(a), these fragment ions C+, Sm+ (m = 1–3), CS+, and can be observed, which indicates that the two C–S bonds can be broken in this lower laser intensity. When the laser intensity is increased to 1.3 × 10¹⁴ W/cm2, as shown in Fig. 1(b), some highly charged fragment ions C2+, C3+ and S4+ appear, which shows that the appearance potential of fragment ion Cm+ is higher than that of fragment ion Sm+ with the same charge number. Generally, the generation of highly charged ions (such as C2+, C3+, S2+, S3+, S4+) indicates the participation of the CE processes in our experiment. In addition to the two parent ions and no other multiply charged parent ions are observed at the full range of our laser intensities, which may be due to the instability of the highly charged parent ions. In this work, we aim to explore the formation mechanism of fragment ions S+, S2+, CS+, and CS2+ by breaking one C–S bond.

Fig. 1. The TOF mass spectra of CS2 molecule irradiated by 800 nm femtosecond laser pulses with a laser intensity of 4.9 × 10¹³ (a) and 1.3 × 10¹⁴ W/cm2 (b).

When the polyatomic molecules are subjected to an intense femtosecond laser field, the fragment ions can be produced from different photoionization and photodissociation channels. With the help of DC-sliced image technique, we can clearly discriminate these different dissociative ionization channels of the fragment ions with same mass-to-charge ratio. Figure 2 presents the pseudo-color DC-sliced images of fragment ions S+, S2+, CS+, and CS2+. One can see that each fragment ion involves more than one dissociative ionization channel. Usually, the fragment ions with high KER should result from the CE process, while those with low KER should result from the multi-photon dissociative ionization process. Here we focus on the CE process of the four fragment ions. As is well known, in the two-body CE model, the two partner ions should meet with the momentum conservation condition. In other words, the KERs of the two fragments should satisfy the following relationship:[27,35,36]

where X and Y represent the partner fragment ions, M is the mass of corresponding fragment ions, and p, q are charge numbers of the two fragment ions. Figure 3 shows the velocity distributions of the four fragment ions S+, S2+, CS+, and CS2+, and the calculated kinetic energies of these different peaks are also labeled. In order to facilitate the discussion below, these peaks from low to high kinetic energy are respectively labeled with the symbols Px (x = 1–3). According to Eq. (1), it can be deduced that P1 peak in the fragment ion S+ and P2 peak in the fragment ion CS+ should come from the two-body CE process,

Applying the same method, P3 peak in the fragment ion S+ and P2 peak in the fragment ion CS2+ can be assigned to the two-body CE process,

while the P1 peak in the fragment ion S2+ and P3 peak in the fragment ion CS+ can be attributed to such a two-body CE process,

Similarly, the P2 peak in the fragment ion S2+ and P3 peak in the fragment ion CS2+ can be verified as the two-body CE process below,

However, we cannot find a corresponding peak in Fig. 3 to match P3 peak in fragment ion S2+, whose partner ion might experience further dissociation or CE process.

Table 1 lists the mass ratio M(CSq+)/M(Sp+), KER ratio (Sp+)/KER(CSq+), and relative experimental error Δ. Considering the experimental condition and data processing, if the experimental error Δ is less than 5%, the above listed channel assignments are considered to be correct. As can be seen, both the channels (1,2) and (2,1) result from the CE process of parent ion but their total KERs are different, which can come from the different precursor states. In addition, there is a spot in the central position for the fragment ions S+ and CS+, which can be assigned to the (1,0) and (0,1) dissociative ionization channels of parent ion Here, we do not discuss this dissociation process since our focus is the CE process.

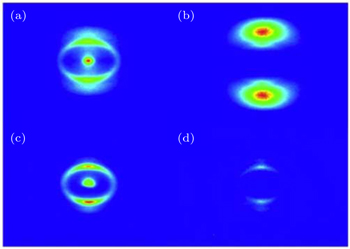
Fig. 2. The pseudo-color DC sliced images of fragment ions S+ (a), S2+ (b), CS+ (c), and CS2+ (d) with the laser intensity of 1.5 × 10¹⁴ W/cm2.
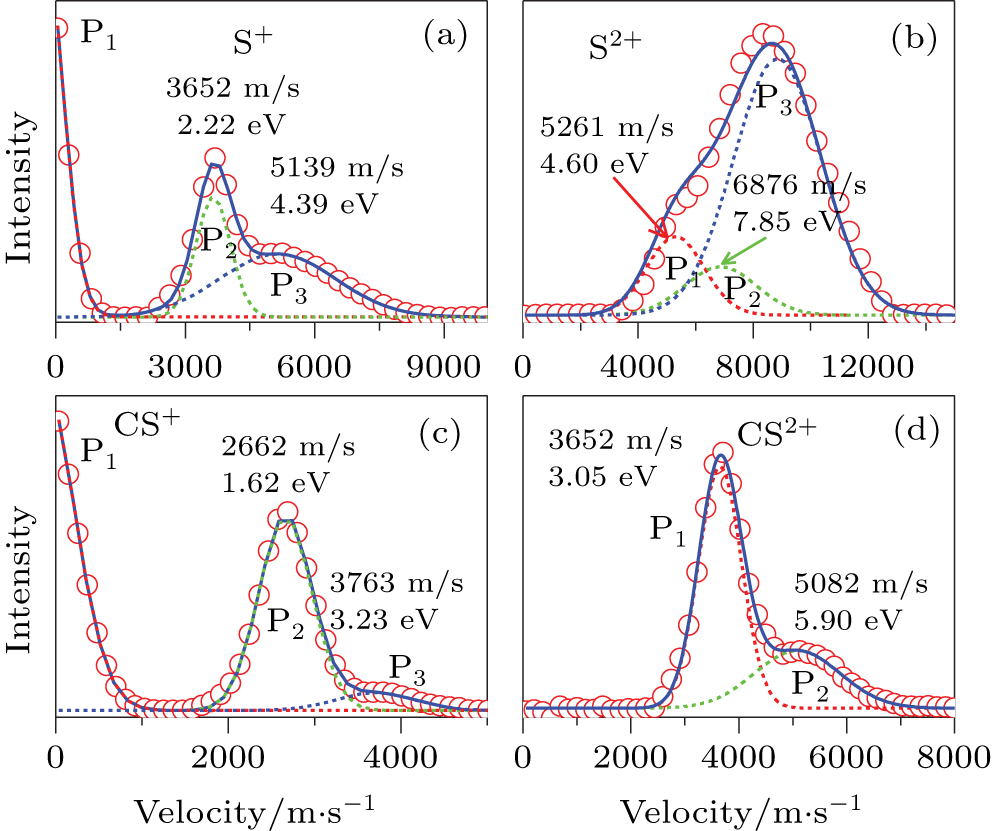
Fig. 3. The velocity distributions of fragment ions S+ (a), S2+ (b), CS+ (c), and CS2+ (d). The red circles are the experimental data, and the blue solid lines are the simulated results by the multiple Gaussian functions.
Table 1.

Mass ratio (Ratio1), KER ratio (Ratio2), and relative error for the four CE channels.

.

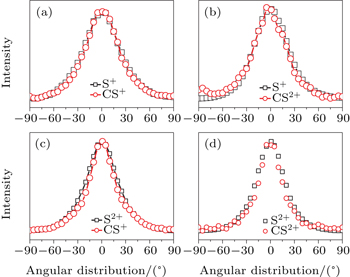
In addition to the KER distribution, the angular distribution of fragment ions also plays an important role in assigning the dissociation channels. The two fragment ions from the same dissociation channel should have the similar angular distribution. Figure 4 presents the angular distributions of four pairs of fragment ions mentioned above. As expected, each pair of fragment ions has a similar angular distribution, which can further verify the above CE channel assignments. Furthermore, one can see that the fragment ions that result from the dissociation process of the higher parent ions will show a narrower angular distribution.

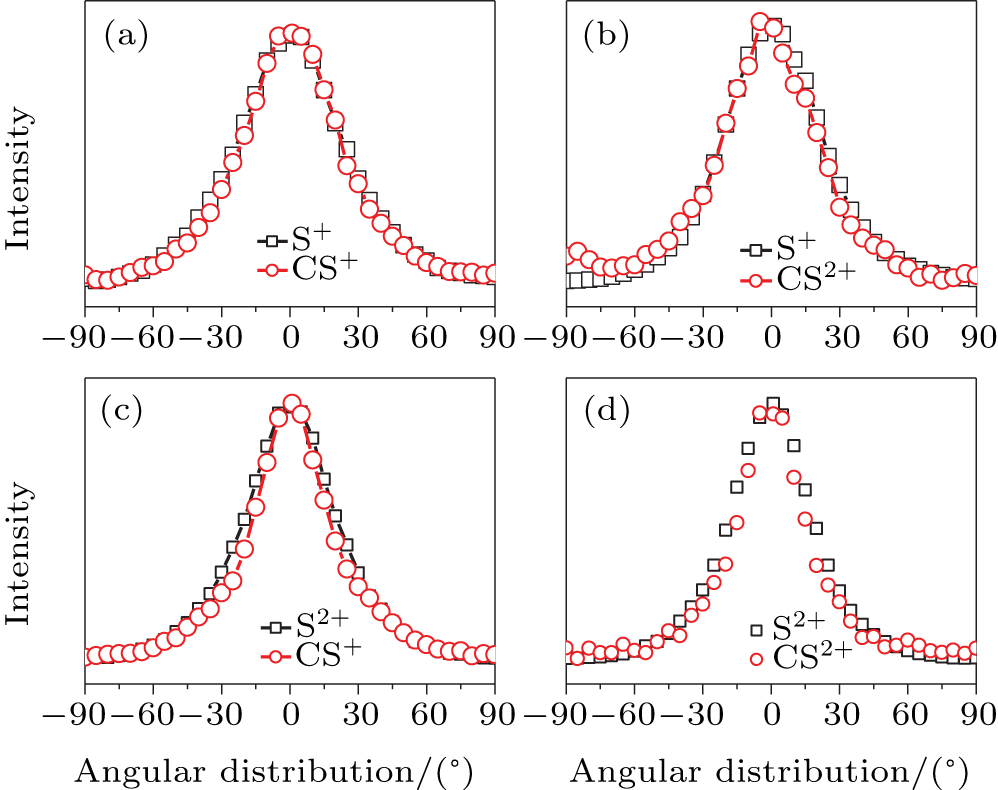
Fig. 4. The angular distributions of the two fragment ions that correspond to the four CE channels (1, 1) (a), (1,2) (b), (2,1) (c), and (2,2) (d).

It has been proved that the total KER Etotal from the CE process and the critical distance Rc should satisfy the following relationship:[23,26]

The calculated Rc values for the four channels are also shown in Table 1. It can be found that the chemical bond fusion in all these channels takes place at the critical distance Rc between 3.66 and 4.19 Å, which is about 2.3–2.7 times longer than the equilibrium distance of C–S bond (1.56 Å). It is noted that the bond elongation is larger for the parent ion with a larger charge number, and this phenomenon has been observed in diatomic and triatomic molecules.[3741] The bond elongation has been explained by an enhanced ionization at a critical distance Rc where the ionization rate would be greatly enhanced, and the intense Coulomb repulsive energy will lead to the dramatic fragmentation process by converting the Coulomb energy into the KERs of the two separated fragment ions.[46]

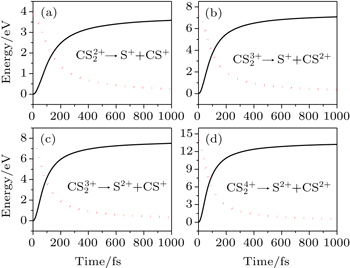
To better understand this energy conversion process, we use a Coulomb potential approximation to theoretically simulate the dissociation process of parent ions, and here the doubly charged parent ion is used as an example for detailed illustration. Assuming that the initial momentum of fragment ions S+ and CS+ are both zero, the critical distance Rc of parent ion is known as 3.75 Å, and the two fragment ions S+ and CS+ move along the Coulomb potential. Here, we introduce the Hamiltonian in the center-of-mass coordinate system as follows:

where K = 1/4πɛ0, and subscript 1 and 2 represent the two fragment ions S+ and CS+, respectively. By simplifying, equation (7) can be further written as follows:[28]

with the initial conditions,

In our simulation, equation (8) is solved numerically, and the time evolution of Coulomb energy and KERs in the above four channels can be obtained, as shown in Fig. 5. Obviously, the Coulomb energy dramatically decreases while KER accordingly increases for all these channels. In order to intuitively understand the energy conversion, the time requirements for different percentages of Coulomb energy to KERs in each channel are listed in Table 2. We assume that the time requirement for the energy conversion percentage of 90% is defined as the dissociation time of the parent ion,[28] which means that the C–S bond is completely broken and the parent ion dissociates into two fragment ions Sp+ and CSq+ within that time, and thus the dissociation time of these parent ions (channel (1, 1)), (channel (1, 2)), (channel (2, 1)), and (channel (2, 2)) are about 666, 498, 456, and 396 fs, respectively. It is noteworthy that the time requirement for the dissociation becomes shorter with the increase of the charge number of the parent ion. That is to say, the higher charge number will yield the stronger Coulomb repulsive force, which will accelerate the Coulomb explosion and quickly dissociate into fragmentation ions, and so the higher KER and narrower angular distribution of the fragment ions will be observed. This gives a good explanation for the experimental observation in Figs. 3 and 4 that the fragment ions with the higher KER and narrower angular distribution come from the higher parent ions. Moreover, the change tendency of the dissociation time can help us understand why no highly charged parent ions are observed in our experiment, as shown in Fig. 1.

Fig. 5. The time evolution of Coulomb energy (red dotted lines) and KER (black solid lines) for the four CE channels (a), (b), (c), and (d).
Table 2.

Time requirement for different percentages of Coulomb energy to KERs in the four CE channels.

.
4. Conclusions

In summary, the CE process of CS2 molecule under the near-infrared (800 nm) intense femtosecond laser field has been experimentally investigated with a DC-sliced ion imaging technique. The CE channels of fragment ions S+, S2+, CS+, and CS2+ by breaking one C–S bond were confirmed by calculating their corresponding velocity distribution and angular distribution. The Coulomb explosion process of highly charged parent ions was theoretically simulated by using a Coulomb potential approximation. It was shown that the chemical bond break occurred at a critical distance, and the dissociation time of parent ion decreased with the increase of the charge number due to the stronger Coulomb repulsive force, and the theoretical result gave a good explanation as to why the measured KER in the experiment was much smaller than the theoretical calculation and the fragment ions from the higher parent ions showed a higher KER and narrower angular distribution. We believe that these experimental and theoretical results will be very useful for further understanding the CE process of polyatomic molecule under the intense femtosecond laser field.

Reference
1Vijayalakshmi KSafvan C PKumar G RMathur D 1997 Chem. Phys. Lett. 270 37
2Castillejo MCouris SKoudoumas EMartin M 1998 Chem. Phys. Lett. 289 303
3Sakai HStapelfeldt HConstant EIvanov M YMatusek D RWright J SCorkum P B 1998 Phys. Rev. Lett. 81 2217
4Seideman TIvanov M YCorkum P B 1995 Phys. Rev. Lett. 75 2819
5Zuo TBandrauk A D 1995 Phys. Rev. 52 R2511
6Bandrauk A DLu H Z 2000 Phys. Rev. 62 053406
7Banerjee SKumar G RMathur D 1999 Phys. Rev. 60 R25
8Bryant W ASanderson J HEl-Zein ANewell W RTaday P FLangley A J 2000 J. Phys. B: At. Mol. Opt. Phys. 33 745
9Sabzyan HVafaee M 2005 Phys. Rev. 71 063404
10Agostini PFabre FMainfray GPetite GRahman N K 1979 Phys. Rev. Lett. 42 1127
11Roeterdink W GJanssen M H M 2002 Phys. Chem. Chem. Phys. 4 601
12Wang Y MZhang SWei Z RZhang B 2009 Chem. Phys. Lett. 468 14
13Rosca-Pruna FSpringate EOfferhaus H LKrishnamurthy MFarid NNicole CVrakking M J J 2001 J. Phys. B: At. Mol. Opt. Phys. 34 4919
14Beylerian CCornaggia C 2004 J. Phys. B: At. Mol. Opt. Phys. 37 L259
15Cornaggia CSchmidt MNormand D 1994 J. Phys. B: At. Mol. Opt. Phys. 27 L123
16Wright J SDiLabio G AMatusek D RCorkum P BIvanov M YEllert CBuenker R JAlekseyev A BHirsch G 1999 Phys. Rev. 59 4512
17Tzallas PKosmidis CPhilis J GLedingham K W DMcCanny TSinghal R PHankin S MTaday P FLangley A J 2001 Chem. Phys. Lett. 343 91
18Hasegawa HHishikawa AYamanouchi K 2001 Chem. Phys. Lett. 349 57
19Hishikawa AHasegawa HYamanouchi K 2002 Chem. Phys. Lett. 361 245
20Hishikawa AHasegawa HYamanouchi K 2004 Chem. Phys. Lett. 388 1
21Sun S ZYang YZhang JWu HChen Y TZhang S AJia T QWang Z GSun Z R 2013 Chem. Phys. Lett. 581 16
22Wu HYang YSun S ZZhang JDeng LZhang S AJia T QWang Z GSun Z R 2014 Chem. Phys. Lett. 607 70
23Zhang JZhang S AYang YSun S ZLi JChen Y TJia T QWang Z GKong F ASun Z R 2014 Phys. Rev. 90 053428
24Constant EStapelfeldt HCorkum P B 1996 Phys. Rev. Lett. 76 4140
25Bandrauk A DMusaev D GMorokuma K 1999 Phys. Rev. 59 4309
26Wang CDing DOkunishi MWang Z GLiu X JPrümper GUeda K 2010 Chem. Phys. Lett. 496 32
27Yang YFan L LSun S ZZhang JChen Y TZhang S AJia T QSun Z R 2011 J. Chem. Phys. 135 064303
28Wu CZhang G QWu C YYang Y DLiu X RDeng Y KLiu HLiu Y QGong Q H 2012 Phys. Rev. 85 063407
29Schmidt MNormand DCornaggia C 1994 Phys. Rev. 50 5037
30Wu CWu C YSong DSu H MYang Y DWu Z FLiu X RLiu HLi MDeng Y KLiu Y QPeng L YJiang H BGong Q H 2013 Phys. Rev. Lett. 110 103601
31Wu C YWu CFan Y MXie X GWang PDeng Y KLiu Y QGong Q H 2015 J. Chem. Phys. 142 124303
32Graham PLedingham K W DSinghal R PMcCanny THankin S MFang XSmith D JKosmidis CTzallas PLangley A JTaday P F 1999 J. Phys. B: At. Mol. Opt. Phys. 32 5557
33Banerjee SKumar G RMathur D 1999 Phys. Rev. 60 R3369
34Guo CLi MNibarger J PGibson G N 1998 Phys. Rev. 58 R4271
35Wang Y MZhang SWei Z RZhang B 2008 J. Phys. Chem. 112 3846
36Corrales M EGitzinger GVazquez J GLoriot VNalda RBanares L 2012 J. Phys. Chem. 116 2669
37Posthumus J HGiles A JThompson M RCodling K 1996 J. Phys. B: At. Mol. Opt. Phys. 29 5811
38Iwamae AHishikawa AYamanouchi K 2000 J. Phys. B: At. Mol. Opt. Phys. 33 223
39Hishikawa AIwamae AYamanouchi K 1999 Phys. Rev. Lett. 83 1127
40Hishikawa AIwamae AYamanouchi K 1999 J. Chem. Phys. 111 8871
41Iwasaki AHishikawa AYamanouchi K 2001 Chem. Phys. Lett. 346 379