Carrier envelope phase effect on the spatial distribution of high-order harmonic generation in asymmetric molecule
Institute of Atomic and Molecular Physics, Jilin University, Changchun 130012, China
† Corresponding author. E-mail: liuxs@jlu.edu.cn
Project supported by the National Natural Science Foundation of China (Grant Nos. 11271158, 11574117, and 61575077).
1. IntroductionThe laser–matter interaction has been intensively studied both theoretically and experimentally. Based on these studies high-order harmonic generation (HHG) has been considered as an important tool for obtaining coherent attosecond pulses.[1,2] A HHG spectrum has a general feature: it decreases rapidly at the lower-order harmonics, followed by a broad plateau, and finally a sharp cutoff with the maximum cutoff energy Ip + 3.17Up, where Ip is the ionization potential and Up = I2/4ω2 denotes the ponderomotive energy. The semi-classical three-step model can well explain the HHG process.[3,4] First, the electron is ionized by tunneling the potential barrier, then propagates in the external field, and finally it recombines with the ions and emits an energetic photon. Due to the complex molecular structure, more and more researchers are interested in the molecular high-order harmonic generation (MHOHG).[5] On the one hand, much effort has been done to the HHG of the symmetric molecules, such as N2,[6,7]  ,[8–10] and CO2.[11] On the other hand, the investigation of the asymmetric molecule also attracts a great deal of attention, such as CO,[12] HCl,[13] HeH2+,[14,15] which have the permanent dipole of the molecule (PDM) and the multiple centers because of the symmetry breaking.
As the simplest heteronuclear asymmetric molecule HeH2+, the electron is mainly localized on the heavier nuclear, which is different from the case of the symmetric molecule  . The lifetime of excited states of HeH2+ may be comparably longer than atoms or symmetric molecules.[16] For instance, the mean lifetime of the first excited 2pσ state is about 4 ns and the first excited state has a minimum 0.849 eV deep at R = 3.89 a.u.[17] A new approach of asymmetric molecular gating to steer the HHG has been investigated, and the plateau covers a broad bandwidth, which is useful to generate an isolated attosecond pulse.[18] Kamta and Bandrauk[19] investigated the enhanced ionization (EI) in asymmetric molecules and found that EI is much stronger when the electric field at the peak of the pulse is antiparallel to the PDM. Bian and Bandrauk[20] investigated the influence of phase difference of the two-color laser pulses on the MHOHG and multiple cutoff energies are observed. Liu et al.[21] investigated the carrier envelope phase (CEP) effect on different dissociation channels of HeH2+, the upward shift of the localization probability and the suppression of the dissociation channel He2+ + H are observed.
In our previous work,[22] we investigated the spatial distribution in HHG of an  molecule and described the contribution in HHG of the two nuclei in the combination of a Guassian laser field and a static field. In this work, the CEP effect of the spatial distribution in HHG from HeH2+ is investigated by numerically solving the non-Born–Oppenheimer time-dependent Schrödinger equation. The results show that the probability of the electron recombined with the nucleus is different with various CEPs, which means the electronic recombination can be affected by changing the CEP.
2. Theoretical modelThe generation of high-order harmonic from HeH2+ can be investigated by numerically solving the non-Born–Oppenheimer time-dependent Schrödinger equation, which consists of one-dimensional motion of the nuclei and one-dimensional motion of the electron. The initial wave function is obtained by diagonalizing the field-free Hamiltonian under a sine discrete variable representation (DVR).[23] In the dipole approximation and the length gauge, the time-dependent Schrödinger equation can be written as (in atomic units e = me = ℏ = 1)
where
TR = −(1/2
μn)(
∂2/
∂R2) and
Te = −(1/2
μe)(
∂2/
∂z2) present the kinetic energy of the nuclei and the electron.
μn = (
MHeMH)/(
MHe +
MH) and
μe = (
MHe +
MH)(
MHe +
MH + 1) are the reduced masses of nuclei and electron, with
MHe and
MH being the masses of the nuclei He and H, respectively. The “soft-core” Coulomb potential for HeH
2+ is
and the interaction between HeH
2+ and the intense laser field
E(
t) has the form
[24]
where
R is the internuclear distance and
z is the electronic coordinate (with respect to the center of mass of the two nuclei),
CHe and
CH are the electric charges of nuclei,
zHe = −
MHR/(
MHe +
MH) and
zH =
MHeR/(
MHe +
MH) are the positions of He nucleus and H nucleus. We adopt the parameters
a = 0.01 and
b = 0.3 so that the model of HeH
2+ yields the initial state (the 2p
σ state) ionization potential 1.03 a.u. and equilibrium distance 3.89 a.u.,
[24] which is close to the observation in experiment.
[17] The time-dependent wave functions are obtained by using the second-order split-operator fast Fourier transform algorithm.
[25] All the calculations have been performed by using the attosecond resolution quantum dynamics program LZH-DICP.
[26–28] We use a grid range from 0 a.u. to 30 a.u. on the
R axis and from −100 a.u. to 100 a.u. on the
z axis with Δ
R = 0.1 a.u. and Δ
z = 0.2 a.u., respectively. To avoid reflections from boundaries, the absorbing positions of the mask function are 50 and 100 grid points away from the boundaries on the
R axis and
z axis, respectively. The harmonic spectrum is proportional to the modulus squared of the Fourier transform of the dipole acceleration, which is given by
[16]
In this work, we investigate the CEPs effect on the spatial distribution of HHG for HeH2+ in an intense laser field. The dipole acceleration distribution as a function of electronic coordinate z and time can be written as[8,22]
The contribution to HHG from HeH2+ as a function of electronic coordinate z can be demonstrated.
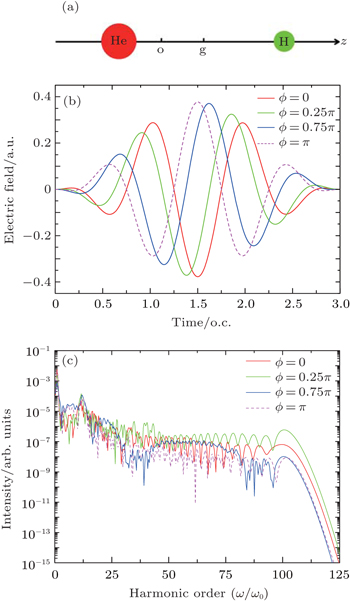
3. Results and discussionWe investigate the high-order harmonic generation of HeH2+ with the laser field E(t, ϕ) = E0f(t)cos(ωt + ϕ). E0, ω, and ϕ are the amplitude, frequency and CEP, respectively. The pulse envelope is given by f(t) = sin2(πt/T) for 0 ≤ t ≤ T. The laser frequency ω = 0.114 a.u. (λ = 400 nm) and the pulse duration T is a 3 optical cycle (o.c.) (4 fs).[14,18] We choose the peak intensity of the laser pulse I = 5 × 10¹⁵ W/cm2 with four representative CEPs ϕ = 0, ϕ = 0.25π, ϕ = 0.75π, and ϕ = π. We set the molecular axis along the z axis as illustrated in Fig. 1(a), where o and g represent the origin (z = 0 a.u.) and geometric center (z = 1.17 a.u.), respectively.
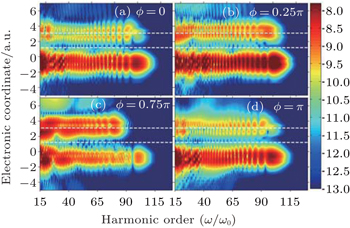
The influence on the linearly polarized few-cycle laser pulse and the HHG of the asymmetric molecule HeH2+ at different CEPs has been shown in Figs. 1(b) and 1(c). Figure 1(c) shows that there is a resonant peak around 12nd harmonics order, which is due to the fact that the electrons populated on the 2pσ state by enhanced excitation may transit back to the ground state and emit photons directly.[20] For ϕ = 0, we can see that there are some modulations in the harmonic spectrum. For ϕ = 0.25π, the harmonic intensity is enhanced with fewer modulations. The harmonics higher than the 50th order form a continuum spectrum. For ϕ = 0.75π, the harmonic intensity becomes a little weaker and the harmonics from 28th–46th and 81st–101st order present the interference effects. The suppression of harmonic emission results in a minimum in the harmonic spectrum.[8] For ϕ = π, the harmonic intensity is at least one order of magnitude lower than that of ϕ = 0.25π. To further investigate the underlying mechanism, the spatial distribution in HHG at different CEPs is shown in Fig. 2.
Figure 2 shows the spatial distribution in HHG at different CEPs, which presents a “fishbone” structure. We can also see that the harmonic cut-off order of the electron recombined with He nucleus is higher than that with H nucleus. This is because the potential well of He nucleus is lower than that of H nucleus, the electron can obtain more energy and generate higher harmonics when it recombines with the He nucleus than that with the H nucleus. Meanwhile, there is little contribution in HHG around the geometric center of two nuclei (z = 1.17 a.u.) and the equilibrium internuclear position of the H nucleus (z = 3.11 a.u.), which is similar to the case of  as demonstrated in Ref. [22]. However, the contribution in HHG around the equilibrium internuclear position of He nucleus (z = − 0.78 a.u.) can also be observed and and the little contribution in HHG is around z = 3.4 a.u. shown in Figs. 2(b) and 2(c), which is slightly higher than the equilibrium internuclear position of H nucleus. These characteristics are attributed to the asymmetric molecular structure which is different from the case of
  as demonstrated in Ref. [22].
For ϕ = 0, figure 2(a) shows that the harmonic intensity of the electron recombined with the He nucleus is stronger than that with the H nucleus. For ϕ = 0.25π, figure 2(b) shows that an overall harmonic intensity of the spatial distribution is enhanced. For ϕ = 0.75π, figure 2(c) shows that the harmonic intensity of the electron recombined with the H nucleus is enhanced, but the harmonic intensity of the electron recombined with the He nucleus is weakened. Then, for ϕ = π, figure 2(d) shows that the harmonic intensity of the electron recombined with the He nucleus is enhanced, but the harmonic intensity of the electron recombined with the H nucleus is weakened. The harmonic intensity of the electron recombined with the He nucleus is the strongest at ϕ = 0.25π and weakest at ϕ = 0.75π, which corresponds to the continuum harmonic spectrum (green solid line) and the harmonic spectrum with interference phenomenon (blue solid line) as shown in Fig. 1(c). It is illustrated that the effect of the electron recombined with the He nucleus is advantageous to the HHG.
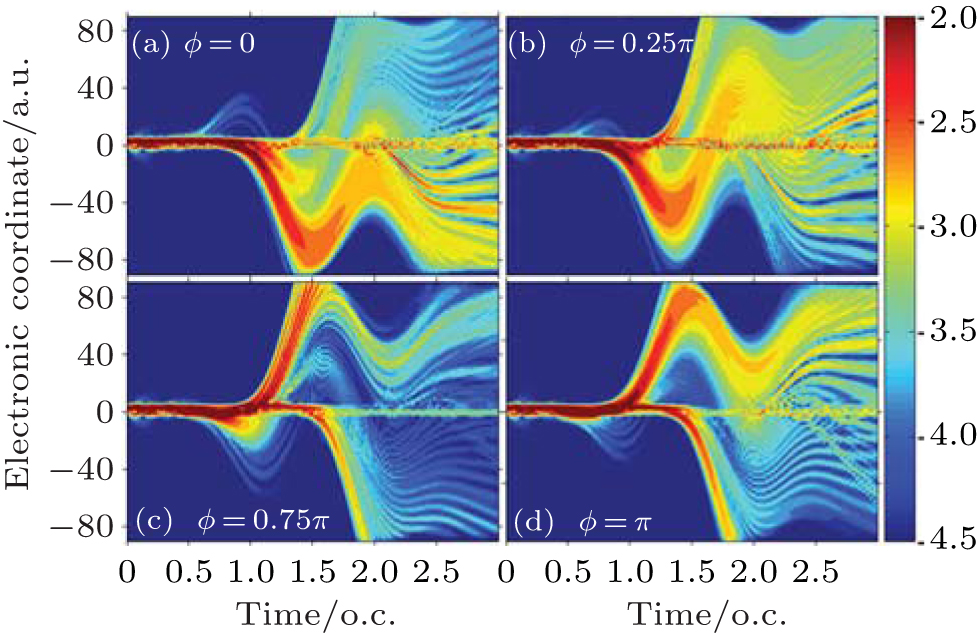
To have further insight into the interaction between the asymmetric molecule HeH2+ and the laser pulse, the time evolution of the electronic density distribution is shown in Fig. 3.
For ϕ = 0, figure 3(a) shows that the electron begins to ionize along the positive z direction around t = 0.64 o.c., and then the ionized electron moved along the positive z direction are gradually pulled back and mainly recollided with the H nucleus. After that, more electrons begin to ionize along the negative z direction around t = 1.0 o.c., and then the ionized electrons moved along the negative z direction are gradually pulled back and mainly recollided with He nucleus in the range from 1.52 o.c. to 2.0 o.c., which is in agreement with the intensity of the spatial distribution in HHG shown in Fig. 2(a). After t = 2.0 o.c., the returning electrons are emitted for a second time and the emitted electrons are mostly driven away.
For ϕ = 0.25π, figure 3(b) shows that the electron begins to ionize along the positive z direction around t = 0.53 o.c., and then the ionized electron moved along the positive z direction is gradually pulled back and mainly recollided with the H nucleus. After that, more electrons begin to ionize along the negative z direction around t = 0.94 o.c., and then the ionized electrons moved along the negative z direction are gradually pulled back and mainly recollided with the He nucleus in the range from 1.52 o.c. to 1.74 o.c. However, the returning electrons are emitted for a second time along the positive z direction and the emitted electrons are gradually pulled back and mainly recollided with the H nucleus in the range from t = 2.0 o.c. to t = 2.26 o.c. Thus, the overall harmonic intensity of the spatial distribution can be enhanced, which is in agreement with the analysis illustrated in Fig. 2(b).
For ϕ = 0.75π, figure 3(c) shows that the electron begins to ionize along the negative z direction around t = 0.80 o.c., and then the ionized electron moved along the negative z direction is gradually pulled back and mainly recollided with the He nucleus in the range from 1.10 o.c. to 1.55 o.c. After that, more electrons begin to ionize along the positive z direction around t = 1.0 o.c., and then, some electrons are driven away but there are still many electrons that have moved along the positive z direction gradually pulled back and mainly recollided with the H nucleus in the range from t = 1.69 o.c. to t = 2.17 o.c. It is illustrated that the harmonic intensity of the electron recombined with the H nucleus is enhanced, and the harmonic intensity of the electron recombined with the He nucleus is weakened, which is in agreement with the analysis illustrated in Fig. 2(c).
For ϕ = π, figure 3(d) shows that the electron begins to ionize along the negative z direction around t = 0.76 o.c., and then the ionized electron moved along the negative z direction is gradually pulled back and mainly recollided with the He nucleus in the range from t = 0.95 o.c. to t = 1.29 o.c. After that, more electrons begin to ionize along the positive z direction around t = 1.0 o.c., and then the ionized electrons moved along the positive z direction are gradually pulled back and mainly recollided with the nuclei in the range from 1.71 o.c. to 1.99 o.c. Furthermore, some electrons begin to ionize around t = 1.46 o.c., and then the ionized electrons along the negative z direction are almost driven away. The main recollision process is in agreement with the intensity of the spatial distribution in HHG as shown in Fig. 2(d).
From the above analysis, we can see that the returning probability of the ionized electrons along the negative z is the strongest at ϕ = 0.25π and weakest at ϕ = 0.75π, which is in agreement with the spatial distribution in HHG shown in Fig. 2.
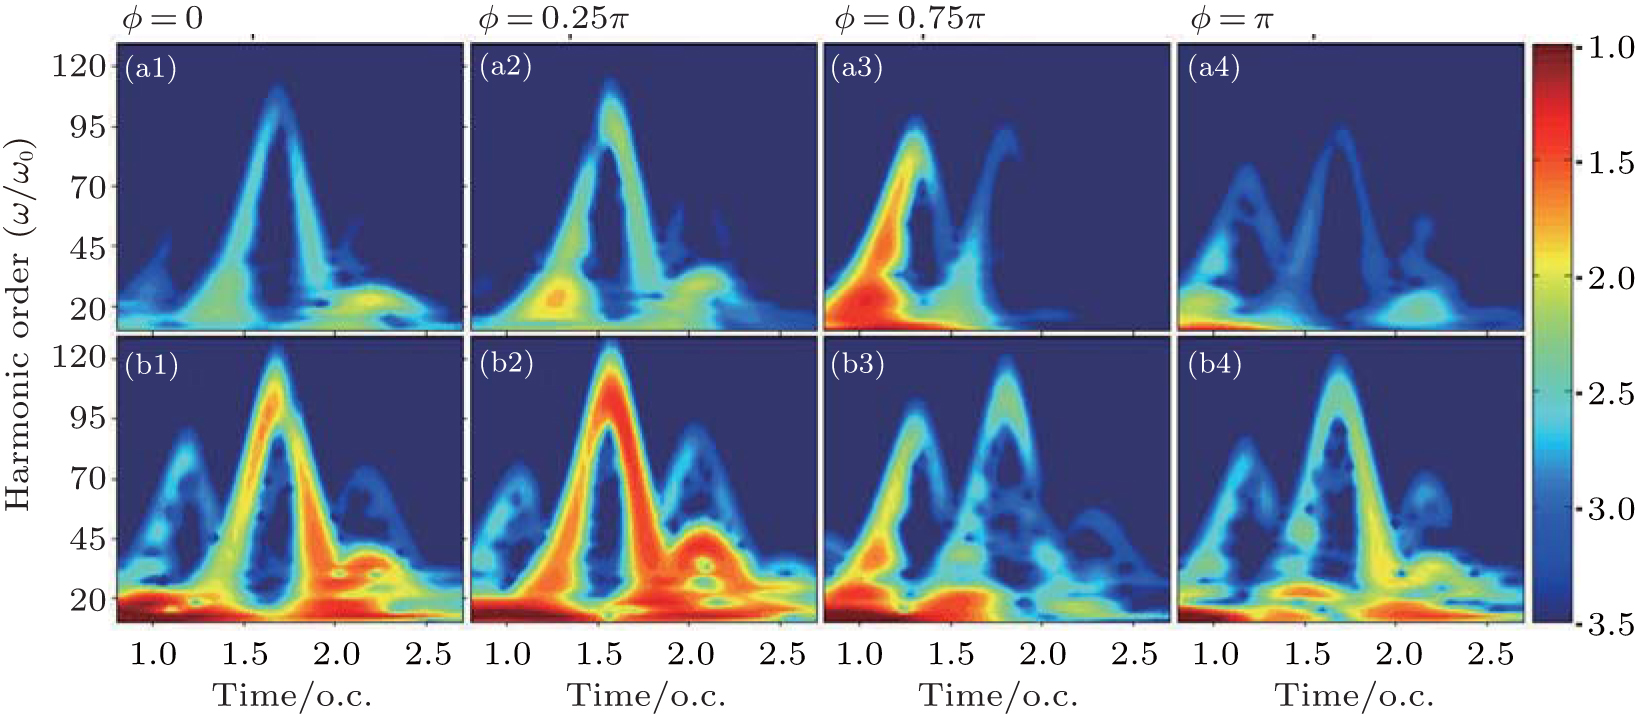
In order to investigate the spatial distribution in HHG, we separate the time-dependent-induced dipole acceleration into two parts in space[8,22]

where
Here, az<1.17(t) means that the electron recombines with the He nucleus, and az>1.17(t) means that the electron recombines with the H nucleus.
Figures 4(a1) and 4(b1) show that the harmonic intensity for ϕ = 0 when the electron recombines with the He nucleus is stronger than that with the H nucleus. The main emission time is from 1.42 o.c. to 1.94 o.c., which is in agreement with the recombination time of the electronic density distribution as shown in Fig. 3(a). Figures 4(a2) and 4(b2) show that the overall harmonic intensity for ϕ = 0.25π when the electron recombines with the two nuclei is enhanced. The long trajectory is enhanced and its emission time is mainly from 1.58 o.c. to 1.81 o.c., which is in agreement with the recombination time as shown in Fig. 3(b). Figures 4(a3) and 4(b3) show that the harmonic intensity for ϕ = 0.75π when the electron recombines with the H nucleus is enhanced, but the harmonic intensity when the electron recombines with the He nucleus is weakened. The emission time is mainly from 1.0 o.c. to 2.1 o.c., which is in agreement with the recombination time as shown in Fig. 3(c). Figures 4(a4) and 4(b4) show that the harmonic intensity for ϕ = π when the electron recombines with the He nucleus is enhanced, but the harmonic intensity when the electron recombines with the H nucleus is weakened. The main emission time is from 1.0 o.c. to 2.0 o.c., which is in agreement with the recombination time as shown in Fig. 3(d). The harmonic intensity when the electron recombines with the He nucleus is the strongest for ϕ = 0.25π and weakest for ϕ = 0.75π, which is in agreement with the spatial distribution in HHG illustrated in Fig. 2.
4. ConclusionsIn conclusion, we have investigated the CEP effect on the spatial distribution of HHG for the asymmetric diatomic molecule HeH2+ in a few-cycle laser pulse by numerically solving the non-Born–Oppenheimer time-dependent Schrödinger equation. The spatial distribution of the HHG spectra shows that there is little contribution in HHG around the geometric center of two nuclei (z = 1.17 a.u.) and the equilibrium internuclear position of H nucleus (z = 3.11 a.u.), but the contribution in HHG around equilibrium internuclear position of He nucleus (z = − 0.78 a.u.) can also be observed. These characteristics are attributed to the asymmetric molecular structure which is different from the case of  . The harmonics intensity when the electron recombines with the He nucleus is strongest at ϕ = 0.25π and weakest at ϕ = 0.75π. The time evolution of the electronic density distribution is used to illustrate the process of the HHG. We also present the time–frequency distribution of the separated time-dependent-induced dipole acceleration in space for HeH2+ to illustrate the physical mechanism of the HHG.


 ]
]