

Laser frequency locking based on Rydberg electromagnetically induced transparency
[Jiao Yuechun, Li Jingkui, Wang Limei, Zhang Hao, Zhang Linjie, Zhao Jianming†,  , Jia Suotang]
, Jia Suotang]
|
|


† Corresponding author. E-mail:
Project supported by the National Basic Research Program of China (Grant No. 2012CB921603), the National Natural Science Foundation of China (Grants Nos. 11274209, 61475090, 61378039, and 61378013), and the Research Project Supported by Shanxi Scholarship Council of China (Grant No. 2014-009).
We present a laser frequency locking to Rydberg transition with electromagnetically induced transparency (EIT) spectra in a room-temperature cesium vapor cell. Cesium levels 6S1/2, 6P3/2, and the nD5/2 state, compose a cascade three-level system, where a coupling laser drives Rydberg transition, and probe laser detects the EIT signal. The error signal, obtained by demodulating the EIT signal, is used to lock the coupling laser frequency to Rydberg transition. The laser frequency fluctuation, ∼0.7 MHz, is obtained after locking on, with the minimum Allan variance to be 8.9 × 10⁻¹¹. This kind of locking method can be used to stabilize the laser frequency to the excited transition.
The laser frequency stabilization has been playing an important role in the atomic physics experiments, especially in the fields of optical frequency standards, atomic clocks, quantum memory,[1–3] and so on. Many stabilization techniques lock laser frequency to the atomic ground state transitions, including dichroic atomic vapor laser locking (DAVLL),[4,5] combined saturated absorption spectra (SAS) and DAVLL,[6] polarization spectroscopy,[7] Sagnac interferometry,[8] modulation transfer spectroscopy,[9,10] and injection locking technique.[11] The other technique is locking the laser frequency to the reference cavity,[12,13] where the laser frequency couples the transition between two excited states or the molecular reference lines. The cavity-locking method strongly depends on the environmental factors such as temperature and pressure. Recently, the electromagnetically induced transparency (EIT) of the Rydberg (principal quantum number n ≫ 1) cascade system[14] has been widely investigated and used as a dispersive reference to lock the laser frequency to excited state transitions. Abel et al.[15] stabilized the laser frequency to the Rydberg transition with a cascade Rydberg EIT in a rubidium vapor cell at room temperature using the frequency modulation spectroscopy.[16] The Rydberg EIT can be used to realize quantum logic gates,[17] single-photon sources,[18,19] and single-photon transistors[20] by means of the Rydberg blockade effect.[21,22]
In this work, we present a method of locking the laser frequency to the excited Rydberg transition. An EIT signal provides a direct relative frequency reference with the sub-natural spectral widths based on atomic coherence.[23,24] The locking method is mainly based on a cascade EIT involving highly excited Rydberg states in a cesium vapor cell at room temperature, which can be used to lock the laser frequency to the transition of two excited states. For getting the error signal, we apply a weak modulation to the probe laser resulting in the modulated EIT signal. We use a lock-in amplifier to demodulate the modulated EIT spectra to obtain the error signal and lock the laser frequency to Rydberg transition. The Allan variance is introduced to evaluate the frequency stability.
We perform EIT experiments in cesium vapor cell at room temperature, in which a coupling laser, 510-nm laser with power of 3.5 mW and radius of 50 μm, strongly drives Rydberg transition, 6P3/2 (F′ = 5) → nD5/2 (n = 49), while a weak probe laser (852 nm, 4.5 μW, and radius of 80 μm), probes the ground transition 6S1/2 (F = 4) → 6P3/2 (F′ = 5). The coupling laser counter-propagates with the probe laser through a 50-mm long vapor cell.
The schematic of the experimental setup and the related Rydberg ladder three-level scheme are shown in Fig.
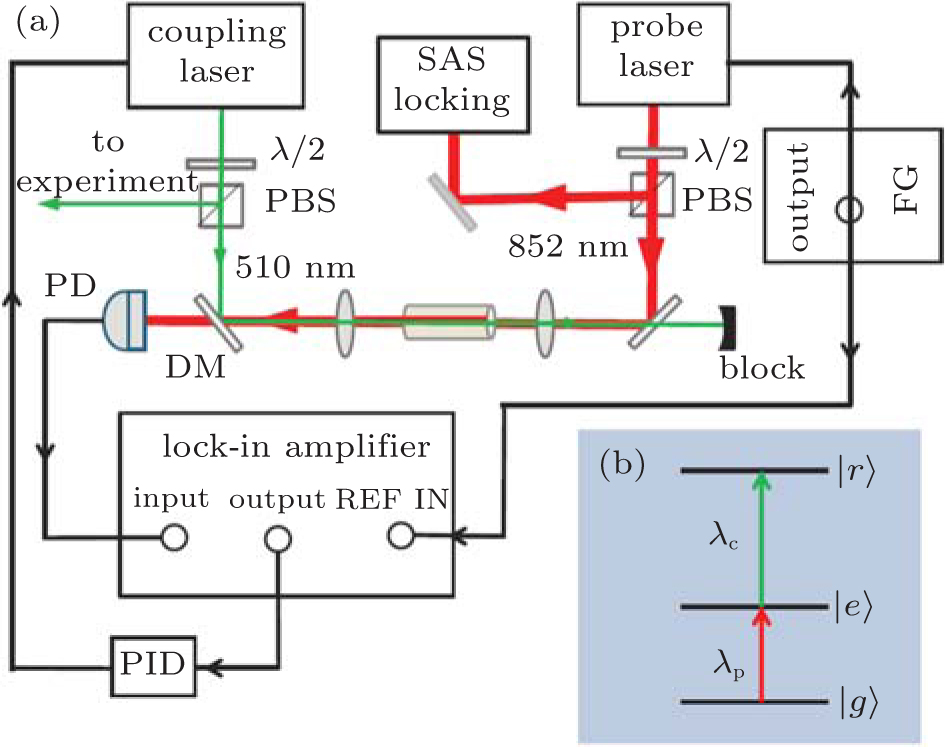 | Fig. 1. (a) Schematic of the experimental setup. The 510-nm coupling laser, counter-propagates with the probe laser, 852 nm, through a cesium vapor cell. The probe beam, modulated using a function generator (FG) with the modulation frequency of 1 kHz, is detected using a photodiode (PD) resulting in a modulated EIT signal. The error signal, demodulated EIT signal produced using a lock-in amplifier, is fed back to the controller of the coupling laser through PID and used to lock the coupling laser frequency to Rydberg transition. (b) The energy levels, the ground state 6S1/2 (F = 4) (|g⟩), the excited state 6P3/2 (F′ = 5) (|e⟩), and the Rydberg state nD5/2,3 /2 (|r⟩) consist of a cascade three-level system. By probing the ground state transition |g⟩→ |e⟩, the excited transition |e⟩→ |r⟩ is detected using EIT. |
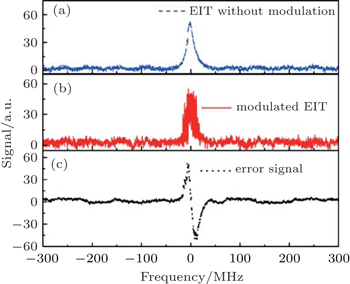
The transmission of the probe laser, which is resonant with the lower transition |g⟩ → |e⟩, is detected with a photodiode (PD) after a dichroic mirror (DM). Due to the current/frequency modulation of the probe laser, we obtain a modulated EIT signal, as shown by the red line in the middle curve in Fig.
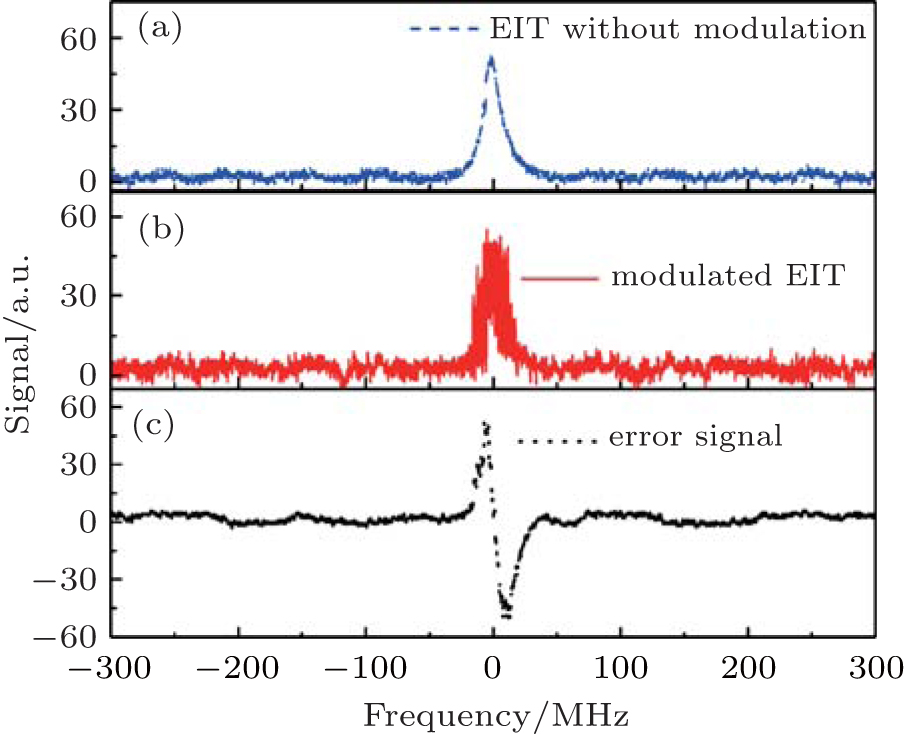 | Fig. 2. (a) An EIT signal without frequency modulation. A typical modulated EIT spectrum (b) and corresponding error signal (c) for the probe beam locking to transition 6S1/2 (F = 4) → 6P3/2 (F′ = 5) with SAS spectrum and the coupling laser scanning through resonance 6P3/2 (F′ = 5) → 49D5/2. |
In experiments, the probe laser is locked to the 6S1/2 (F = 4) → 6P3/2 (F′ = 5) transition using the SAS technique, while the coupling laser is scanned through the Rydberg transition 6P3/2 (F′ = 5) → nD5/2 (n = 49 in this work). When the coupling laser frequency is resonant with the Rydberg transition, we can get the EIT signal. As the coupling laser is slowly and linearly scanned, the probe laser is rapidly modulated (at 1 kHz) to about its fixed central frequency. The rapid oscillations in EIT signal reflect the 1 kHz probe modulation (see Fig.
Figure
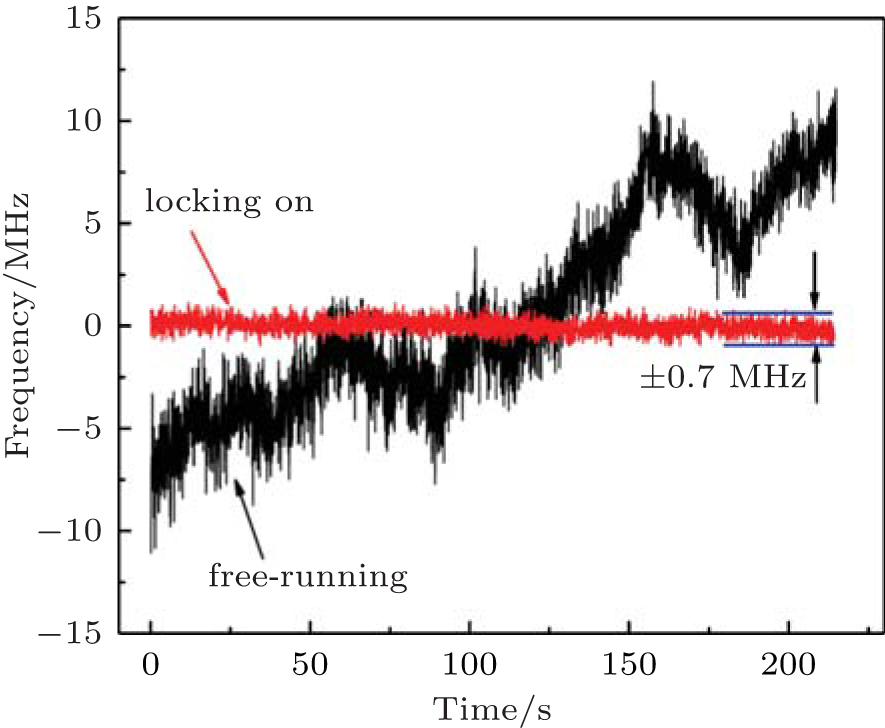 | Fig. 3. Monitored laser frequency of the coupling laser with and without locking on. After locking on, the laser frequency fluctuation is strongly suppressed, the frequency stability is ±0.7 MHz, and the frequency fluctuation was less than 1 MHz in a given period of 220 s. |
The method we presented in this work, the current/frequency modulation of the probe laser, provides us with two kinds of error signals: one coming from the SAS of the probe laser for locking the laser to the ground state transition, the other from the Rydberg EIT signal for locking the coupling laser to the Rydberg transition.
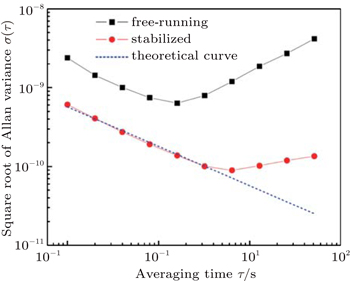
The error signal is recorded and analyzed using the square root of the Allan variance, σ(τ),[26] which is measured as a function of the averaging time, τ. The results of σ(τ), with a measure interval of 0.1 s, are shown in Fig.
 | Fig. 4. Square root of Allan variance as a function of averaging time, τ, for the coupling laser locking on (red circles) and free running (black squares). The measured minimum, σ(τ) with a measure interval of 0.1 s, is 6.3 × 10⁻¹⁰ for free-running and 8.9 × 10⁻¹¹ for laser stabilization. The dashed line represents the theoretical curve. |
In summary, we have performed a laser frequency stabilization to excited Rydberg transition based on a Rydberg cascade three-level EIT. The modulation of the probe laser can be used to produce two kinds of error signals at the same time, both for locking the probe laser to the ground state transition and the coupling laser to Rydberg transition. The modulated EIT signal also enables the detection of a weak Rydberg EIT signal due to the small dipole matrix of Rydberg transition 6P→nS/nD by using the demodulation technique.[27]
This kind of locking method can be used to stabilize laser frequency to excited Rydberg transition and lock two lasers with a fixed frequency difference related to the atomic transition line. The case of Rydberg excitation displays power dependence due to the dipole matrix of 6P→nS/nD being strongly dependent on n.[28] This approach may be particularly useful for experiments of Rydberg atoms and other excitation schemes in atomic physics experiments.
| 1 | |
| 2 | |
| 3 | |
| 4 | |
| 5 | |
| 6 | |
| 7 | |
| 8 | |
| 9 | |
| 10 | |
| 11 | |
| 12 | |
| 13 | |
| 14 | |
| 15 | |
| 16 | |
| 17 | |
| 18 | |
| 19 | |
| 20 | |
| 21 | |
| 22 | |
| 23 | |
| 24 | |
| 25 | |
| 26 | |
| 27 | |
| 28 |