
Daily variation of radon gas and its short-lived progeny concentration near ground level and estimation of aerosol residence time
[Mohery M1, 2, †,  , Abdallah A M1, Ali A3, 4, Baz S S5]
, Abdallah A M1, Ali A3, 4, Baz S S5]


† Corresponding author. E-mail:
Project supported by the Deanship of Scientific Research (DSR), King Abdulaziz University, Jeddah (Grant No. 291/965/1434).
Atmospheric concentrations of radon (222Rn) gas and its short-lived progenies 218Po, 214Pb, and 214Po were continuously monitored every four hours at the ground level in Jeddah city, Kingdom of Saudi Arabia. The measurements were performed three times every week, starting from November 2014 to October 2015. A method of electrostatic precipitation of positively charged 218Po and 214Po by a positive voltage was applied for determining 222Rn gas concentration. The short-lived 222Rn progeny concentration was determined by using a filter holder connected with the alpha-spectrometric technique. The meteorological parameters (relative air humidity, air temperature, and wind speed) were determined during the measurements of 222Rn and its progeny concentrations. 222Rn gas as well as its short-lived progeny concentration display a daily and seasonal variation with high values in the night and early morning hours as compared to low values at noon and in the afternoon. The observed monthly atmospheric concentrations showed a seasonal trend with the highest values in the autumn/winter season and the lowest values in the spring/summer season. Moreover, and in parallel with alpha-spectrometric measurements, a single filter-holder was used to collect air samples. The deposited activities of 214Pb and the long-lived 222Rn daughter 210Pb on the filter were measured with the gamma spectrometric technique. The measured activity concentrations of 214Pb by both techniques were found to be relatively equal largely. The highest mean seasonally activity concentrations of 210Pb were observed in the autumn/winter season while the lowest mean were observed in the spring/summer season. The mean residence time (MRT) of aerosol particles in the atmospheric air could be estimated from the activity ratios of 210Pb/214Pb.
The radionuclide radon (222Rn) of the uranium (238U) decay chain is a noble gas produced by the decay of 226Ra in the Earth’s crust. Once the 222Rn (half-life time of 3.8 day) escapes from the upper crust of the Earth, it begins its journey in the atmospheric air via diffusion and advection. The spread of 222Rn in the atmosphere after its exhalation from the ground surface is mainly caused by diffusion turbulence and is limited only by radioactive decay.[1] 222Rn concentrations in the open air show from-site-to-site differences related not only to exhalation rates from the ground surface of the investigated area but also to the prevalent meteorological conditions and mainly to local atmospheric transport phenomena on the horizontal and vertical scale.[2–4] After the radioactive decay of 222Rn, its progenies (heavy metals) rapidly attach to the surface of aerosol particles in the air forming the radioactive aerosols. Due to attachment, their behavior is largely determined by the physical behavior of the aerosol particles in the air. The elimination of these attached progeny from the atmospheric air occurs either by removal processes (dry deposition, washout, rainout) or radioactive decay.[1]
The variation of the concentration of 222Rn gas and its progenies in the air depends on the meteorological conditions and height above the ground surface. In addition, the progeny concentration is influenced by the radioactive decay and the transport with the associated aerosols.[2,5] In Table
| Table 1. Activity concentration range of short- and long-lived 222Rn progeny in free atmosphere near the ground level. (*) refers to short-lived radon progeny: 218Po, 214Pb, 214Bi, and 214Po; and (**) refers to the long-lived radon progeny.[3] . |
About 50% of the mean received dose in the environment is derived by inhalation of the naturally occurring short-lived 222Rn progeny.[4,7] Therefore, information on the fluctuations of short-lived 222Rn progeny concentration with the meteorological parameters is important to study their behaviors. Moreover, the equilibrium equivalent concentration (EEC) is an important parameter to evaluate the radiation exposure from short-lived 222Rn progeny in the environment. The determination of this parameter is a traditional procedure used to know the levels of exposure due to inhalation of short-lived 222Rn progeny. The total attached aerosol concentration with short-lived 222Rn progeny in the air, which is characterized by the equilibrium equivalent concentration (EEC), is given by [8]
Several researchers have measured the daily concentration variations of 222Rn and its short-lived progenies in atmospheric air, but not limited.[9–15] They have found that the daily concentration variation exhibits correlation with the relative air humidity, and anti-correlation with the air temperature, which indicates that the concentration is mainly influenced by the turbulent diffusion caused by the changes in temperature. However, most of the observed concentrations show a maximum occurring in the early morning and a minimum in the late afternoon. The variation between maximum and minimum levels of concentration on the same day is an index of the maximum height of the mixed layer.[16]
The estimation of mean residence times (MRT) of aerosol particles is associated with the atmospheric air boundary layer where most of the contaminations are found. Radioactive nuclides as tracers are useful for estimating the MRT due to their decrease with time, and most of these radionuclides after their production are attached immediately to the aerosol particles. The activity concentration ratio of attached 210Pb to other attached radon daughters is used to evaluate the residence time of aerosol particles in the atmosphere.[17,18] Several researchers have estimated the MRT of atmospheric aerosol particles from the activity ratios of 210Pb/222Rn, 210Bi/210Pb, and 210Po/210Pb.[19–25] However, all these studies have indicated contradictions between the MRT obtained from these three pairs due to different processes, which include the reality that these radionuclides are attributable to different portions in the atmosphere. The advantages of the 210Bi method are: i) the half-life of 210Bi (5 d) is comparable to the MRT of aerosol particles and the water vapor is in lower atmospheric air than 210Po;[19] ii) the changeable nature of 210Po could result in additional sources of 210Po to the atmosphere, which could change the residence time based on 210Po/210Pb pair.[26] However, most observations have indicated that the MRT obtained from the 210Po/210Pb ratios (8–65 days) is longer than that from the 210Bi/210Pb ratios (6–13 days). On the other hand, the activity ratio 210Pb/214Pb has been used to estimate the MRT of aerosol particles in the urban air.[27] This ratio is suitable to estimate the MRT since both radionuclides are gamma-emitters (can detect together) and the only source for 210Pb in the air is 214Pb. However, in the literature few data are available on the estimation of MRT by 210Pb/214Pb ratios, except Refs. [28] and [29]. Generally, the MRT changes widely according to the origin of 210Pb as well as its concentration, which is governed mainly by the large scale of weather factors.
Representative data on the daily concentration variation of 222Rn and its short-lived progenies are still not found or scarce in atmospheric air of this area (Jeddah city). Therefore, the first aim of this study is to carry out continuous measurements of daily concentration variation of 222Rn and its attached short-lived progenies (218Po, 214Pb, and 214Po), and to determine the basic meteorological conditions. Moreover, the meteorological parameters responsible for these variations will be discussed. In addition, due to the difference in opinions expressed by several researchers about the contradiction in the values of aerosol residence time, the second aim of this study is to estimate the seasonal variations of the aerosol residence time by determining the ratios between 210Pb and 214Pb concentrations. In addition, this will combine with the determination of the basic meteorological parameters.
The 222Rn gas concentration in atmospheric air has been determined by using a 222Rn gas monitor. The monitor has been constructed to be similar to that employed and calibrated by[30]. The monitor is an aluminum sphere with a volume of 1.8 L and operates at a flow rate of 100 L·h−1. The sphere incorporates a surface barrier detector with an active area of 300 mm2 and a diameter of 19.5 mm. The detector is isolated in a PVC mounting. The volume of the aluminum sphere (1.8 L) is adapted to the flow rate, taking the half-life time of 222Rn (3.82 d) into consideration. Therefore, a residence time of about 0.02 h passes until a small fraction of 222Rn decays to 218Po. With a known amount of radon gas (using a standard radium solution source), the monitor could be calibrated.[30] Within three hours’ counting interval, the 222Rn gas monitor can detect down to 2 Bq·m−3 with 30% statistical uncertainty.[30] The uncertainties in 218Po and 214Po can be calculated from the propagation of uncertainties through the entire analysis procedure, and from the uncertainty due to alpha counting.
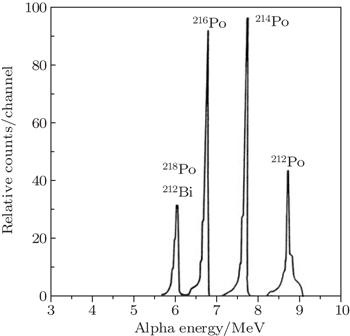
For the purpose of 222Rn gas detection, the positively charged atoms of 218Po were collected on a surface barrier detector by an applied positive voltage of 10 kV between the sphere and the detector surface, which is connected to an α-spectrometric system. The air was dried, filtered to remove the 222Rn decay products, and sucked into the aluminum sphere. The alpha disintegrations of 218Po could easily be counted and identified by the α-spectrometric system with an energy resolution of 80 keV. The count rates of 218Po and 214Po are proportional to the 222Rn activity concentration in the air. A typical alpha particle energy spectrum is obtained and shown in Fig.
 | Fig. 1. Typical alpha particle energy spectrum of 222Rn and 220Rn progeny mixture resulting from electrode position on a surface barrier detector. |
The attached activity concentration of short-lived 222Rn progeny in the open air was determined by using an alpha spectrometric technique. In this technique, a surface barrier detector mounted to a filter holder was applied. The air was drawn through a membrane filter by using a vacuum pump with a flow rate of 15 L/min. The filter used was a type Sartorius membrane filter type SM, 1.2 μm pore size, 25 mm diameter, and its efficiency is 99%. Since the radionuclides are collected on the filter, the surface barrier detector (diameter of 19.5 mm and active area of 300 mm2) can register the alpha decay. The alpha particles were detected during and after air sampling. With a detector energy resolution of about 300±20 keV and a separation distance of 6 mm between the filter and the detector, it is easy to distinguish between the alpha-particle energies emitted during the decay of 218Po (6.0 MeV) and 214Po (7.8 MeV).[31] The detection efficiency of the system could easily be calculated using a Monte–Carlo method and be checked by a standard plane source. For the system geometry, which depends on the 4π emission, a detector counting efficiency of 17±0.5% was obtained.[32] The detector’s detection efficiency does not depend on the energy range between 218Po and 214Po (6–7.8 MeV), i.e., it does not change with the α-energy in this range.
The measurements were carried out as follows: i) the alpha particle spectrum has been collected during a sampling with a time interval of 30 min; ii) after waiting for a time of 30 min without sampling, the alpha particle spectrum was measured again (during the decay time) for another 30 min. The purpose of the waiting time is to remove the 218Po activity on the filter by radioactive decay. From the registered alpha-counts of 218Po and 214Po during the sampling period and alpha-counts of 214Po during the decay time, the activity concentration of 218Po, 214Pb, and 214Po in atmospheric air could be calculated.[31]
The aerosol samples have been collected on a round glass fiber filter (125 mm diameter and a collection efficiency of 99%). The air samples were collected in parallel with the alpha spectrometric measurements mentioned above. The filter is placed on an open-faced filter holder mounted onto the inlet of a high-volume flow rate suction pump (50 m3·h−1). Due to the low concentration of 210Pb in the air, the high flow rate was necessary for collecting detectable amounts. In each run, the air sucked for six hours and thus about 300 m3 of air passed through the filter. Assuming a constant level of radioactivity in the air, the steady state concentration of 214Pb on the filter will reach within about two hours. After the air-sampling procedure and by means of a hydraulic press, the filter was folded and pressed into a plastic cover in a tablet form. Therefore, the tablet was placed close to the active part of the detector, and the relative gross γ-ray emitting activities of 214Pb and 210Pb were detected for at least 24 hours. For calculation of the activity concentration of 214Pb, the following formula was used:

The previous formula is valid only if the sampling time is longer than the half-life time of the radionuclide. The following formula was applied for calculating the activity concentration of 210Pb:


The measurements of 222Rn and its short-lived progeny concentration were carried out in Jeddah city. Jeddah is located on the eastern side of the Red Sea, South West of the KSA. Jeddah is located between latitudes 21°27′ and 21°30′ N, longitudes 39°9′ and 31°12′ E. Jeddah features an arid climate under Koppen’s climate classification. It is directly affected by the climate of the geographic location, that is, high temperatures and humidity during the summer. The temperatures are around the early 40 s, when the city falls under the influence of a low seasonal zone with a solid and warm air mass. Humidity reaches its highest levels in summer (more than 85% and frequently 100%) because of the high temperature of seawater and it is lower in winter due to the impact of the moderate air mass associated with high pressure.
The most common type of rainfall is thunderstorms, which usually fall during the winter and spring seasons due to the passage of low pressure from the west to the east and their meeting with the low-pressure heat in the zone of Sudan.
The prevailing winds over Jeddah are north-west winds due to the city’s coastal location on the shore of the Red Sea. The winds are usually light-to-moderate for most of the time in one year. However, sometimes southern winds blow through winter, spring and fall accompanied by a rise in temperature. These winds get active sometimes and their speed may cause great sandstorms. They may also be accompanied by thunderstorms and heavy rain. Dust storms happen in summer and sometimes in winter, coming from the Arabian Peninsula’s deserts or from North Africa. The measurements were performed at a sampling site located at a height of two meters above the ground, flat area. This site is far from any direct pollution sources. Simultaneously, by using wireless weather station (Davis Instruments-6152), the local meteorological data, such as relative humidity, air temperature, and wind speed, were recorded. The obtained meteorological data were recorded every second and averaged for ten minutes’ intervals. Since the measurements were performed continuously between November 2014 and October 2015, considerable fluctuations of 222Rn and its short-lived progeny concentrations were observed due to different meteorological conditions during the year. The average activity concentrations of 222Rn, 218Po, 214Pb, and 214Po, the EEC over the four seasons, and the meteorological data along with their ranges of variations are listed in Table

| Table 2. Seasonal average activity concentrations of 222Rn, 218Po, 214Pb, 214Po, EEC, and meteorological parameters (extreme values within each season in parenthesis) for surface air measurements at Jeddah city. The measurements were performed with the alpha spectrometric technique. . |
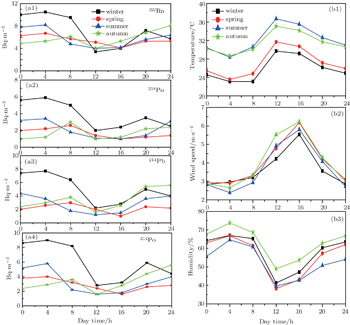
The meteorological processes are responsible for the seasonal variation of 222Rn and its progeny concentrations in the boundary layer. The seasonal pattern of 222Rn and its short-lived progeny concentration reflects the regional weather conditions prevailing at Jeddah city. For the four seasons, the average daily variations of these concentrations are shown in Fig.
 | Fig. 2. (a) Average diurnal variation of 222Rn and its short-lived progeny concentration for each season over a period of one year (November 2014-October 2015) for surface air measurements at Jeddah, KSA. (b) Average diurnal variation of relative humidity, air temperature and wind speed for each season over the same period of a year (November 2014-October 2015) for surface air measurements at Jeddah, KSA. |
The monthly mean values of diurnal variations of 222Rn and its progeny concentration over one year of observation are shown in Fig.
The inverse correlation between 222Rn as well as its progenies with wind speed was related mainly to atmospheric turbulent processes. During strong winds, lower activity concentrations were observed near the ground. During calm weather, the concentrations reached higher values, which means that radon is produced locally. The differences between day and night concentrations were found to be small in cloudy weather. In principle, the results of this study show that daily variations of radon and its short-lived progeny concentrations are relatively similar to patterns observed worldwide.[1,9,10,12,14,36]
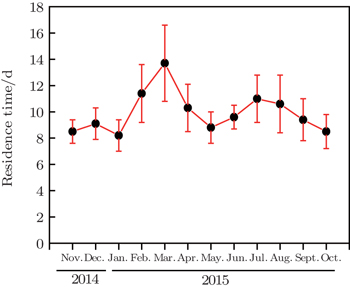
The average activity concentrations of 214Pb and 210Pb, average activity ratios of 210Pb/214Pb, and mean residence time over the four seasons are listed in Table
| Table 3. Average activity concentrations of 214Pb, 210Pb, average activity ratios of 210Pb/214Pb and mean residence time (MRT). The measurements were performed with the gamma spectrometric technique. . |
Over the four seasons, different seasonal average ratios of 210Pb/214Pb have been observed. It varied between 7.4×10⁻⁴ and 1.02×10⁻³ with a mean value of 8.6×10⁻⁴±5.6×10⁻⁵ (see Table
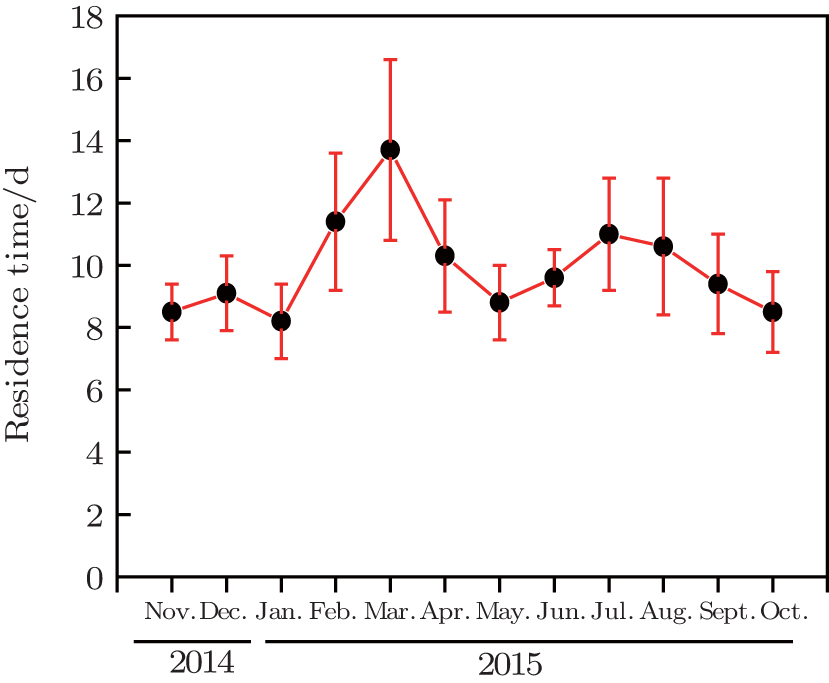 | Fig. 3. Monthly mean residence times of atmospheric aerosols in Jeddah, KSA. The mean standard deviations of monthly values are attached to the mean values. |
We conclude that the mean activity concentrations differ from the obtained values in other countries as a result of differences in locations and meteorological factors. The daily variations, for the analyzed period, of radon and its short-lived progeny concentrations display a constant dynamic as reported in the literature. Cities that have the same concentrations of 222Rn and its progeny, like the one studied here, can possibly be found in many countries and may become sources of information regarding the effect on the health of low doses due to the exposure to 222Rn progenyoutdoors. The influence of the meteorological conditions is evident in the daily and seasonal variations of 222Rn and its progeny concentrations in the boundary layer. More studies on the residence time of radioactive aerosols using the 210Pb/214Pb ratio are necessary with respect to altitude and latitude and to validate this observation. Moreover, long-term series of measurements for the concentration levels are necessary in the future for studying processes of dispersion characteristics of atmospheric pollutants.
| 1 | |
| 2 | |
| 3 | |
| 4 | |
| 5 | |
| 6 | |
| 7 | |
| 8 | |
| 9 | |
| 10 | |
| 11 | |
| 12 | |
| 13 | |
| 14 | |
| 15 | |
| 16 | |
| 17 | |
| 18 | |
| 19 | |
| 20 | |
| 21 | |
| 22 | |
| 23 | |
| 24 | |
| 25 | |
| 26 | |
| 27 | |
| 28 | |
| 29 | |
| 30 | |
| 31 | |
| 32 | |
| 33 | |
| 34 | |
| 35 | |
| 36 | |
| 37 | |
| 38 |