
Spin-cluster glass state in U(Ga0.95Mn0.05)3
[Xie Dong-Hua1, 2, Zhang Wen2, Liu Yi2, Feng Wei2, Zhang Yun2, Tan Shi-Yong2, Zhu Xie-Gang2, Chen Qiu-Yun2, Liu Qin2, Yuan Bing-Kai2, Lai Xin-Chun2, †,  ]
]
]
|
|


† Corresponding author. E-mail:
Project supported by the Natural Science Foundation of China Academy of Engineering Physic (Grant No. 2014A0301013) and the National Natural Science Foundation of China (Grant Nos. 11304291 and 11504342).
We report the study of a low temperature cluster glass state in 5% Mn-doped UGa3 heavy fermion compound. This compound transforms from a paramagnetic state to a spin-cluster glass state, which is confirmed by measuring the dc susceptibility and magnetization. The ac susceptibility exhibits a frequency-dependent peak around Tf, which provides direct evidence of the cluster glass state. By analyzing the field-dependent magnetization and frequency-dependent ac susceptibility in detail, we deduce that this compound forms a spin-cluster glass state below Tf.
The uranium compounds of the UX3 series (X: a group-IIIA or IVA element in the periodic table) present various interesting magnetic behaviors from an enhanced, Pauli-like paramagnetism (UAl3, USi3, and UGe3), through local spin fluctuations (USn3), to a local-moment ordering (UPb3). A great variety of magnetic properties in the UX3 series are commonly attributed to a hybridization effect between the 5f-electron states of uranium and the s, p, d electronic states of neighboring atoms. The antiferromagnetic compound UGa3 (TN = 67 K),[1–3] crystallizing in the AuCu3 structure, locates a special position at the onset of magnetic order among the UX3 phase. The substitution of the group-IIIA (or group-IVA) element for Ga atoms in UGa3 exhibits interesting magnetic properties through the changes of the hybridization between the uranium 5f electronic states and the conduction electronic states of gallium. For example, with increasing Sn concentration, the f electrons in the UGa3−xSnx system undergo a transition from the itinerant antiferromagnetic state to a typical spin fluctuation state, and finally localize for x ∼ 1.[4] While in UGa3−xGex, the substitution of Ge atoms gradually suppresses the long range magnetic order, and reaches the quantum critical point at x ∼ 0.6, which presents non-Fermi liquid behavior.[5]
Similarly, the hybridization effect would be changed by the substitution of UGa3 in the transition metal for Ga atoms since it not only changes the order degree of the occupied atom, but also prominently changes the exchange interactions through changes of environment (the valence electrons and the U–U distance). This concept motivated us to investigate the properties of Mn-doped UGa3, which present the spin-cluster glass (SCG) state at a low temperature. This compound plays an important role in better understanding the f-electron contributions to the magnetism in uranium compounds.
Single crystals of U(Ga0.95Mn0.05)3 were grown by the Ga self-flux method.[6,7] The raw materials of U (99.8%), Mn (99.999%), and Ga (99.9999%) were mixed together according to the ratio of U:Mn:Ga = 1:(0.5∼2):10. The feed, placed in an alumina crucible and sealed in an evacuated quartz tube, was heated in a resistance furnace up to 1200 °C, held at this temperature for 24 h and then slowly cooled down to 600 °C at a rate of 1 K/h. Then, the single crystals were separated from the flux by means of centrifuging at 600 °C. The obtained crystals were a cube shape with a maximum dimension of 2 mm× 2 mm× 3 mm.
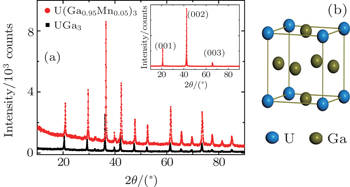
The actual compositions of the obtained crystals were determined by utilizing energy dispersive x-ray (EDX) microanalysis. All the single crystals prepared by different ratios present the same atomic ratio of U:Ga:Mn, which is 1:2.85:0.15. X-ray diffraction (XRD) was performed on the single crystals and their crushed powder by a diffractometer in a range from 10° to 90°. The frequency-dependent ac susceptibility and low-field magnetization were measured by using a quantum design physical properties measurement system (PPMS). Specific heat experiments were performed in a temperature range of 2 K–200 K on the PPMS using the relaxation method.
Figure
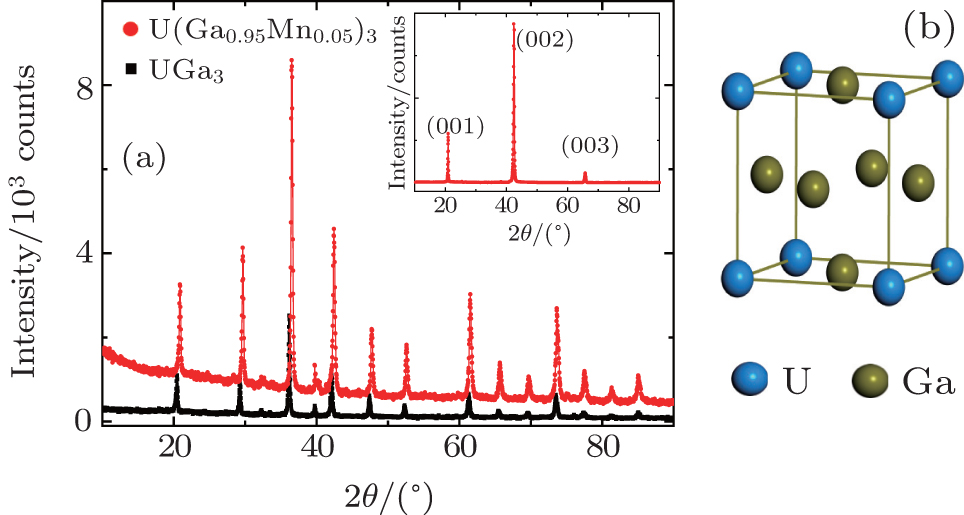 | Fig. 1. (a) Room temperature XRD patterns of the powder of UGa3 and U(Ga0.95Mn0.05)3 single crystals after grinding. The inset shows the XRD pattern of the corresponding single crystal, showing mainly the c-axis orientation featured with very sharp peaks. (b) Schematic diagram of UGa3 unit cell. |
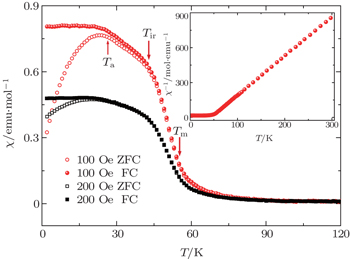
The values of the dc susceptibility χ (χ = M/H) of U(Ga0.95Mn0.05)3 measured in the zero-field-cooled (ZFC) and field-cooled (FC) modes under various applied magnetic fields are shown in Fig.
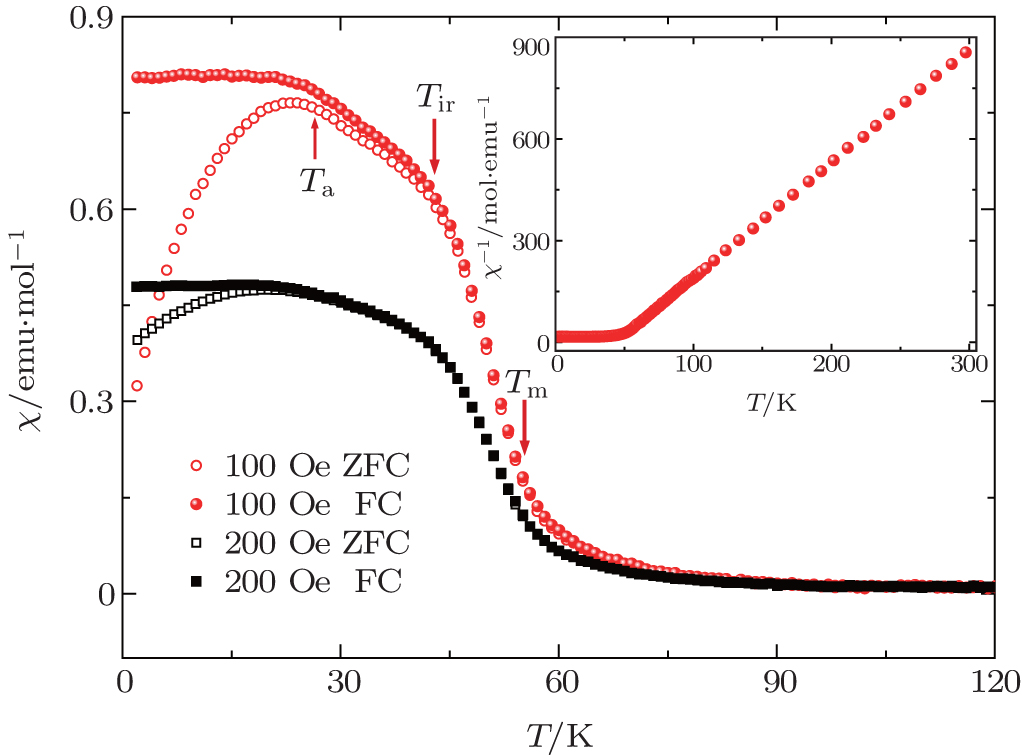 | Fig. 2. DC susceptibility χ (χ = M/H) data for U(Ga0.95Mn0.05)3 measured in the FC (closed symbols) mode and the ZFC (open symbols) mode in various magnetic fields. Ta is denoted by the temperature where χZFC(T) reaches a maximum and Tir is the temperature where χFC(T) and χZFC(T) start to separate from each other. Tm is defined as the temperature where the susceptibility sharply increases. The inset displays the temperature dependence of the inverse molar magnetic susceptibility. |
Above 60 K, the reciprocal susceptibility curve can be well fitted by the Curie–Weiss law χ = C/(T − θp) (inset of Fig.
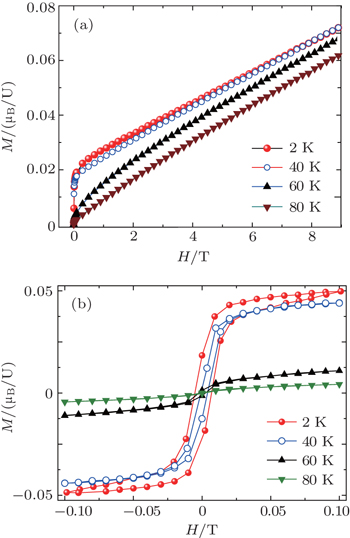
Figure
 | Fig. 3. (a) Magnetizations up to 9 T and (b) the hysteresis curves measured at various temperatures for U(Ga0.95Mn0.05)3 single crystal. |
Figure 


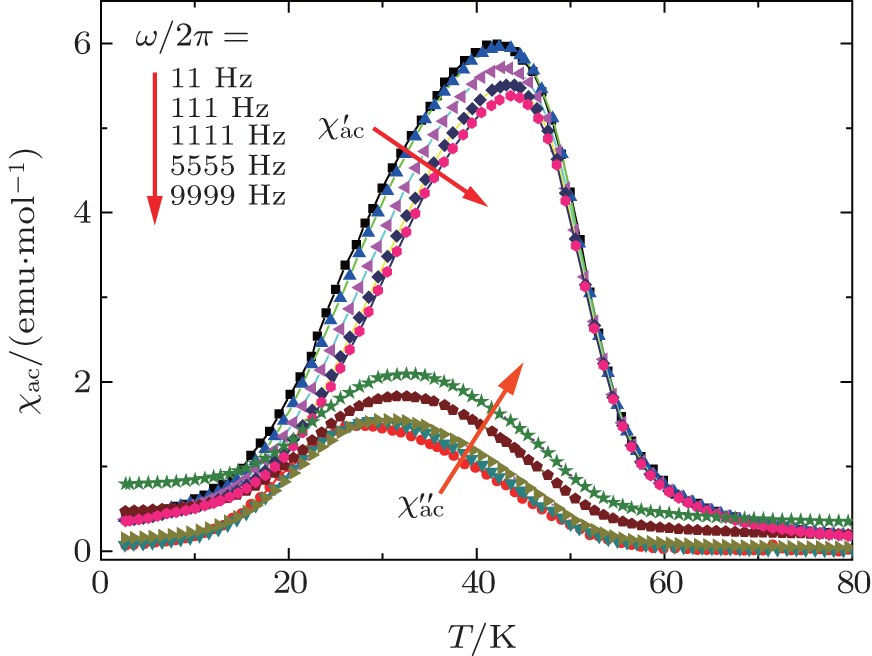 | Fig. 4. In-phase   |
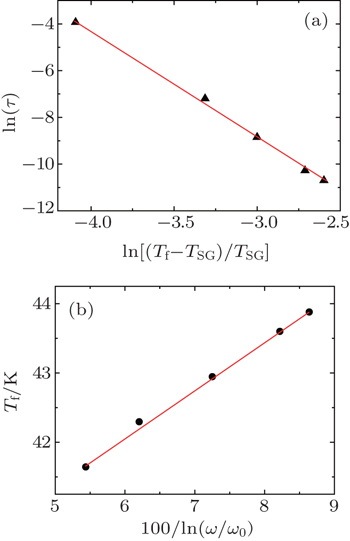
The dynamical parameter, relaxation time τ, follows the conventional power-law divergence of critical slowing down,[8,9]

The ln–ln plot of relaxation time τ versus [(Tf − TSG)/TSG] is shown in Fig. 
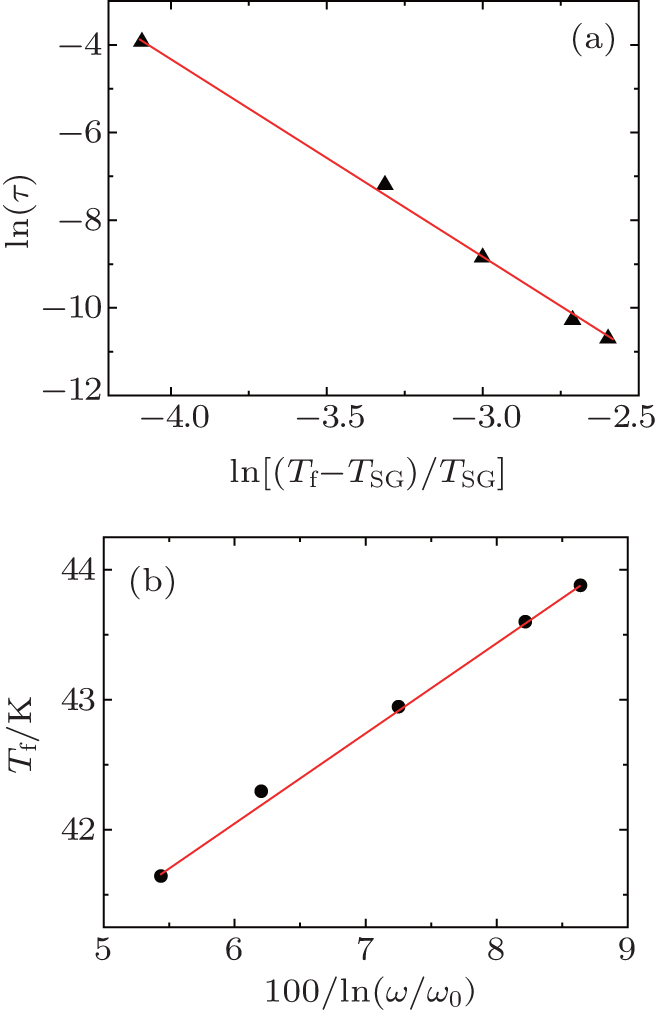 | Fig. 5. (a) Relaxation time of freezing temperature plotted as ln(τ) versus ln [Tf − TSG]/TSG]. The solid line represents the fit to the power-law divergence. (b) The frequency dependence of freezing temperature plotted as Tf versus 100/ln(ω0/ω). The solid line represents the fit to Vogel–Fulcher law. |
The frequency dependence of freezing temperature Tf can be obtained using the empirical Vogel–Fulcher law:[16–20]

A plot of Tf versus 100/[ln(ω0/ω)] is shown in Fig.
Figure
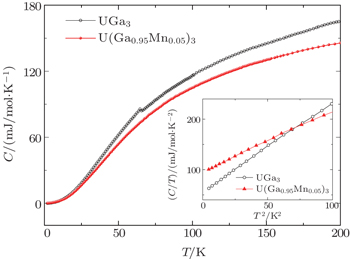
 | Fig. 6. Temperature dependences of the specific heat C(T) for U(Ga0.95Mn0.05)3 and UGa3. Inset shows C/T versus T2 plot. |
It is generally accepted that both randomness and frustration of magnetic moments are essential to produce the spin glass state.[9] As for U(Ga0.95Mn0.05)3, the magnetic U atoms form a fully periodic lattice, the 3d half-filled Mn atom and non-magnetic Ga atom randomly occupy the ligand site. The disorders of Mn and Ga atoms in the lattice can destroy the long-range magnetic correlation between U atoms and introduce individual spins or spin clusters with net magnetic moments by the local RKKY interaction. In addition, the Mn atom may have a local magnetic moment which has not been completely screened by the conduction electrons in this compound. Within one layer, U atoms and Mn atoms may form triangles of the nearest neighbors and no single configuration of the spins is extraordinarily favored. Therefore, the combination of the site randomness of Ga/Mn ions and frustration of magnetic moments resulting from the competing ferromagnetic and antiferromagnetic interactions between U ions easily leads to the randomly distributed spin-clusters in U(Ga0.95Mn0.05)3.
The ac and dc magnetic susceptibilities, isothermal magnetization, and specific-heat data of U(Ga0.95Mn0.05)3 single crystal provide conclusive evidence of SCG behavior below the characteristic freezing temperature Tf = 41.7 K. Irreversible magnetism behaviors in ZFC and FC, and a frequency-dependent anomaly in the ac susceptibility reveal a spin-glass behavior with a freezing temperature Tf. The sharp increase in dc susceptibility, a small jump at the very small field in the isothermal magnetization below Tm and no anomaly in the specific heat support the presence of clusters with frozen moments. We deem that the disorders of Mn and Ga atoms in the crystal lattice and frustration of magnetic moments lead to the random distribution of spin-clusters below Tf.
| 1 | |
| 2 | |
| 3 | |
| 4 | |
| 5 | |
| 6 | |
| 7 | |
| 8 | |
| 9 | |
| 10 | |
| 11 | |
| 12 | |
| 13 | |
| 14 | |
| 15 | |
| 16 | |
| 17 | |
| 18 | |
| 19 | |
| 20 | |
| 21 | |
| 22 | |
| 23 |