1. IntroductionThe wide interest in ferrite nanoparticles is due to their unique and unusual chemical and physical properties with their high surface activities. A key factor for improving the properties of these particles due to their miniature size lies in enhancing the fraction of their surface atoms. It is useful in many applications such as recording media, microwave devices, pigments, high frequency cores, high-density magnetic information storage, absorbents, and sensors.[1–3]
Nanomaterials are mostly considered as materials in which the sizes of the particles or crystalline are below 100 nm in at least one or more dimensions. On a nano scale, a huge fraction of the atoms exist at (or close to) the surfaces of particles, which causes the unique characteristics of materials. Nanomaterials each have a large surface-to-volume ratio thus often exhibit amazing properties that differ from bulk ones. This type of structure belongs to a large class of compound that has a spinel type of structure. The structural and magnetic properties of nanocrystalline ferrites are affected by a variety of factors including processing conditions, sintering temperature, precursor atmosphere, chemical composition, cation distribution in the tetrahedral (A) and octahedral [B] sites, grain size, voids, surface layers, and doping.[4–7]
Spinel ferrites are made up of a regular combination of oxygen with the general formula of (A)[B]2O4. A crystal structure of spinel ferrite with the Fd-3m space group has 56 atoms. It contains 32 oxygen anions; 8 of 64 tetrahedral (A-site) and 16 of 32 octahedral interstitial sites (B-site) are filled by metal cations. The A-site cations are present in the interstices between 2 interpenetrating FCC lattices, while the B site cations reside in the interstices among 4 interpenetrating FCC lattices.[8,9] This special structure allows different metallic ions to be introduced to change its properties such as magnetic, electronic and other properties considerably.[10,11] A multitude of studies have focused on NiFe2O4 doped with other metal ions that provide improved magnetic properties for applications in the industry and medicine.[12,13]
Recently, the effect of Mg-doping on NiCoZnFe2O4 was studied and the coercive field was reported to decrease as a result of Mg doping. The maximum saturation magnetization (Ms) is present at x = 0.05.[14] Wang et al. studied the structural and magnetic properties of Mg-doped Co spinel ferrite and they found that Ms of Co1−xMgxFe2O4/SiO2 ferrite decreases with increasing Mg content.[15] It was reported that with the increase of MgO doping in Ni1−xAxFe2O4 nanoparticles, both Ms and Hc increase to 51.53 (emu/g) and 98.64 (Oe), respectively.[16]
There are several studies focusing on the effects of other co-substituted ferrites. The influences of magnetic ion substitution such as Ni2+,[17] Mn2+,[18] Gd3+,[19] and Cr3+ [20] on structural, magnetic, electric, and dielectric properties of CoFe2O4 have been investigated. Nevertheless, several researchers have reported on non-magnetic ions such as Al3+,[21] Y3+,[22] Zn2+,[23] Cu2+ [24] or Cd2+ [25] substituting CoFe2O4 and very few detailed studies of the Mg2+. Magnesium ions with non-magnetic nature are known for achieving control over magnetic parameters in developing magnetic recording technology and they have a preference for strong B sites. Akther Hossain et al. observed that when the non-magnetic divalent cations such as Zn, Mg, are substituted for magnetic cations such as Ni, Co, Mn, the maximum magnetization (Ms) as well as the real part of the initial permeability (m = i) increases up to 50%.[26] Ni1−xMgxFe2O4 was synthesized by John Berchmans et al. using citrate gel process. They suggested that Mg2+ ions cause appreciable changes in the structural and electrical properties of the ferrites.[27]
Motivated by these studies, we investigate the effects of magnesium concentration on the structural, morphological and magnetic properties of Mg substituted Co–Ni ferrites synthesized using the co-precipitation method sintered at 900 °C for 10 h. The improvement mechanism of the structural and magnetic properties is analyzed in detail.
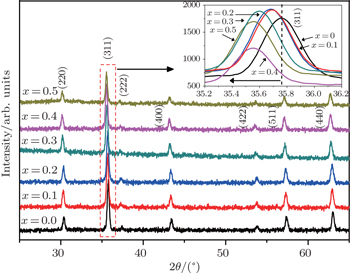
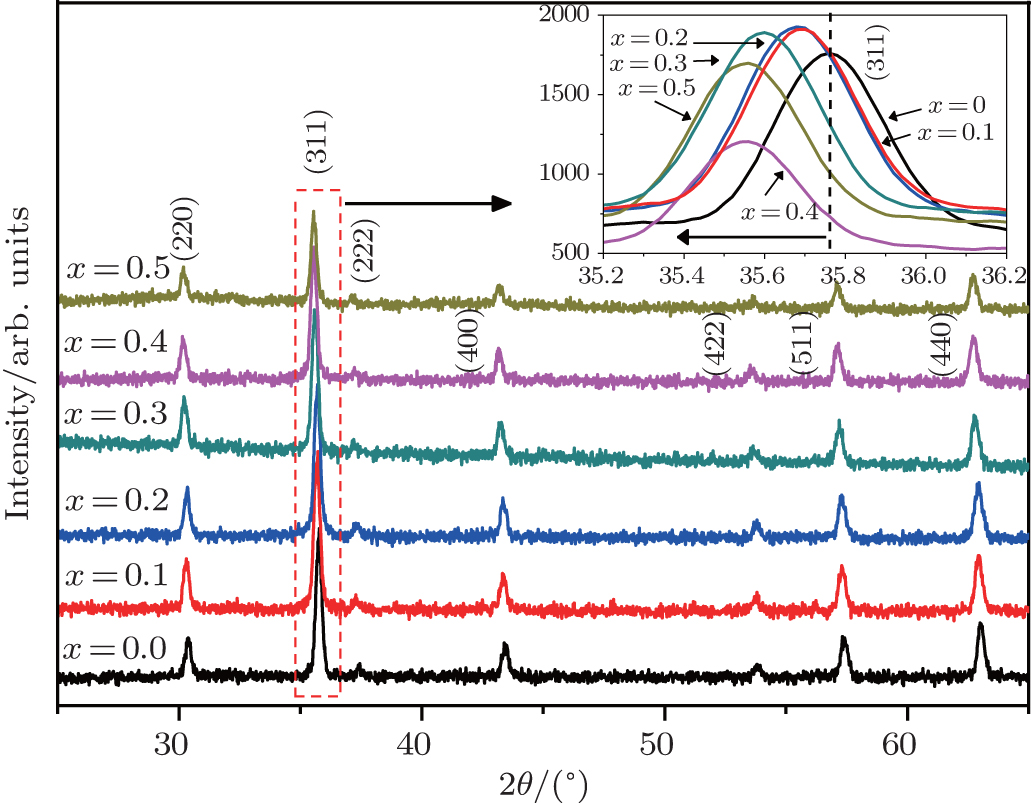
3. Results and discussionThe room temperature x-ray diffraction (XRD) patterns of samples are demonstrated in Fig. 1. The figure shows well-defined diffraction peaks and good crystallization in all samples. A single-phase cubic spinel structure can be indexed, for this pattern has no extra peaks such as α -Fe2O3. The diffraction pattern of the planes (220), (222), (311), (400), (422), (511), and (440) confirms the formation of a pure phase cubic spinel structure verified by the standard PDF cards (JCPDS NO. 01-088-0380). Referring to the inset in Fig. 1, the increasing of the Mg content in Co0.5Ni(0.5−x)Mg(x)Fe2O4 leads to a continuous shift in 2θ towards a lower angle, which is corresponding to the increase of lattice parameters. The shift in the intense (311) peak toward a lower angle from 35.778° for Co0.5Ni0.5Fe2O4 to 35.539° for Co0.5Mg0.5Fe2O4 due to the change in the content of Mg is attributed to the variation in the lattice constant, which is presented in Table 1. By increasing the content of Mg, the intense peak becomes narrower, which indicates a higher degree of crystallinity and a larger particle size. The sizes of ferrite nanoparticles are estimated using the broadening of the (311) peak and Debye–Scherrer’s equation[28] described as follows:

where
λ is the wave length of the x-ray radiation,
k is a constant taken as 0.98,
β is the full width at half maximum (FWHM) of line broadening, and
θ is the angle of diffraction. The sizes of Co
0.5Ni
0.5−xMg
xFe
2O
4 nanocrystallites are estimated to be in a range from ∼ 32 nm to ∼ 36 nm (Table
1). These nanoparticles are smaller than those reported by Raut
et al. (45 nm–49 nm)
[29] and Raju
et al. (100 nm).
[30] In addition, these nanocrystallines are small enough to be used in high-density recording media, thus obtaining the suitable signal-to-noise ratio.
Table 1.
Table 1.
 Table 1. Characteristic parameters for each composition at room temperature. .
| Co0.5Ni0.5−xMgxFe2O4 |
ν1/cm− 1 |
ν2/cm− 1 |
Crystallite size Dm |
d |
aexp/Å |
V/Å3 |
dx/(g/cm3) |
dB/(g/cm3) |
Porosity/% |
S/(m2/g) |
| Co0.5Ni0.5Fe2O4 |
594.95 |
398.55 |
32.8 |
2.511 |
8.328 |
577.55 |
5.393 |
4.223 |
21.70 |
43.44 |
| Co0.5Ni0.4Mg0.1Fe2O4 |
592.66 |
395.13 |
32.6 |
2.526 |
8.346 |
581.24 |
5.280 |
4.140 |
21.59 |
44.43 |
| Co0.5Ni0.3Mg0.2Fe2O4 |
591.52 |
390.56 |
32.7 |
2.515 |
8.343 |
580.66 |
5.207 |
4.056 |
22.10 |
45.14 |
| Co0.5Ni0.2Mg0.3Fe2O4 |
589.24 |
396.27 |
34.1 |
2.522 |
8.364 |
585.01 |
5.090 |
3.972 |
21.96 |
44.21 |
| Co0.5Ni0.1Mg0.4Fe2O4 |
586.95 |
397.41 |
34.5 |
2.525 |
8.374 |
587.28 |
4.993 |
3.889 |
22.11 |
44.62 |
| Co0.5Mg0.5Fe2O4 |
584.67 |
399.55 |
35.8 |
2.525 |
8.375 |
587.32 |
4.915 |
3.806 |
22.56 |
43.99 |
| Table 1. Characteristic parameters for each composition at room temperature. . |
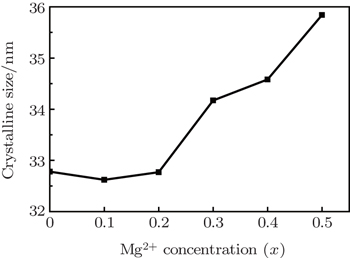
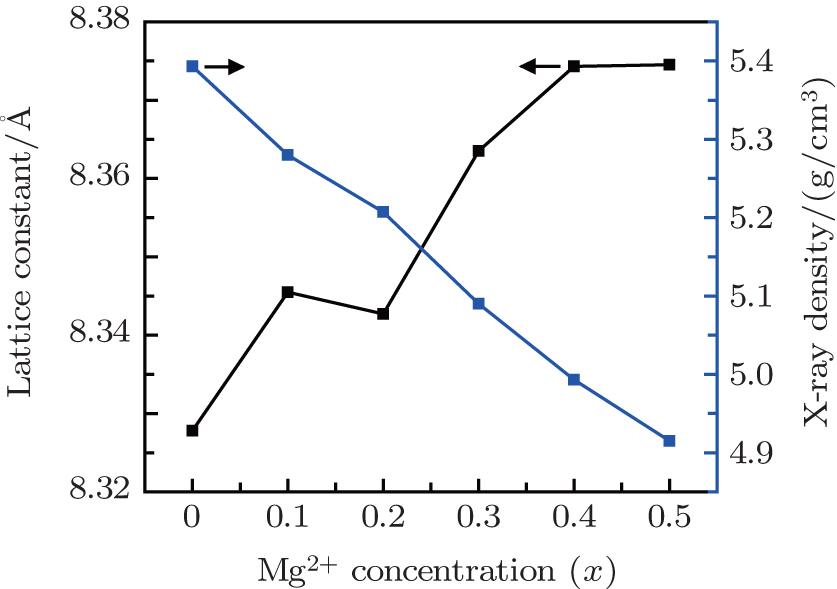
Figure 2 indicates that the crystallite size increases from ∼ 32.7 nm to ∼ 35.8 nm with increasing Mg2+ ion substitution. The replacement of Ni2+ (0.69 Å) ions in octahedral B sites by Mg2+ (0.72 Å) causes the expansion of the unit cell, resulting in larger lattice constants.[31,32]
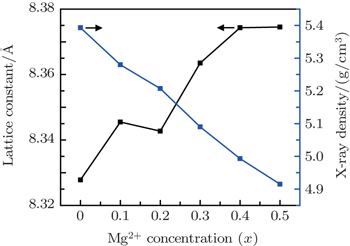
Vegard’s law is used to explain the relationship between Mg2+ substitution and lattice parameter.[33] The lattice constant (a), cell volume (V), and the x-ray density are calculated from the XRD spectra through using the following relations:


where
M is the molecular weight and
N is the Avogadro number. The values of lattice parameter
a (Å) calculated for the samples sintered at 900 °C are shown in Table
1.
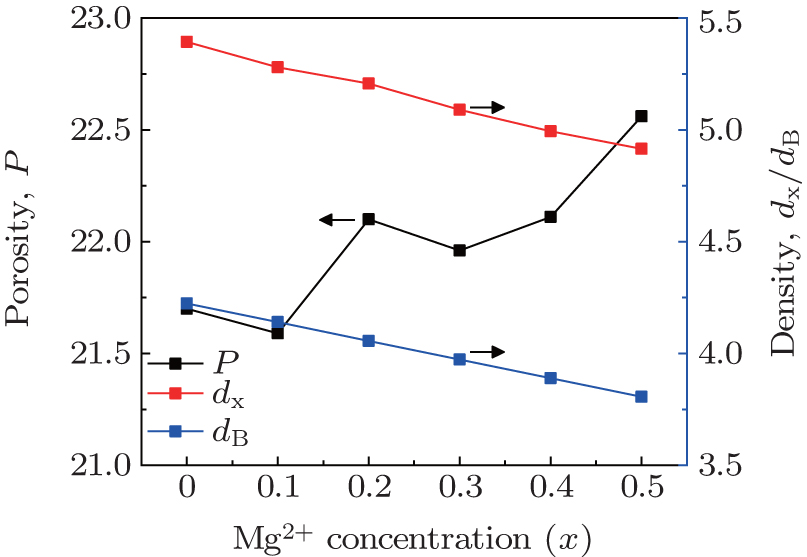
It is observed from Fig. 3 that the x-ray density exhibits a decreasing trend from 5.393 g/cm3 to 4.915 g/cm3 with increasing Mg2+ substitution. The atomic weight of Mg is 25.31 amu, which is smaller than the atomic weight of Ni (58.69 amu), therefore, leads to the decrease of dx with Mg2+ substitution increasing.
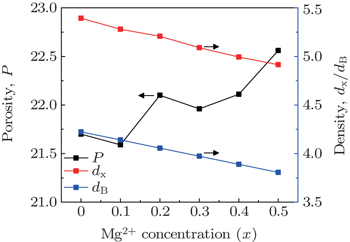
The diameter of particle and the bulk density are used to estimate the specific surface area (S) from the following relation[34]

where
D is the average crystallite size and
dB is the bulk density. The surface area (
S) varies from 43.34 m
2/g to 43.99 m
2/g with Mg
2+ content
x increasing. The bulk density ‘
dB’ of the sample is determined by the hydrostatic method. The magnitude of the bulk density,
dB is smaller than that of the
dx due to the presence of pores created during the sintering. The curves of bulk density and porosity are opposite as expected with Mg
2+ content. The percentage of porosity is calculated from the following relation:

where
dx and
dB are the x-ray density and bulk density, respectively. It is observed that the porosity increases from 21.70 to 22.56 with increasing Mg
2+ substitution as shown in Fig.
4. The increasing trend of porosity and lattice constant are inversely related to reducing the density of x-ray and bulk as expected.
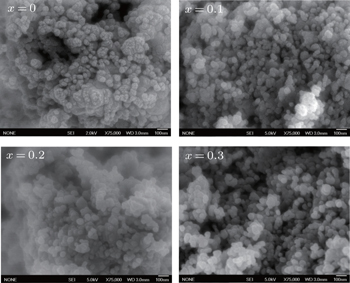
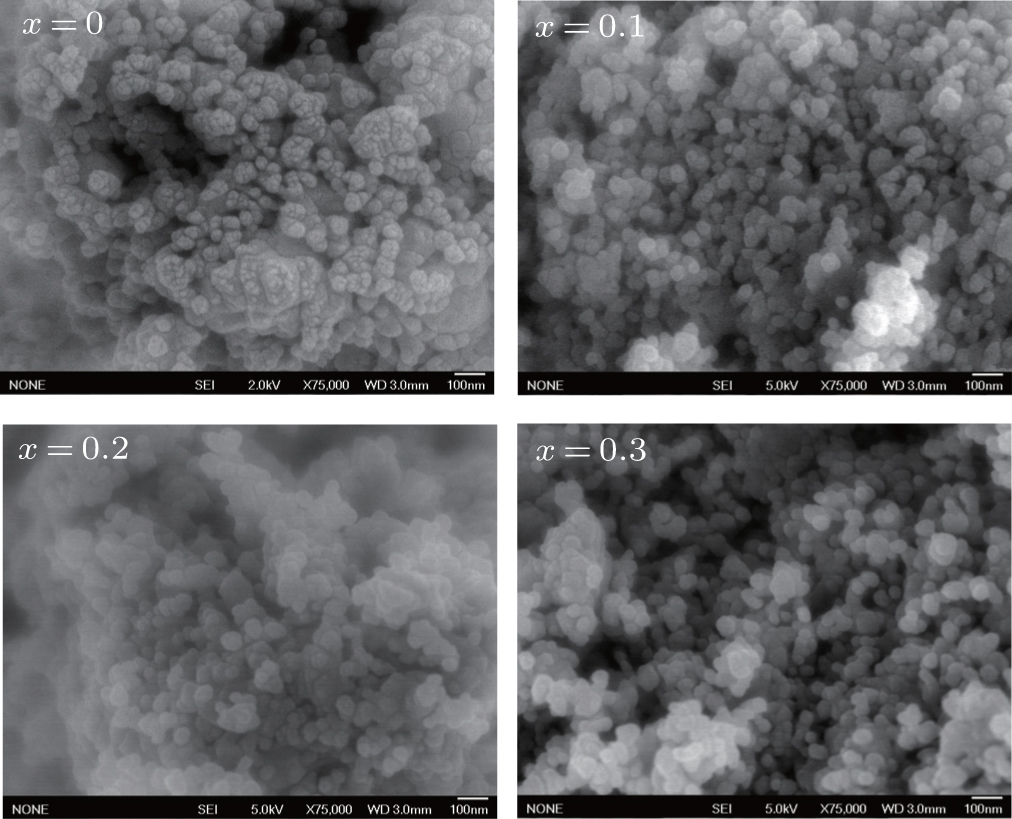
The field emission scan electron microscopy images of the co-precipitated Co0.5Ni0.5−xMgxFe2O4 ferrite samples sintered at 900 °C are shown in Fig. 5. As can be seen, the morphologies of these samples present regular shapes and dimensions. The average particle sizes of the samples for all the compositions, calculated using Image-J software are in a range of ∼ 35 nm to ∼ 80 nm. The surfaces of the ferrite samples appear to be rough and nanoparticles look like spheres in shape. The particles have no clear boundaries as they aggregate. The roughness of the surface may be due to the individual nanoparticles forming aggregates. The images indicate that the particles obtained by this synthesis method have homogenous morphology and uniform size, but partially agglomerate. The agglomeration is due to the slow growth of particles and also interactions existing between magnetic particles.
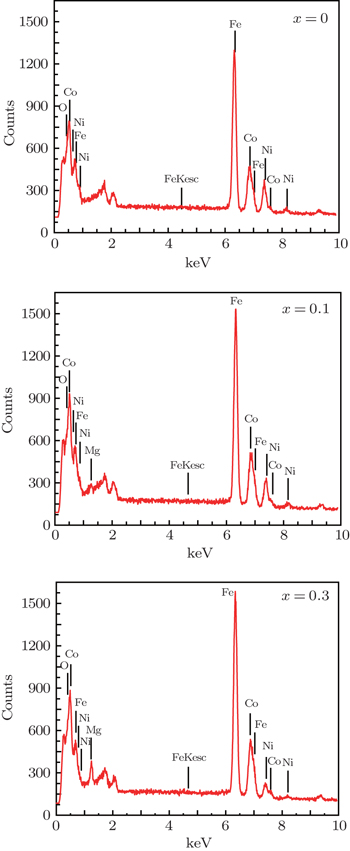
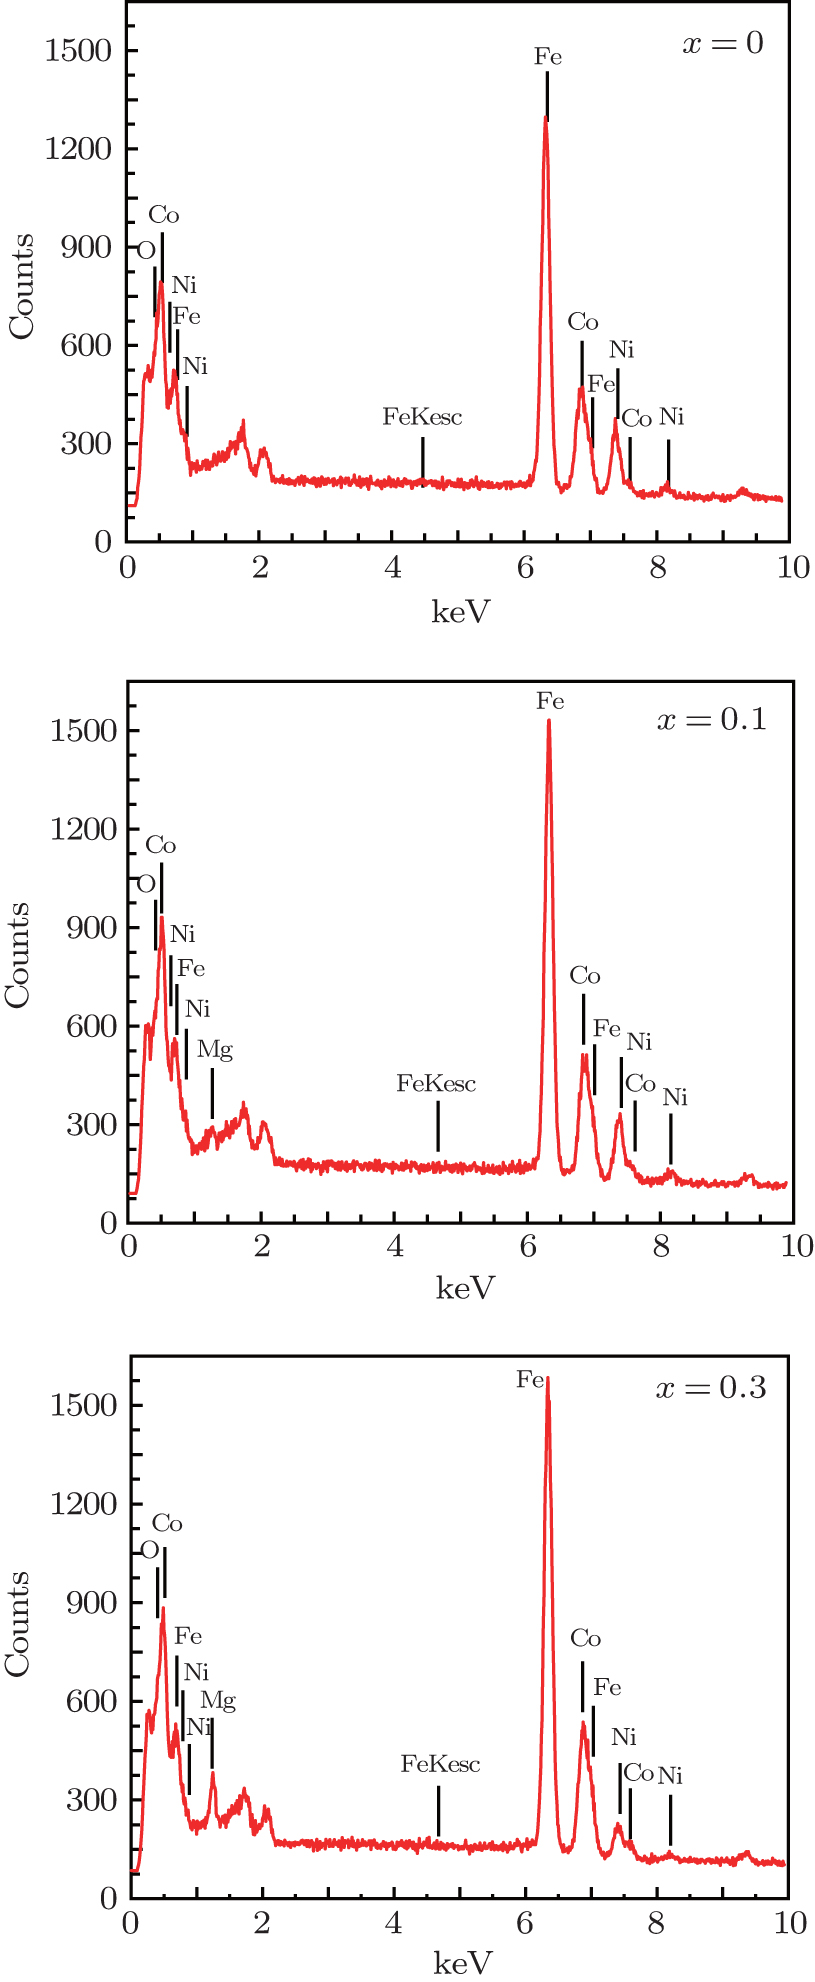
The EDX analyses (Figs. 6(a)–6(c)) of different compositions and various areas in the samples clearly reveal the existence of Fe, Co, Ni, Mg, and O elements. The occurrences of different atomic percentages of Ni and Mg confirm the different composition ratios of the samples which are listed in Table 2. The oxygen peak originates from the passivation of sample exposure to atmosphere during synthesis and characterization.
Table 2.
Table 2.
Table 2. Compositions of ferrite samples extracted from EDX analyses. .
| Composition |
Fe |
Co |
Ni |
Mg |
| Co0.5Ni0.5Fe2O4 |
1.92 |
0.58 |
0.50 |
– |
| Co0.5Ni0.4Mg0.1Fe2O4 |
1.93 |
0.53 |
0.45 |
0.09 |
| Co0.5Ni0.3Mg0.2Fe2O4 |
1.97 |
0.51 |
0.34 |
0.18 |
| Co0.5Ni0.2Mg0.3Fe2O4 |
1.98 |
0.51 |
0.22 |
0.29 |
| Table 2. Compositions of ferrite samples extracted from EDX analyses. . |
The infrared spectrum provides information about the positions of ions in the crystal and the crystal vibration modes, simplifying the probing different ordering phenomena. The formation of Co0.5Ni0.5−xMgxFe2O4 is studied by Fourier transform infrared (FTIR) spectra at room temperature in a frequency range of 200 cm−1–4000 cm− 1 and the results are shown in Fig. 7. The bands appearing at the higher wave numbers (ν1 = 585 cm−1–595 cm− 1) and at the lower wave numbers (ν2 = 390 cm−1–400 cm− 1) are assigned to the tetrahedral complexes (Mtet ↔O) and octahedral complexes (Moct ↔O), respectively.[35] The vibration mode of the tetrahedral cluster is normally higher than that of the octahedral cluster which could be attributed to the shorter and the longer bond length of each cluster. The observed absorption pattern reveals the formation of the spinel lattice, even a minimal intense band at around 550 cm− 1 is sufficient for the spinel phase formation.[36] Hence, we assume that in the precipitation process aging the prepared mixture may lead to some degree of the spinel phase. The dried powders show characteristic bands at about 3400, and in ranges of 2850 cm−1–3000 cm− 1, 1400 cm−1–1700 cm− 1, and 1100 cm−1–1300 cm− 1, which are ascribed to the O–H group symmetric vibration, the stretching of the C–H bands, carboxyl group (COO−) and group symmetric vibration, respectively.[37] The combustion process causes all the hydroxyl, carboxyl and nitrate groups to appear with less intensity due to the generation of high temperature.
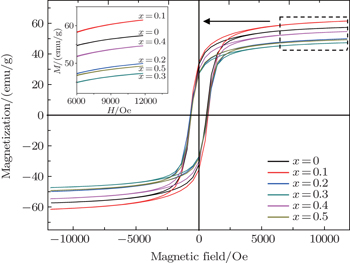
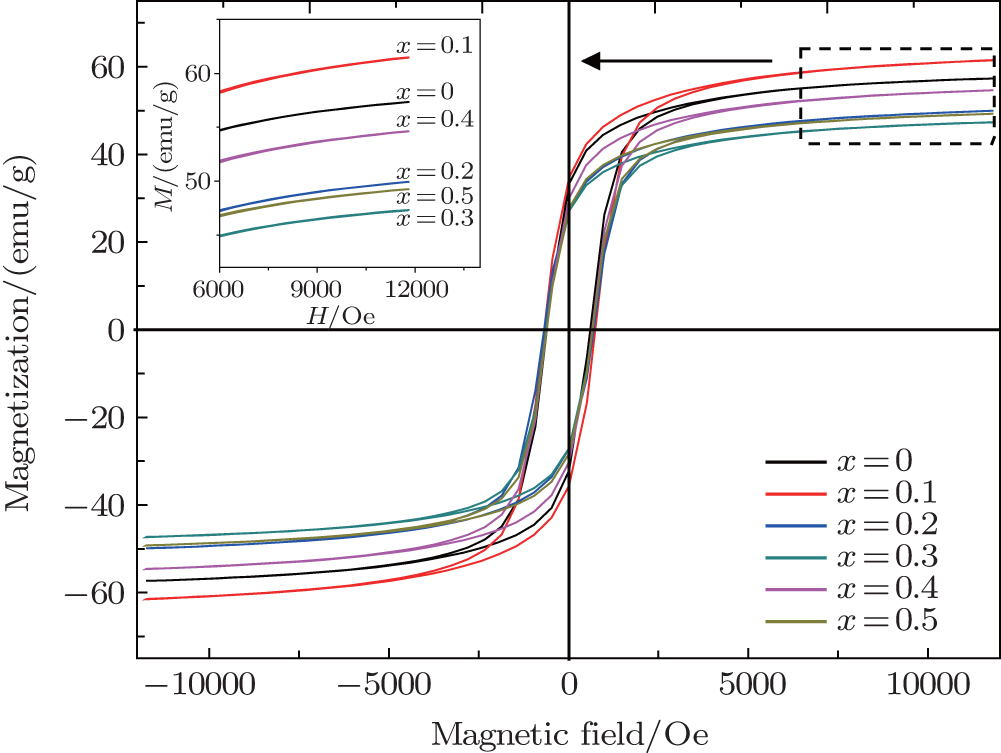
Hysteresis loops for Co0.5Ni0.5−xMgxFe2O4 (0.0 ≤ x ≤ 0.5) ferrite samples are measured in order to obtain magnetic parameters as shown in Fig. 8. The values of maximum magnetizations for the as-prepared samples of Co0.5Ni0.5Fe2O4 and Co0.5Mg0.5Fe2O4 are found to be 57.35 emu/g and 49.25 emu/g, respectively. The cation distribution at the A- and B-sites, the super-exchange interaction and the non-collinear nature of B-site moments strongly affect the magnetizations in ferrites.
The magnetic parameters in Table 3 show that the value of Ms increases with increasing Mg substitution up to x = 0.1, thereafter it starts to decrease with increasing Mg substitution. This influence may be attributed to the weakening of super-exchange ion interaction at A site and B site due to non-magnetic Mg2+ ions.[38] The preference of Mg for both A- and B- sites can be attributed to the tendency of Mg2+ ions occupying A-sites, corresponding to Fe3+ ions migrating to the B-site. The replacement of the Fe3+ ion which has a higher magnetic moment than the Ni2+ ion results in the increase of the magnetic moment of the B sub-lattice.[39] Roy and Bera have reported a similar behavior of magnetization variation with Mg substitution.[40] It is also seen from Table 3 that the coercivity of the ferrite increases with Mg concentration increasing, the maximum value occurring at x = 0.1. The decrease of Hc is due to the increase of average grain size and the immoderate nonmagnetic ions entering into the lattices may result in the energy reduction of magnetocrystalline anisotropy.
Table 3.
Table 3.
Table 3. Room-temperature characteristic magnetic parameters for each composition. .
| Co0.5Ni0.5−xMgxFe2O4 |
Hc/Oe |
Mr/(emu/g) |
Maximum M/(emu/g) |
Mr/Ms |
Magnetic moment |
| Co0.5Ni0.5Fe2O4 |
603.26 |
32.43 |
57.35 |
0.57 |
2.41 |
| Co0.5Ni0.4Mg0.1Fe2O4 |
684.11 |
34.05 |
61.49 |
0.55 |
2.55 |
| Co0.5Ni0.3Mg0.2Fe2O4 |
681.12 |
27.09 |
49.93 |
0.54 |
2.04 |
| Co0.5Ni0.2Mg0.3Fe2O4 |
621.27 |
26.41 |
47.34 |
0.56 |
1.90 |
| Co0.5Ni0.1Mg0.4Fe2O4 |
608.17 |
29.13 |
54.62 |
0.53 |
2.16 |
| Co0.5Mg0.5Fe2O4 |
606.17 |
26.83 |
49.25 |
0.54 |
1.92 |
| Table 3. Room-temperature characteristic magnetic parameters for each composition. . |
The values of magnetic moment (ηB) can be calculated from the experimental hysteresis data by using the maximum magnetizations and the molecular weights of different samples.[41] The data reported in Table 3 obviously show that the magnetization and magnetic moment increase with doping level x till x = 0.1. Both Ms and ηB parameters start to decrease as the Mg content increases above x = 0.1, as expected since the Mg2+ ions with a zero magnetic moment tend to replace Ni2+ ions with a magnetic moment of 2.3 BM, at the octahedral sites. The variation of ηB with composition is explained on the basis of Neel’s two-sublattice model of ferrimagnetisms.[42,43] In this model, the net magnetization ηB(x) in BM is calculated from the following equation:

where MA and MB are the sublattice magnetic moments at A and B sites, respectively. The higher Neel’s magnetic moment
ηB(
x) than
ηB (Table
2) is attributed to the increase of the exchange interaction of the B-site on the expense of that of the A-site.
[39] A similar behavior for Mg-substituted NiZn ferrites is reported by Bobade
et al.[44] The achieved squareness ratio (
Mr/
Ms) of above 0.50 clearly indicates that the synthesized materials are in a single magnetic domain
[45] and that they benefit the memory device application. The calculated squareness ratios for Mg-substituted Ni–Co ferrites are listed in Table 3. The sample with composition Co
0.5Ni
0.4Mg
0.1Fe
2O
4 is appropriate for use in a high-density recording medium where high maximum magnetization and coercivity above 600 Oe are desirable.
[46] 


 , Othaman Z, Hussin R, Ati Ali A, Samavati Alireza, Dabagh Shadab, Zare Samad]