Complete low-frequency bandgap in a two-dimensional phononic crystal with spindle-shaped inclusions
Wang Ting1, 2, †, , Wang Hui2, Sheng Mei-Ping1, Qin Qing-Hua2
School of Marine Science and Technology, Northwestern Polytecnical University, Xi’an 710072, China
Research School of Engineering, Australian National University, Acton, ACT 2601, Australia


† Corresponding author. E-mail: WT323@mail.nwpu.edu.cn

Project supported by the China Scholarship Council.

Abstract
Abstract

A two-dimensional phononic crystal (PC) structure possessing a relatively low frequency range of complete bandgap is presented. The structure is composed of periodic spindle-shaped plumbum inclusions in a rubber matrix which forms a square lattice. The dispersion relation, transmission spectrum and displacement field are studied using the finite element method in conjunction with the Bloch theorem. Numerical results show that the present PC structure can achieve a large complete bandgap in a relatively low frequency range compared with two inclusions of different materials, which is useful in low-frequency noise and vibration control and can be designed as a low frequency acoustic filter and waveguides. Moreover, the transmission spectrum and effective mass are evaluated to validate the obtained band structure. It is interesting to see that within the band gap the effective mass becomes negative, resulting in an imaginary wave speed and wave exponential attenuation. Finally, sensitivity analysis of the effect of geometrical parameters of the presented PC structure on the lowest bandgap is performed to investigate the variations of the bandgap width and frequency.

1. Introduction

Phononic crystals(PCs) are artificial periodic composite structures which can efficiently control the propagations of sound waves with frequencies in a range from a few hertz to several megahertz.[1,2] In such a medium, elastic waves within some specific range of frequency can be completely prohibited from propagating in the periodic structure and this forbidden frequency range is known as the phononic bandgap. Over the past two decades, a great deal of attention has been paid to the achievement of complete low-frequency bandgaps of PCs by improving their periodic microstructures,[37] because of their unique physical properties and potential engineering applications such as vibration isolator, frequency filter and acoustic mirrors.[812] Studying the bandgap characteristics of PC could help better understand the propagations of sound and vibration in such a heterogeneous medium.

To apply PCs to noise and vibration control, tuneable complete bandgaps in the low-frequency range are the major concern. Many of the studies have been carried out with various periodic structures of PCs. For example, Yao et al. investigated the Lamb waves in a two-dimensional (2D) PC plate with anisotropic inclusions.[13] They found that the complete bandgap can be tuned by changing the orientation of anisotropic inclusion. Yu et al. studied the influence of microstructure on the bandgap using a 2D PC composed of periodic slotted tubes with the internal rib structure in air matrix and revealed that the size of the internal rib structure has significant influence on both the lower edge and the upper edge of the lowest bandgap.[14] Subsequently, they investigated the bandgap properties of a 2D PC with periodic neck structures, which could generate several complete bandgaps within a frequency range from 2 kHz to 17 kHz.[15] Xu et al.[16] considered a 2D hierarchical PC consisting of periodic square lattice with multiple scatterers. Their results showed that the hierarchical structure possesses tuneable complete bandgap features and these interesting features are favourable for the applications of insulation and vibration attenuation. Li et al.[17] presented a 2D PC with periodic Jerusalem slot in air matrix, and a complete bandgap in the frequency range from 2 kHz to 11 kHz is observed. More studies of the effects of structure parameters on bandgaps of different PCs can be found in Refs. [12], [18]–[23]. It should be noted that most studies of bandgaps of the PCs concentrated on the high frequency range from kHz to MHz, while in the field of vibration isolation and noise reduction, bandgaps in the low-frequency range are more meaningful. Moreover, lots of previous studies were devoted to the configuration in which the axes of the inclusions are perpendicular to the surface of the PC, while studies on the configuration with axes parallel to the surface as indicated in Ref. [24] were seldom reported, although PCs with this type of configuration have more potential applications in structural construction inspection, reliable non-destructive evaluation and sensing systems.[25]

In the present paper, a 2D PC possessing a complete bandgap of low frequency is presented. The PC is composed of spindle-shaped inclusions embedded periodically in a host rubber material. The axes of the spindle-shaped inclusions are placed parallelly to the surfaces of the crystal. Making use of the finite element method (FEM) in conjunction with the Bloch theorem,[26,27] the propagation properties including its dispersion relations, transmission spectrum, effective mass and displacements fields are assessed. Meanwhile, sensitivity analysis of the effect of geometry parameters of the spindle-shaped inclusions on the lowest bandgap is conducted. This study also includes their influences on the band structure and the displacement field distributions of the Lamb modes so that relationships can be revealed between the band structure and the geometrical parameters.

2. Model and method

As shown in Fig. 1(a), an infinite PC structure considered here is composed of periodic spindle-shaped inclusions embedded in a host rubber matrix. Figure 1(b) displays a typical square lattice with side length a. The structure is assumed to be infinite in the z direction so that a plane strain model can be used in our analysis. According to the periodicity of the PC structure, a 2D representative unit cell displayed in Fig. 1(b) is taken such that an infinite system can be produced by repeating the unit along the x direction and y direction separately. In the representative unit cell, the spindle-shaped inclusion is located in the centre of the square lattice with side height b, central height c, and half width d. The materials P and R (see Fig. 1(a)) represent the plumbum inclusion and the rubber matrix, respectively, and the corresponding material parameters used in this work are as follows:[18,28]

plumbum: ρpb = 11600 kg/m3, Epb = 40.8 GPa, μpb = 0.369;

rubber: ρru = 1300 kg/m3, Erb = 0.117 MPa, μrb = 0.47.

The governing equations for elastic wave propagation in homogeneous solids are given by

where ρ is the mass density, t is the time, ui is the i-th component of the displacement vector u(r) with position vector r, cijkl are the elastic constants, and xj (j = 1,2,3) are the corresponding coordinate variables x, y, and z, respectively.

Making use of the Bloch theorem, the displacement vector of a periodic PC system can be expressed as

where uk(r) is a periodic vector with the same periodicity as the crystal lattice, and k = (kx,ky) is the wave vector limited to the first Brillouin zone of the repeated lattice.

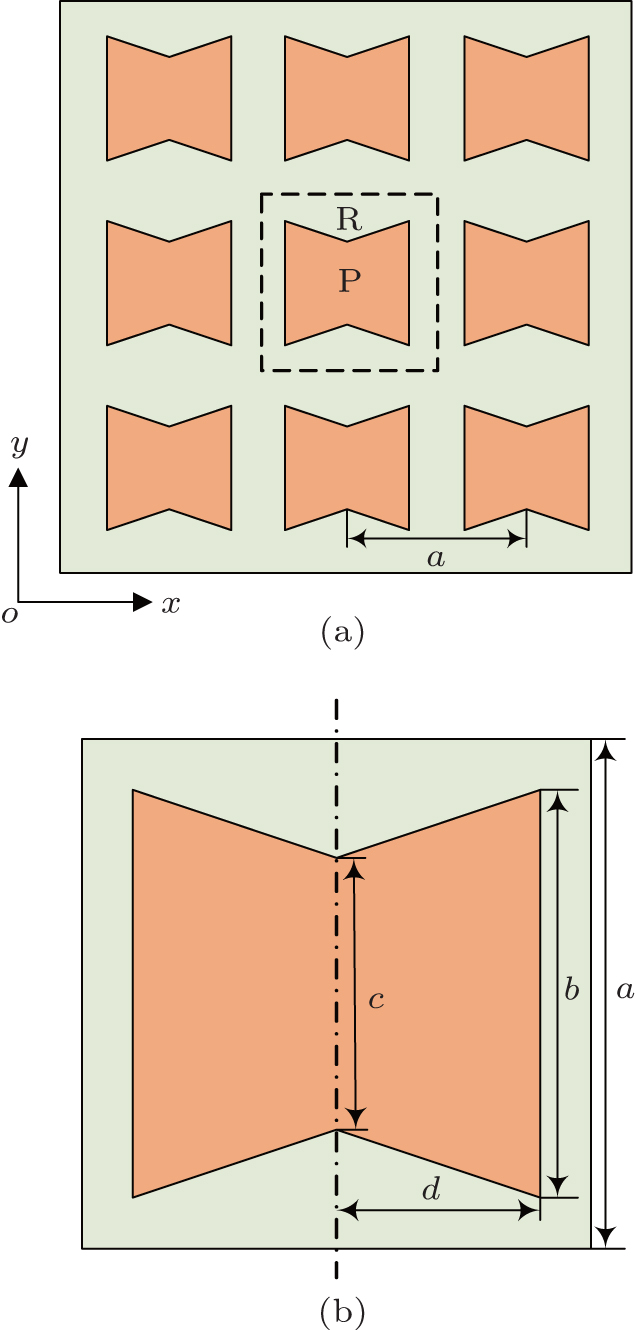
Fig. 1. (a) Schematic view of the cross-section of 2D PC. (b) A representative unit cell with spindle-shaped inclusion.

With the FEM, the discrete form of the eigenvalue equations in the representative unit cell can be written as

where U is the displacement vector at the discrete node, K and M are respectively the stiffness and mass matrices of the unit cell, and ω is the circular frequency.

Considering the periodicity of the structure, the following Bloch periodic boundary condition should be applied to the unit cell based on Bloch theorem:

where a = (ax,ay) is the lattice basis vector, with ax = ay = a.

In this study, we solve the eigenvalue equation (3) with the FEM software COMSOL Multiphysics to illustrate the effects of the spindle-shaped inclusion on the band structures of the 2D PCs. The structural mechanics module operated under 2D plane strain mode is chosen for the eigenvalue calculation. Bloch periodic boundary conditions are imposed on the two opposite boundaries of the unit cell. The refined triangular mesh with Lagrange quadratic elements provided by COMSOL is used to discretize the unit cell to obtain convergent results. Eigenfrequency analysis is chosen as the solving mode and the direct MUSR is used as a linear system solver. With a given value of Bloch wave vector k, a group of eigenfrequencies and eigenmodes can be obtained by solving the eigenvalue problem. Sweeping the value of Bloch wave vector k along the boundary of the first reduced Brillouin zone and repeating the calculation, we can obtain the dispersion relation curves of the PC.

Besides, to verify the results of the dispersion curves and bandgaps, the transmission spectrum of a finite periodic PC system including multiple unit cells along the x direction is also calculated with COMSOL simulation. In the system shown in Fig. 2, a total of 16 unit cells are included, and simultaneously two layers with homogenous material which is the same as the matrix material of the unit cell are placed on the left and right sides of the PC system to serve as the input and output domains respectively. During the simulation, an incident displacement incentive condition such as plane wave with single-frequency is applied at the left boundary of the input domain and propagates along the x-direction. In the y direction, the Bloch periodic boundary condition is still imposed on the top and bottom surfaces of the system to represent infinity along the y direction. The corresponding transmitted displacement can be recorded on the right boundary of the output domain to evaluate the transmission spectrum defined as follows:

where uin and uout are the values of the incident displacement and transmitted displacement, respectively. By varying the excitation frequency of the incident displacement, the transmission spectrum can be obtained.

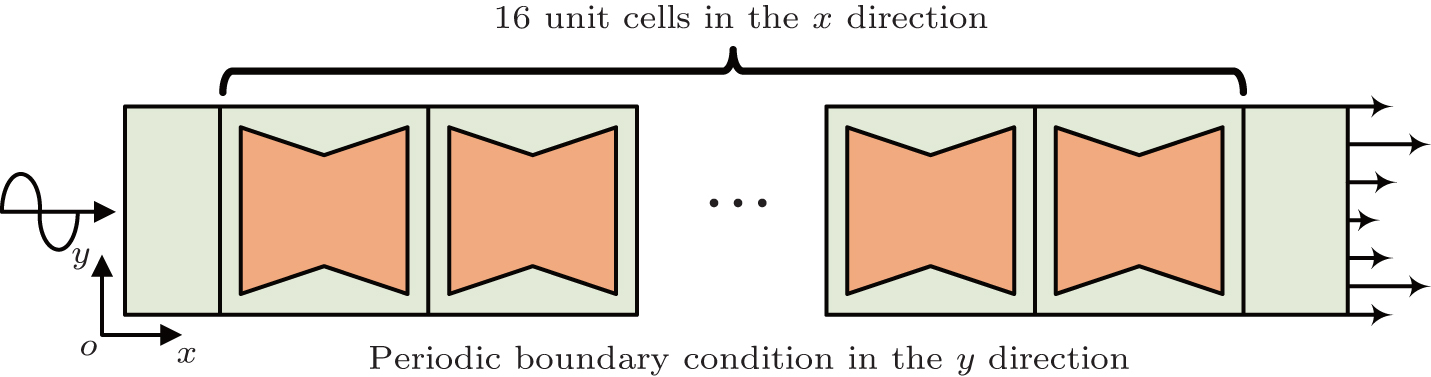
Fig. 2. Finite system for the calculation of transmission spectrum.
3. Results and discussion
3.1. Band structures of the present PC

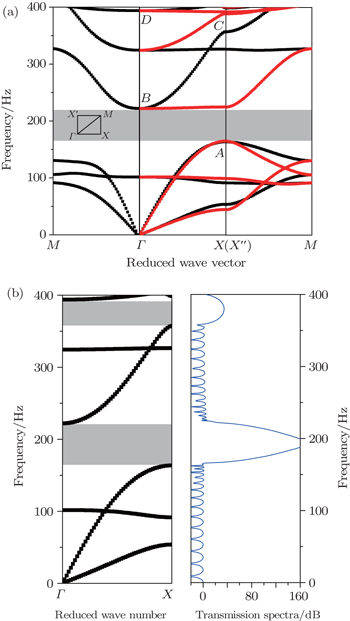
In this subsection, numerical results are presented to demonstrate the bandgap characteristics of the present PC structure, which has a spindle-shaped plumbum inclusion embedded in the rubber matrix to form a square lattice. Figure 3(a) shows the dispersion relations of the present PC in a frequency range from 0 Hz to 400 Hz, and several bandgaps. Without loss of generality, we set the lattice constant a = 30 mm. Based on the lattice constant, a set of moderate parameters for the inclusion is chosen to be b = 18 mm, c = 16 mm, and d = 11 mm. Since the asymmetry of the spindle inclusion is out of 90° degree, the wave vector should sweep the first Brillion zone in two different ways, i.e., ΓXMΓ and ΓX′MΓ. It can be seen that the proposed PC possesses a complete low-frequency bandgap from 163 Hz to 222 Hz (between the second and fourth band), in which waves from different directions cannot propagate through this structure. The relative gap width of the complete bandgap is nearly 15%. Also, it is obvious that there exists an oriented band gap ranging from 357 Hz to 393 Hz along the ΓX direction of the irreducible Brillouin zone.

To validate the band structure, figure 3(b) displays a comparison between the dispersion relations of the present 2D PC along the ΓX direction and the corresponding transmission coefficient spectrum for plane wave propagating in the finite system given in Fig. 2. It can be observed that in the left picture of Fig. 3(b), there are two band gaps, i.e., the complete band gap ranging from 163 Hz to 222 Hz and an orientational band gap ranging from 357 Hz to 39 Hz; while in the right picture, there is a large attenuation (> 100 dB) in the frequency range from 163 Hz to 222 Hz in the transmission spectrum, and its location is in reasonable consistence with the largest bandgap in the left figure of Fig. 3(b). Moreover, a narrow dip with slight attenuation (> 30 dB) in the transmission spectrum corresponds to the narrower bandgap from 357 Hz to 393 Hz. The formation of the slight dip is because the interaction of scattered waves and reflected waves from the other directions and the interactions of these waves with the periodic boundaries decrease as the wave propagates along the finite system.

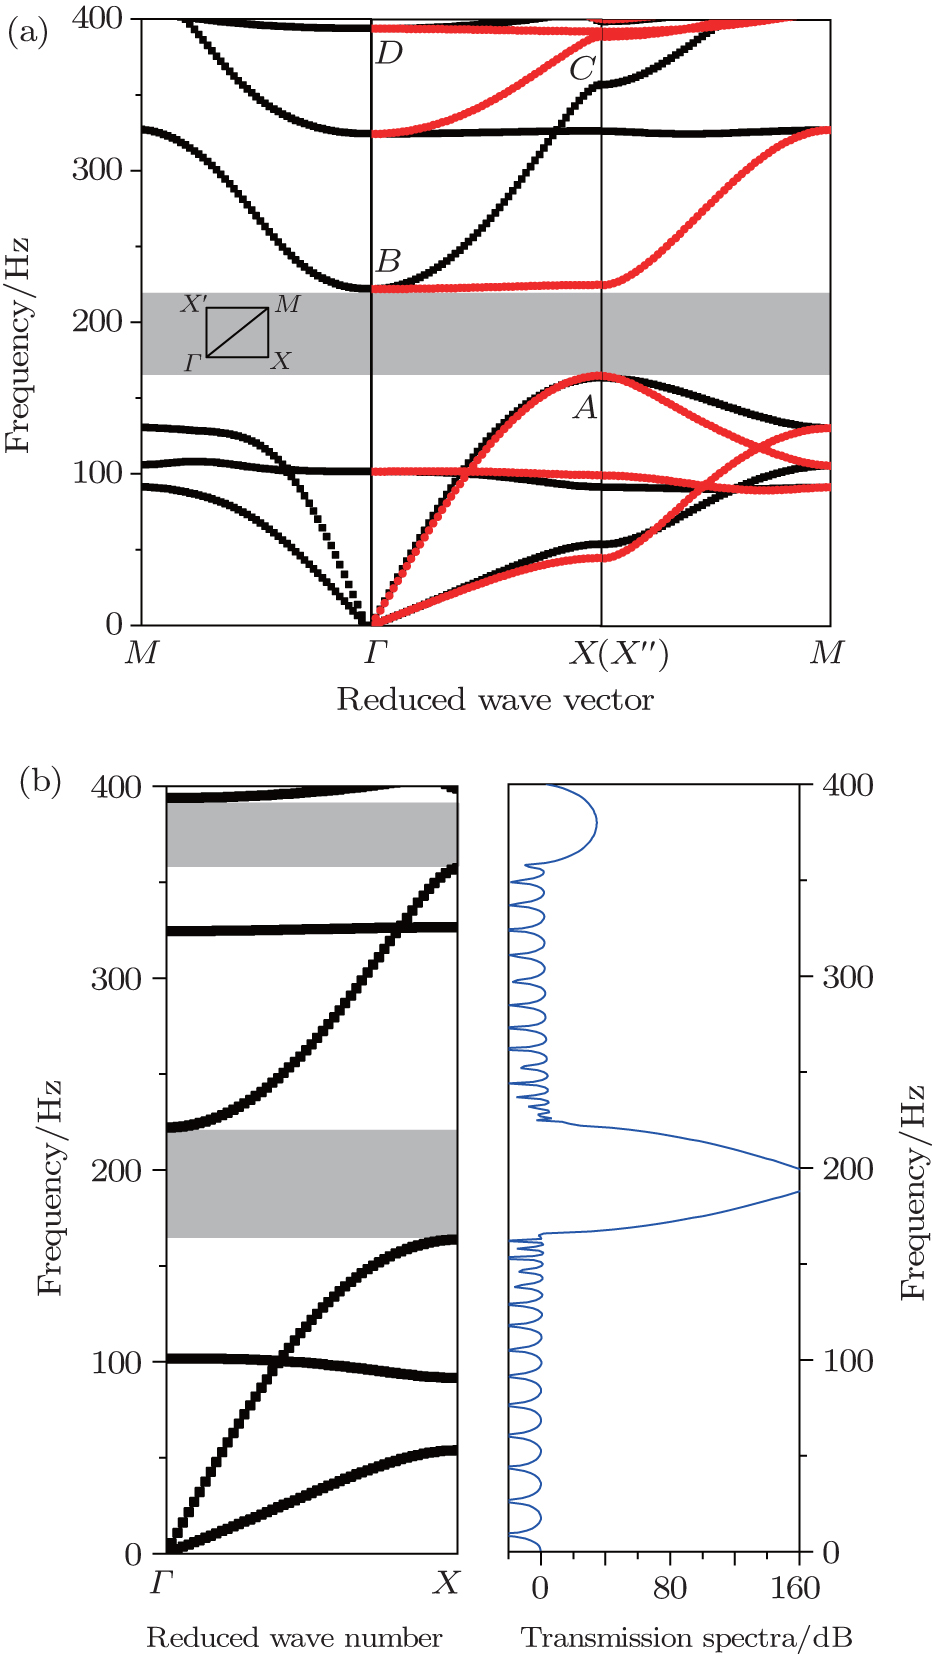
Fig. 3. (a) Dispersion relation of the 2D PC with a = 30 mm, b = 18 mm, c = 16 mm, and d = 11 mm. (b) Comparison between the dispersion relation along the ΓX direction and the transmission spectrum of the finite periodic structure with 16 unit cells.

In order to better understand the physical formation mechanism of the bandgaps in the proposed PC structure, the eigenmodes marked as A, B, C, D in Fig. 3(a) are illustrated in Fig. 4. The colour map in Fig. 4 denotes the magnitude of the total displacement field, and red and blue represent respectively the maximum and minimum quantities. From Fig. 4(a) it can be seen that the arrows in mode A, which corresponds to the lower edge of the complete bandgap, denote the motion of the material in the upper and down regions along the same x-negative direction, then turn around on the left side of the inclusion, get through the inclusion, and finally disperse on the right side of the inclusion. The vibration mainly concentrates at the inlet and the outlet as the arrows get through the inclusion. Unlike mode A, mode B in Fig. 4(b) corresponds to the upper edge of the complete band gap. For such a case, the unit cell is mainly divided into two parts: the lateral part which is the upside and downside matrix regions outside the inclusion and the central part which includes the inclusion region and the left and right matrix regions outside the inclusion. It is obvious that the vibration is the shearing motion of the matrix with the spindle-shaped inclusion remaining stationary in the whole process. The vibration of the matrix is axisymmetric and is along the x-positive direction. So it can be concluded that the formation of the complete band gap is mainly attributed to the recycling motion of the matrix around the inclusion and the shearing motion of the upside and downside matrix outside the inclusion. Figure 4(c) shows mode C corresponding to the lower edge of the orientational bandgap along the ΓX direction. This vibration concentrates on two specific sectional matrix sides: upside and downside of the inclusion. In Fig. 4(d), the displacement field of mode D corresponding to the upper edge of the orientational bandgap is the torsional movement of the matrix around the inclusion. Therefore, the occurrence of the orientational bandgap is attributed to the local energy centralization and the torsional motion of the matrix.

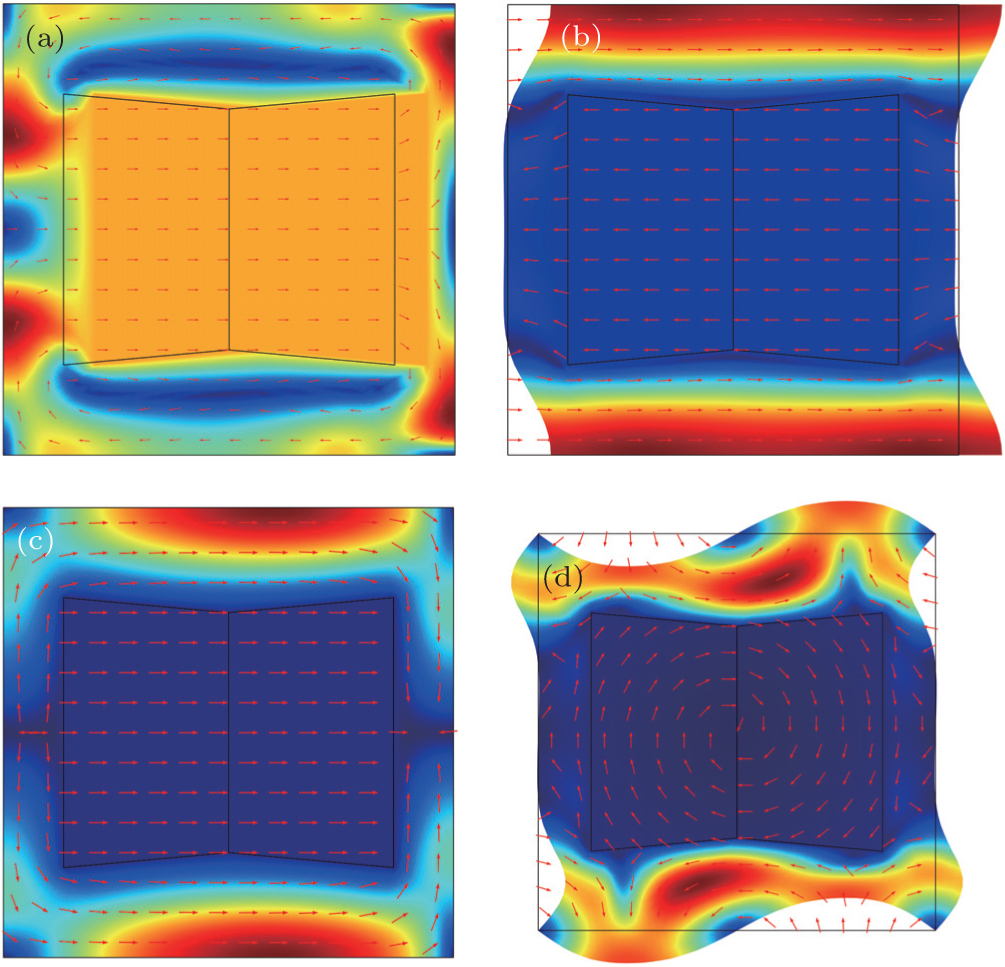
Fig. 4. Eigenmode shapes and displacement fields of (a) mode A, (b) mode B, (c) mode C, and (d) mode D.

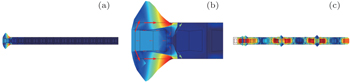
To better understand the wave propagation through the PC, the stress field of the finite system is shown in Fig. 5 in and out of the complete band gap. Figures 5(a) and 5(b) display the whole schematic view and the local schematic view of the stress field of the finite system in the complete band gap at 200 Hz respectively, and figure 5(c) demonstrates the stress field out of the complete band gap at 100 Hz. The red arrow denotes the motion of the matrix and the inclusion. It can be seen that in Fig. 5(a) the wave cannot propagate through the finite system and attenuates quickly at the first unit cell. Figure 5(b) shows that the matrix deforms diagrammatically in the plane and the wave just scatters at the first unit cell and then attenuates to zero. In Fig. 5(c), at a frequency of 100 Hz, the wave induces the finite system to vibrate in the x direction and deform in the plane, and then propagate through the whole system. With this knowledge, we could better understand the wave propagation in and out of the complete band gap and design the wave filter as desired.

Fig. 5. (a) The whole schematic view of the stress field at 200 Hz within the complete band gap of the finite system. (b) The local schematic view of panel (a). (c) The stress field out of the pass band gap of the finite system at 100 Hz.
3.2. Effective mass of the PC

The analysis frequency range is focused on low frequency, so the wavelength, compared with the unit cell, is very large. If the periodic model is treated as an equivalent elastic solid, the effective material parameters based on the homogenization concept can be used to characterize the properties of the PC. The average of local fields, including the local stress σαβ, strain εαβ, forces Fα, and displacement uα, is imposed on the external boundary of the representative volume element as[29]

The over bending line is the average field. The PC proposed in this article is a 2D system, and the constitutive equation in principal axes can be expressed as

with for α,β = 1,2 and representing the effective stiffness tensor. Based on the average fields, the equation of motion can be written as

where ρeff is the effective mass density, which can be calculated from Newton’s second law as follows:

All the average fields are obtained by using the commercial FEM software. And the effective mass density versus frequency in the transmission direction is plotted in Fig. 6.

Fig. 6. Effective mass versus frequency of the PC.

It can be seen that the effective mass changes dramatically as frequency increases. At 166 Hz, the effective mass approaches to the positive infinity and then falls down to the negative infinity, which means that there is a step change at this frequency. Moreover, the effective mass becomes negative in a frequency range of 166 Hz–213 Hz, which coincides with the band gap shown in Fig. 3(b). Substituting Eq. (8) into Eq. (9) with the harmonic plane wave uα = U ej(k·rωt) being incident on the PC along the ΓX direction, with k and r being the wave vector and position vector, respectively, the eigenvalue can be obtained from the following equation:

For nontrivial solution for {uα,uβ}T, we set the determinant of the coefficient matrix to be zero. And the wave speed can be obtained from the following expressions:

Within the low frequency band gap where the mass density becomes negative while and are positive, both longitudinal and transverse waves will decay exponentially through the PC because the wave speed is imaginary. The negative effective mass and the vibration field give a good explanation of the ability to prohibit the wave propagation in a specific frequency range.

3.3. Effect of the geometry parameters

To investigate the lowest bandgap in the proposed PC more deeply, effects of the geometry parameters of the unit cell on the variations of the bandgap width and frequency are studied. From Subsection 3.1 it follows that for the ΓXMΓ road and the ΓX′MΓ road, their low frequency complete band gaps are the same. And the crucial route is the ΓX(X′) part. So the geometry parameter investigation is conducted along the ΓX part.

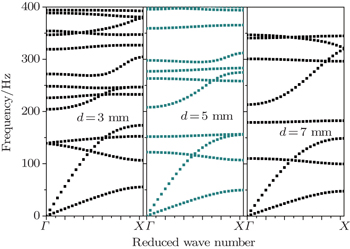
Firstly, assuming the spindle’s centre height c = 16 mm and the side height b = 18 mm, the effect of the spindle width d on the first bandgap is shown in Fig. 7. It can be seen that the curve of the upper edge of the first bandgap has a dip at d = 7 mm while the shape of the lower edge is like a groove as the spindle width becomes large. The location of the first bandgap drops into a lower frequency range and then climbs up to a higher frequency range. The gap width of the first bandgap reaches a minimum value when d = 14 mm. The occurrence of the dip of the upper edge is interesting, so it is essential to see what happens when the width d is equal to 7 mm. The dispersion relations of the band structure with different d values are given in Fig. 8. As shown in Fig. 8, when d changes from 3 mm to 7 mm, the fourth band climbs up to a higher frequency and the second band comes down to a lower frequency range, and finally they deviate from each other. As a result, a lower bandgap in the lower frequency range appears, owing to the interaction between the second band and the fourth band. The lower bandgap has a significant meaning in aspects of low-frequency noise and vibration control.

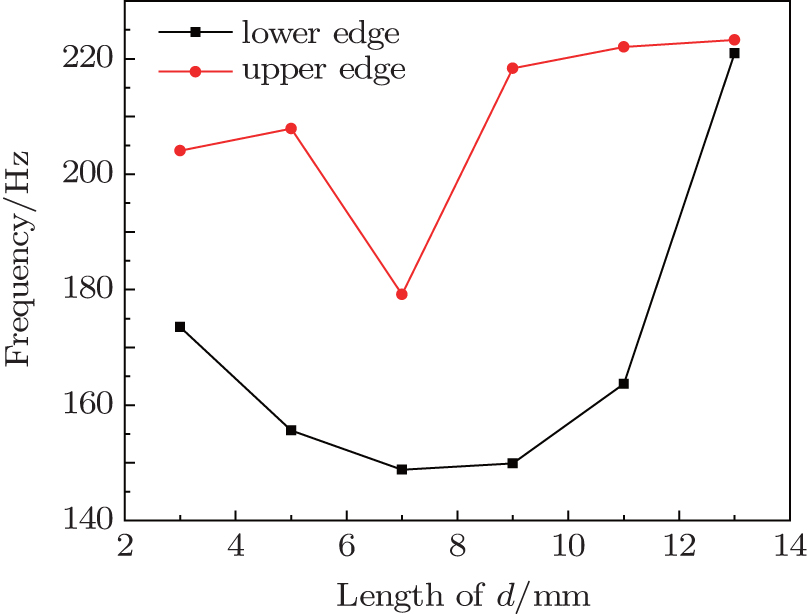
Fig. 7. Effects of spindle width d on the lower and upper edges of the first bandgap with b = 18 mm and c = 16 mm.

Next, the influence of the side height b is investigated when c = 16 mm and d = 11 mm. Figure 9 illustrates the variations of the upper and lower edges of the first bandgap with side height b. It is observed that as side height b increases, both the upper edge and the lower edge of the first bandgap shift to the higher frequency range and the bandgap width increases to some extent.

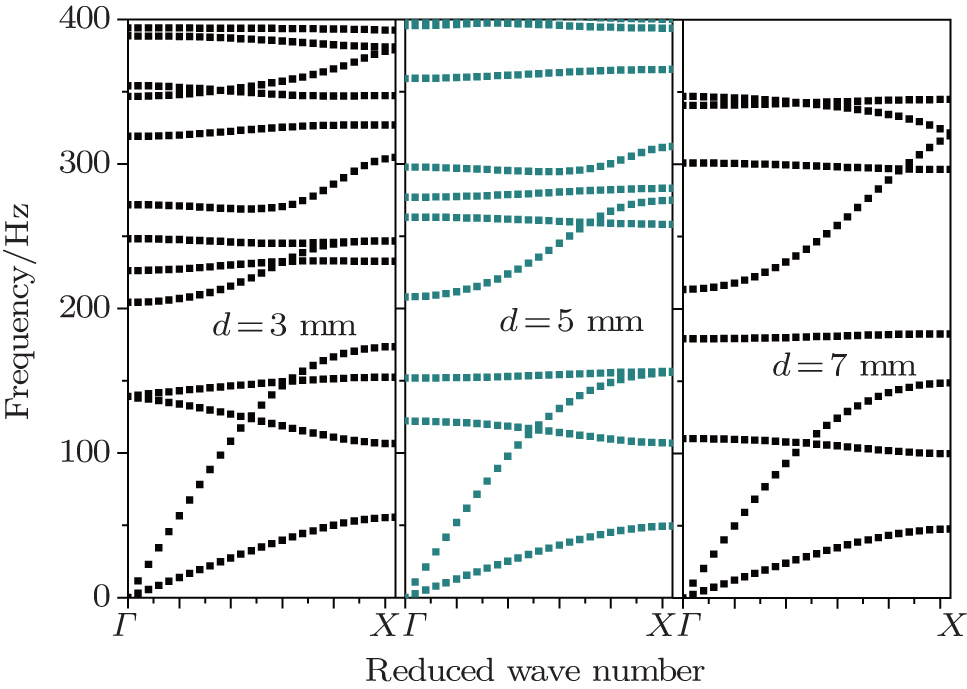
Fig. 8. Dispersion relations for different d values with b = 18 mm and c = 16 mm.
Fig. 9. Effects of the spindle side height b on the lower and upper edges of the first bandgap with c = 16 mm and d = 11 mm.
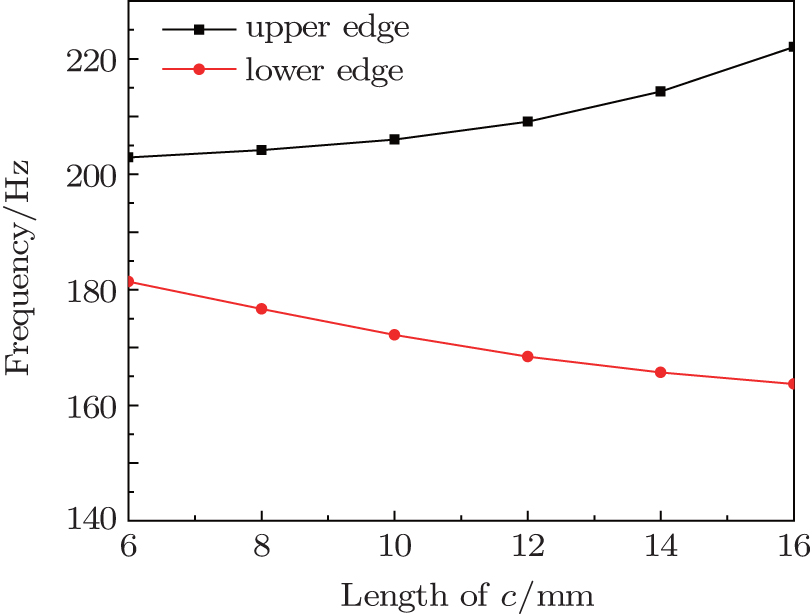
Fig. 10. Effects of frequency on spindle center height c for the cases of the lower and upper edges of the first bandgap with b = 18 mm and d = 11 mm.

Finally, figure 10 shows the variations of frequency with spindle central height c for the cases of the lower and upper edges of the first bandgap to investigate the effect of c on the first bandgap. It is assumed that the central height c varies from 6 mm to 16 mm, while the spindle side height b = 18 mm and the half width d = 11 mm keep unchanged. It can be seen that the upper edge of the first bandgap goes up to the high frequency range, while the lower edge comes down with the increase of central height c. As a result, the width of the first bandgap increases. However, the location of the first bandgap looks unmovable.

3.4. Effect of the material properties

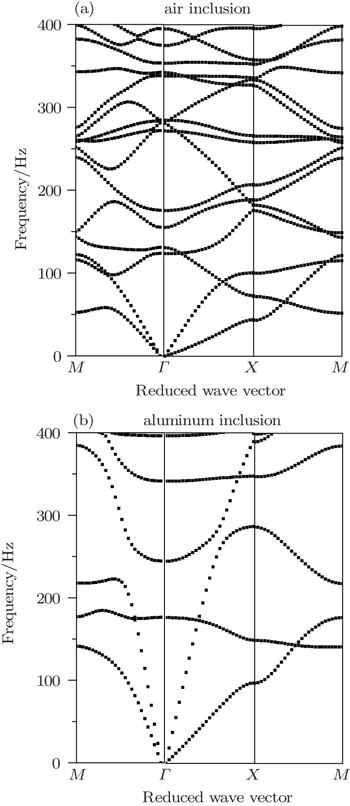
When the material property of the inclusion changes, wave propagation through the crystal can be different. Here, we provide two other materials to show the dispersion relation, air inclusion and aluminium inclusion as shown in Fig. 11. When the inclusion of the lattice is air, the PC could generate a negative Poisson’s ratio. Technically, it is a kind of acoustic metamaterial.

Fig. 11. Dispersion relations of PC with different material inclusions.

It can be seen that there are several bands in Fig. 11, but no band gap emerges. Compared with the material of the inclusion we used in this paper, namely plumbum, the material parameter of the inclusion has a great influence on the band gaps, especially, in the low frequency range. The geometry parameters are kept unchanged. The material of the matrix is rubber, while the materials for the inclusions are air, aluminium, and plumbum respectively. The density is getting bigger, which is the most significant difference. Combining the three figures, i.e., Figs. 11(a), 11(b), and 3(a), we can conclude that the bigger the density of the inclusion material, the fewer bands are in the low frequency range, which means that the material density of the inclusion determines the band gap of this PC. So it is important to choose the right material with a large-density inclusion to realize the low frequency band gap, even the wave propagation. This part can be a guideline for the application of the engineering when using the PC of spindle-shaped inclusion as waveguides, vibration isolator, etc.

4. Conclusions

In this paper, the band characteristics in a novel 2D PC structure composed of periodic spindle-shaped plumbum inclusions embedded in a host rubber material with a square lattice are investigated. Numerical results from the FEM in conjunction with the Bloch theorem show that the proposed PC structure can yield a large complete bandgap in a lower-frequency range from 163 Hz to 222 Hz, which is useful in low-frequency noise and vibration control. The attenuation frequency ranges in the transmission spectrum show good agreement with the bandgaps along the ΓX direction. The effective mass is calculated at the same time. The results show that it changes with the increase of frequency, and becomes negative in a certain frequency range which coincides with the band gap. Moreover, the eigenmode analysis is carried out to understand the formation mechanism of the bandgap. Results indicate that the complete bandgap is mainly attributed to the recycling motion of the matrix around the inclusion and the shearing motion of the matrix in the upside and downside regions of the inclusion. Finally, the effect of the geometry parameters of the inclusion on the bandgap is investigated. Numerical results show that the gap width and the location of the first bandgap can be extremely modulated in a large frequency range by the spindle central height and width. These band properties of the proposed PC can potentially be used to optimize bandgaps and generate lower-frequency filters and waveguides.

Reference
1Maldovan M 2013 Nature 503 209
2Ji Hong WDian Long YGang WHong Gang ZYao Zong LXi Sen W 2007 Chin. Phys. Lett. 24 1305
3Charles CBonello BGanot F2006Ultrasonics44, Supplemente1209
4Yan Z ZZhang C Z 2012 Physica B: Condens. Matter 407 1014
5Mohammadi SEftekhar A AKhelif AHunt W DAdibi A 2008 Appl. Phys. Lett. 92 221905
6Peng PMei JWu Y 2012 Phys. Rev. 86 134304
7Song G HChen J JHan X 2014 Jpn. J. Appl. Phys. 53 094301
8Vasseur JHladky Hennion A CDubus BDjafari Rouhani BMorvan B2008J. Acoust. Soc. Am.1233039
9Yu DWen JShen HXiao YWen X 2012 Phys. Lett. 376 626
10Wu L YChen L W 2012 Appl. Acoust. 73 312
11Feng C HJin C HTsun C HChin H WPin C 2011 J. Phys. D: Appl. Phys. 44 375101
12Huang P P Y Y WWu F GZ XLi JHu A Z 2015 Chin. Phys. 24 54301
13Yao YWu FHou ZXin Z 2011 Ultrasonics 51 602
14Yu K PChen T NWang X PZhou A A 2012 Physica B: Condens. Matter 407 4287
15Yu KChen TWang X 2013 J. Appl. Phys. 113 134901
16Xu Y LTian X GChen C Q 2012 Physica B: Condens. Matter 407 1995
17Li YChen TWang XYu KSong R 2015 Physica B: Condens. Matter 456 261
18Gao NWu J HYu L 2015 Ultrasonics 56 287
19Chen JXia YHan XZhang H 2012 Ultrasonics 52 920
20Wang KLiu YYang Q SUltrasonics6125
21Miniaci MMarzani ATestoni NDe Marchi L 2015 Ultrasonics 56 251
22Chen A LLiang T LWang Y S 2015 Chin. Phys. 24 066101
23Wang KLiu YYang Q S 2015 Ultrasonics 61 25
24Yu KChen TWang XZhou A 2013 J. Phys. Chem. Solids 74 1146
25Chen J JQin BCheng J C 2005 Chin. Phys. Lett. 22 1706
26Cheng YLiu X JWu D J 2011 J. Appl. Phys. 109 064904
27Zhang H BChen J JHan X 2012 J. Appl. Phys. 112 054503
28Weng C NChang P WChen T Y 2014 Procedia Engineering 79 622
29Auld B A1973Acoustic Fields and Waves in SolidsРипол Киассик