


Electrical and optical characteristics of the radio frequency surface dielectric barrier discharge plasma actuation
[Wang Wei-Long, Song Hui-Min†,  , Li Jun, Jia Min, Wu Yun, Jin Di]
, Li Jun, Jia Min, Wu Yun, Jin Di]
|
|


† Corresponding author. E-mail:
Project supported by the National Natural Science Foundation of China (Grant Nos. 11472306, 51276197, and 51336011).
Electrical characteristics and optical emission spectrum of the radio frequency (RF) surface dielectric barrier discharge (SDBD) plasma actuation are investigated experimentally in this paper. Influences of operating pressure, duty cycle and load power on the discharge are analyzed. When the operating pressure reaches 30 kPa, the discharge energy calculated from the Charge–Voltage (Q–V) Lissajous figure increases significantly, while the effective capacitance decreases remarkably. As the duty cycle of the applied voltage increases, the voltage–current waveforms, the area of Q–V loop and the capacity show no distinct changes. Below 40 W, effective capacitance increases with the increase of load power, but it almost remains unchanged when load power is between 40 W and 95 W. The relative intensity 


Plasma flow control, based on plasma aerodynamic actuation, is an innovative active flow control technology for improving the aerodynamic performance of aircraft.[1–4]
In order to enhance the flow control ability of the dielectric barrier discharge (DBD) actuator, different plasma sources are adopted and studied, such as AC power supply in dozens of kHz[3,4] and the nanosecond pulsed power supply.[5,6] Wu et al.[4] tested emission spectrum characteristics with AC power supply, and found that the rotational temperature increases with the increases of the inner space of an electrode pair. Jiang et al. presented two kinds of discharge Lissajous figures in nanosecond-pulse surface discharges. The first Lissajous figure is almond-like, and the other one is like a parallelogram.[6] Dedrick et al. investigated the RF plasma propagation of surface barrier discharge in atmospheric pressure air. Experimental results showed that the mean propagation length varied linearly with applied voltage.[7]
Compared with the AC power supply in dozens of kHz and the nanosecond pulsed power supply, RF DBD has advantages such as stable volume discharge in high-speed airflow, high energy coupling efficiency to the ionized gas, etc. Therefore, it has received increasing attention for its promising application in flow control.[8–11] Leonov et al.[8] revealed the specific regime of filamentary RF discharge plasma in supersonic airflow. It was found that the temperature of the filamentary RF plasma reached as high as 4000 K at a static pressure of 120 Torr (1 Torr = 1.33322 × 10² Pa). The influence of RF discharge plasma filaments on shock position and amplitude is acquired.[8,9] At the critical attack angle α = 13° of the wing model, through increasing frequency modulation, modulated RF DBD can reduce the drag coefficient by 40%.[10] Dedrick et al. investigated a dual-frequency driven plasma actuator, and changed the position of RF 13.56 MHz pulses in the period of a low-frequency 5-kHz sinusoidal voltage. The results show that the optical emission, which is studied by fast imaging is most intense when the pulses are positioned close to the zero crossings of the lower frequency waveform during the positive half-period.[12] However, the connection between the discharge characteristics and some key parameters, such as duty cycle and load power, remains unclear. The understanding of RF surface discharge at low pressure is still insufficient.
In this paper, the electrical characteristics and the optical emission spectrum of the RF surface dielectric barrier discharge (SDBD) are investigated. The influences of operating pressure, duty cycle and load power on RF DBD performance are analyzed.
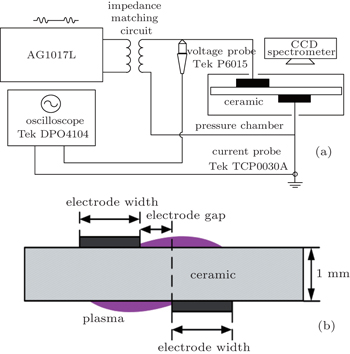
The schematic diagrams of the experiment setup and actuator are shown in Fig.
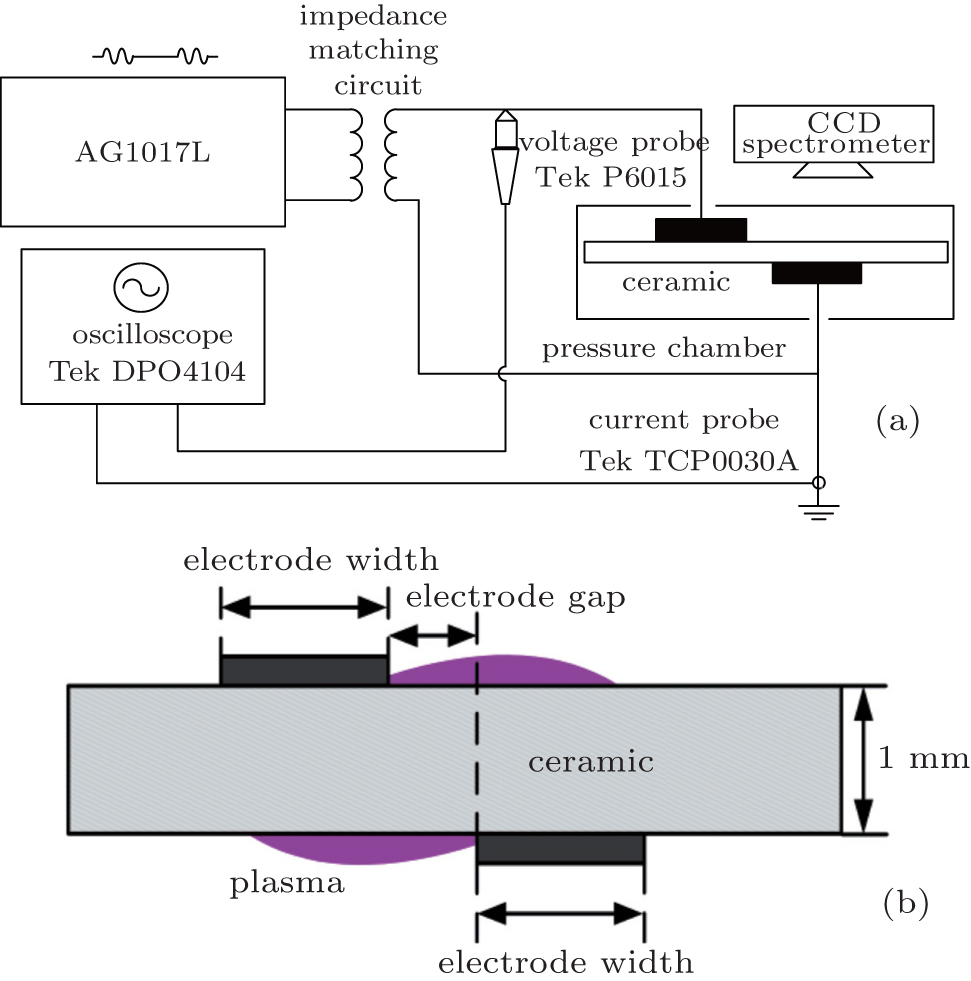 | Fig. 1. Schematic diagrams of the experiment: (a) experimental setup, (b) schematic diagram of the plasma actuator. |
The applied voltage and the discharge current are measured with a high voltage probe (Tektronix, P6015A) and a current probe (Tektronix, TCP0030A). All the signals are displayed and recorded by a digital oscilloscope (Tektronix, DPO4104). The optical emission spectra of the RF discharge plasma are obtained with a charge coupled device spectrometer (Avaspec-2048-M), which is outside the pressurized chamber. The head of the optical fiber is 5 mm away from the quartz glass window. The resolution ratio of the spectrometer is no bigger than 0.08 nm and the wavelength ranges from 200 nm to 1000 nm. The emission intensity is averaged temporally and spatially.
In order to obtain the influences of operating pressure, duty cycle and load power on RF discharge, voltage–current waveforms are recorded under various conditions. The effects of these parameters on discharge energy and capacitance are also investigated by Q–V loops.
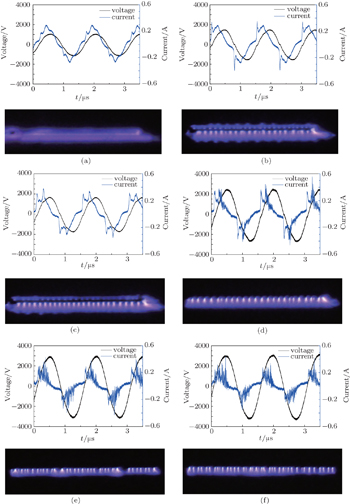
Figure
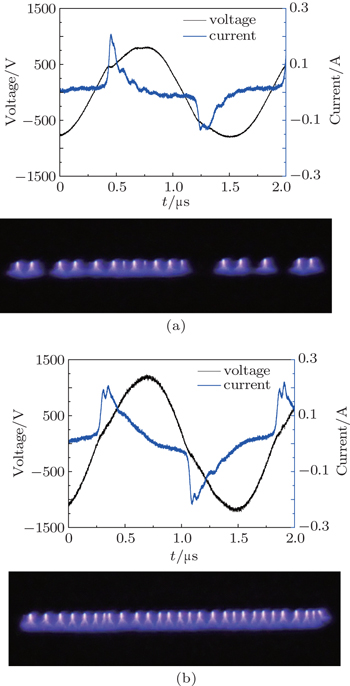
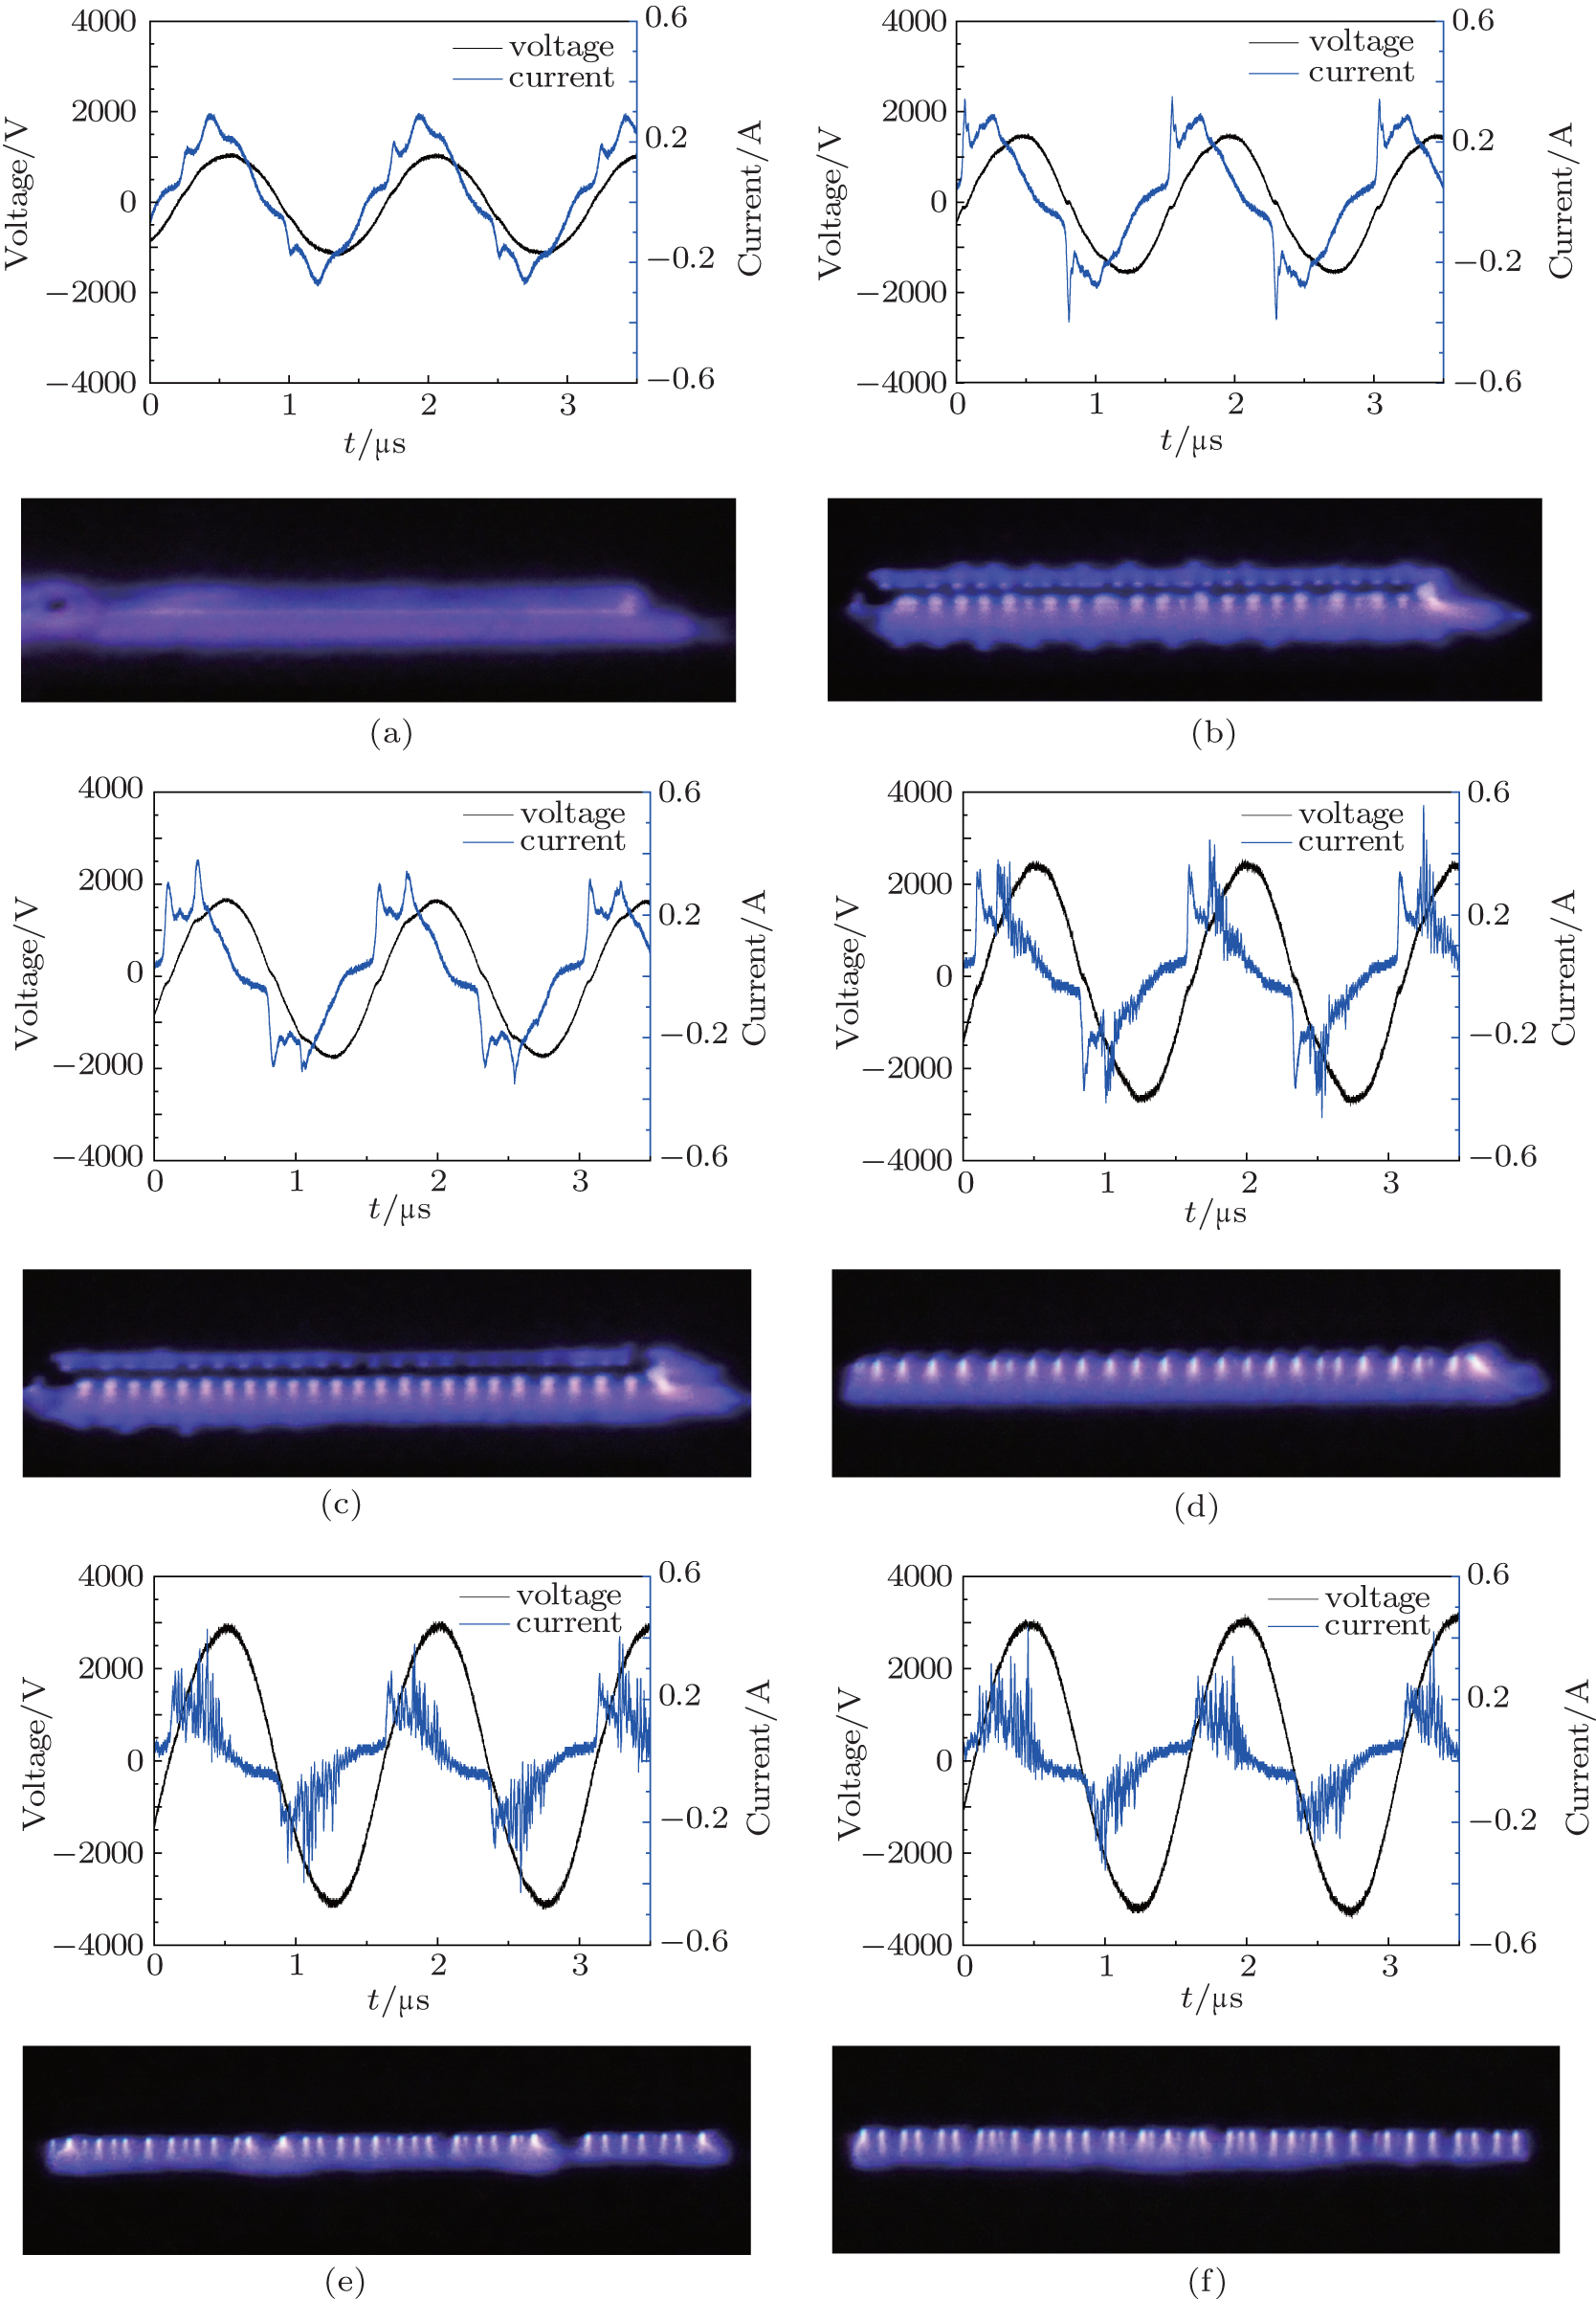 | Fig. 2. The voltage–current waveforms and images of RF discharge under different operating pressures: (a) 1 kPa, (b) 8 kPa, (c) 30 kPa, (d) 40 kPa, (e) 70 kPa, and (f) 100 kPa. In this figure, we take frequency: 0.67 MHz, duty cycle: 1:20, load power: 95 W. |
As shown in Fig.
An SDBD parallelogram-shape Q–V Lissajous curve which is driven by an AC power generator is shown in Fig.
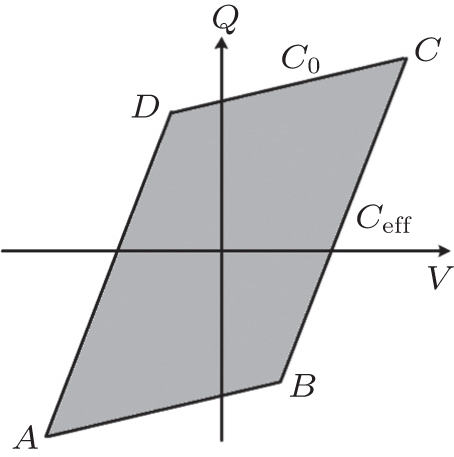 | Fig. 3. Schematic presentation of SDBD Q–V Lissajous figure.[13] |
The area of the Q–V Lissajous loop is equal to the energy per cycle, which can be calculated from

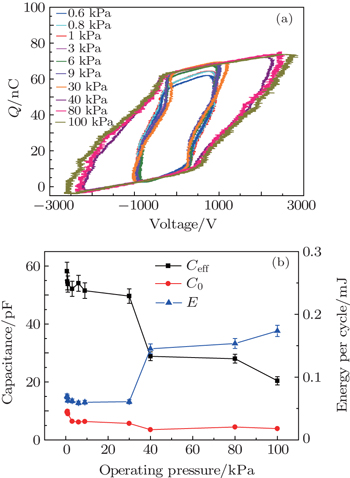
At different pressures the shapes of Q–V loops are similar to the parallelogram, as shown in Fig.
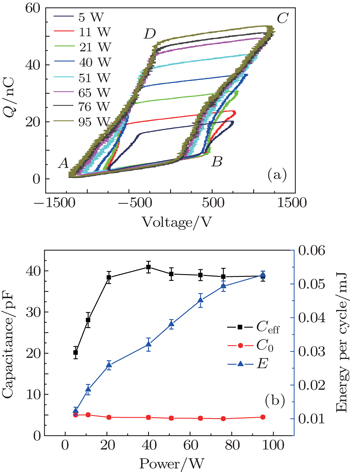
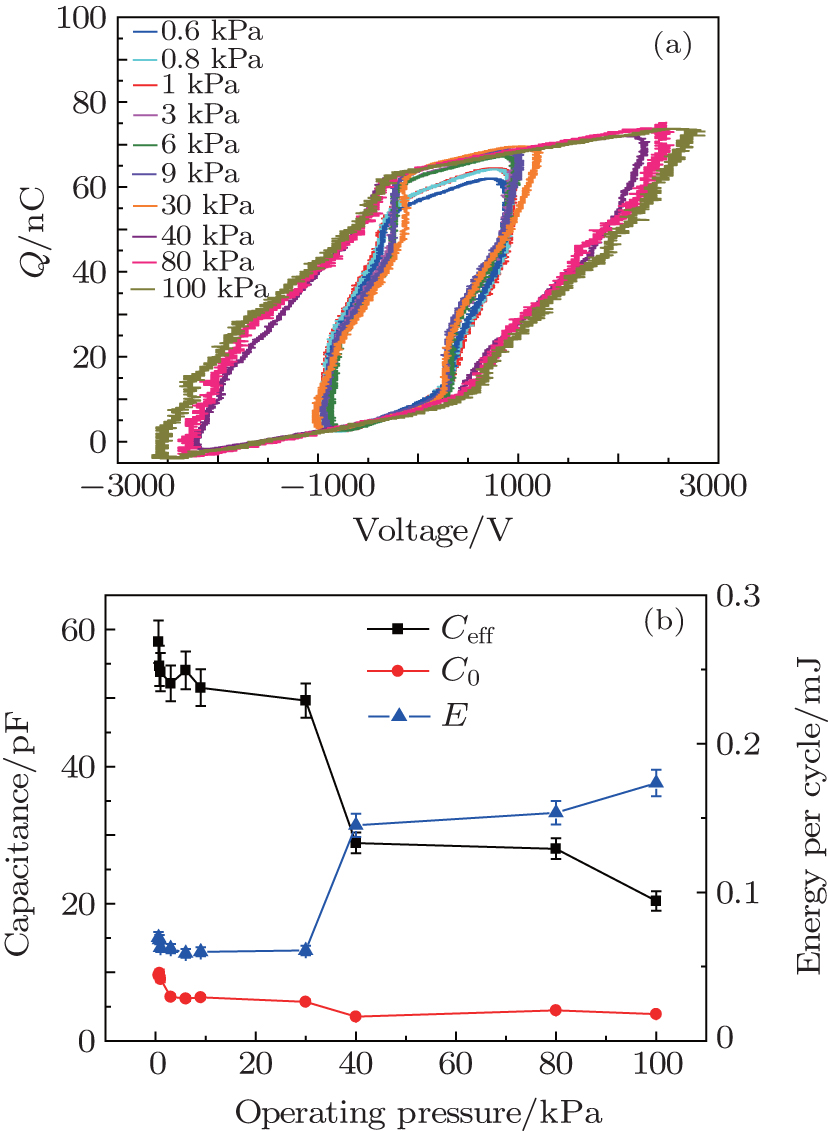 | Fig. 4. Lissajous figures of RF discharge at different pressures: (a) Q–V Lissajous figures at different pressures, (b) capacitance and energy per cycle at different pressures. Other parameters are frequency: 0.67 MHz, duty cycle: 1:20, load power: 95 W. |
TA/TM is defined as the duty cycle of an RF generator, where TA is burst width, TM is the burst period, and T is the period of voltage waveform. Keeping operating pressure at 50 kPa and power at 95 W, modulating the duty cycles of the RF generator to be 1:5 and 1:20, the voltage–current waveforms and images are shown in Figs.
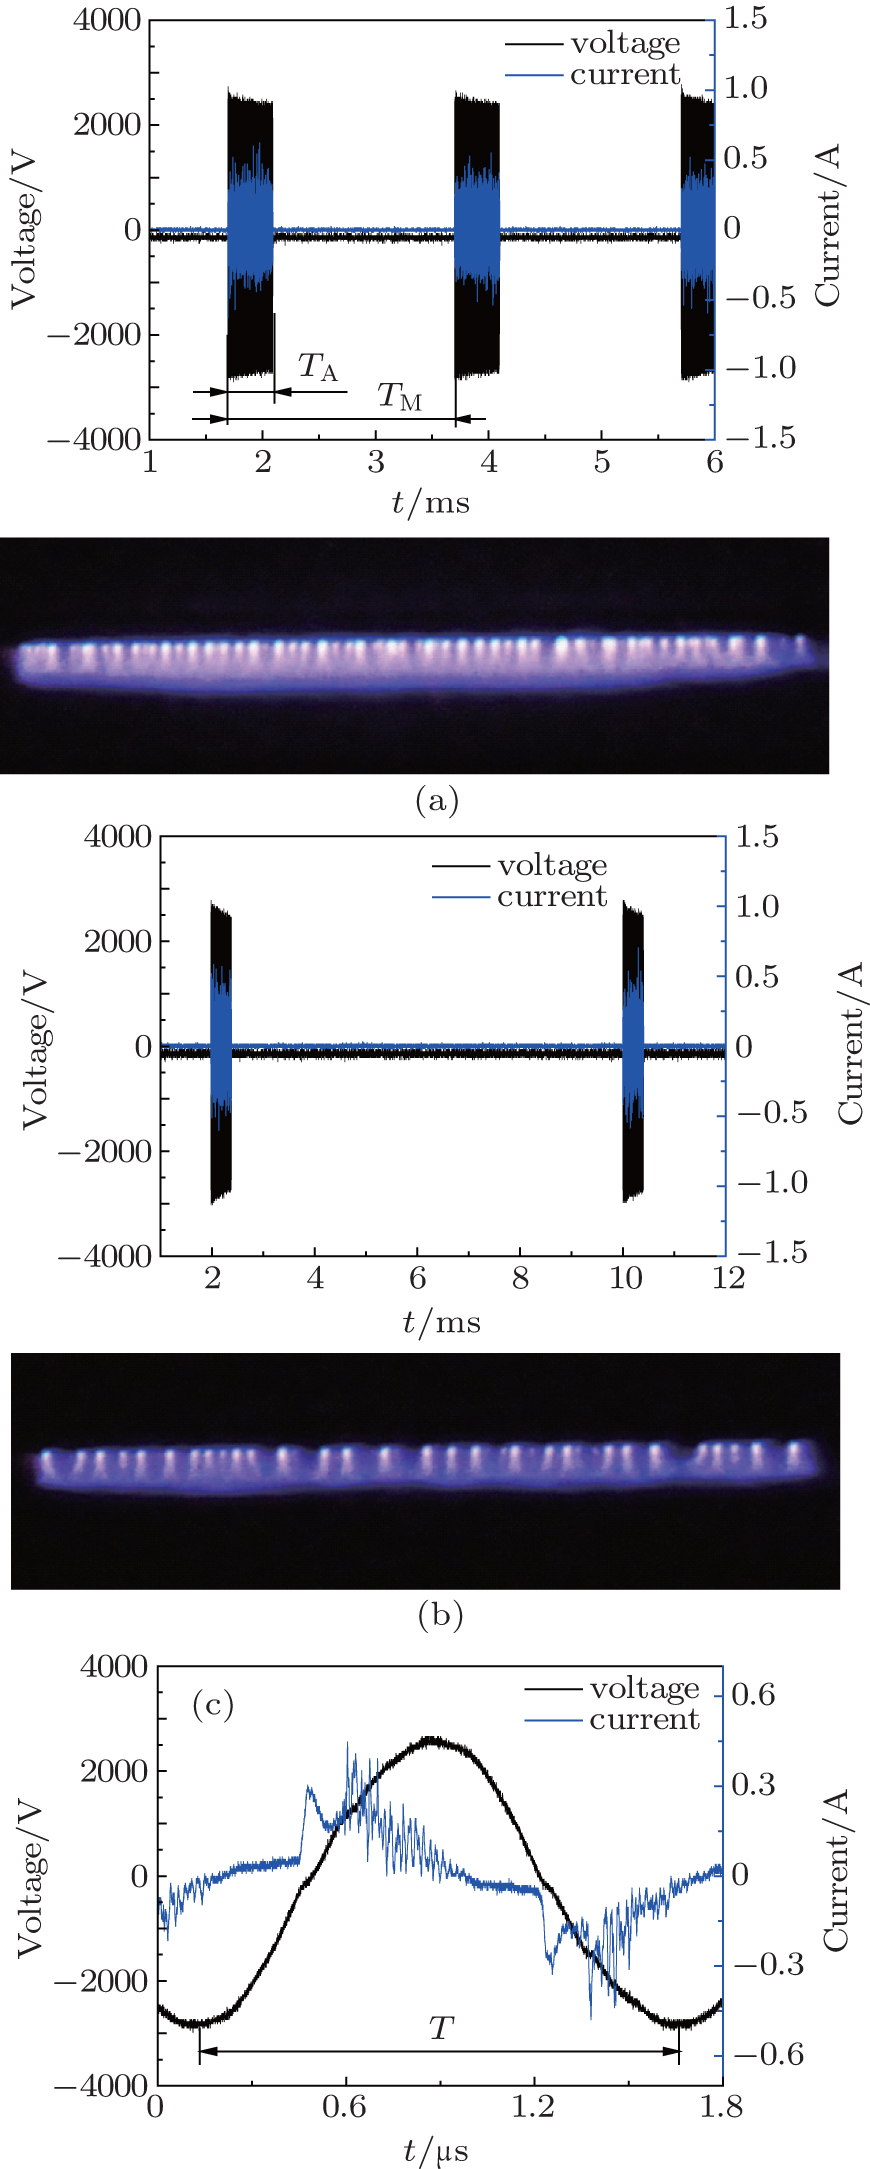 | Fig. 5. Voltage–current waveforms and images of RF discharge under different duty cycles: (a) 1:5, (b) 1:20, and (c) the voltage–current waveforms of a period. Other parameters are frequency: 0.67 MHz, operating pressure: 50 kPa, load power: 95 W. |
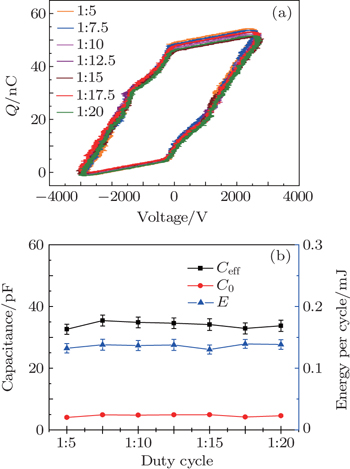
Figure
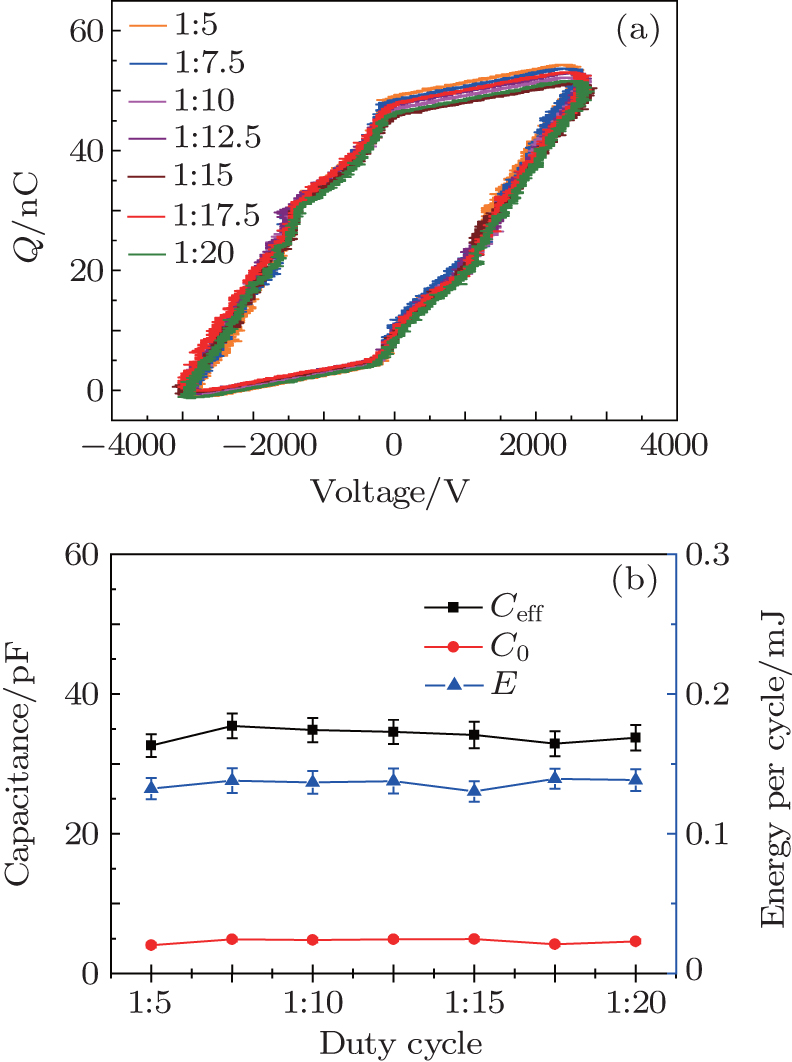 | Fig. 6. Lissajous figures of RF discharge at different duty cycles: (a) Q–V Lissajous figures at different duty cycles, (b) capacitance and energy per cycle at different duty cycles. Other parameters are frequency: 0.67 MHz, operating pressure: 50 kPa, load power: 95 W. |
In the burst period, the variation of the duty cycle only changes the duration of the blank output (TA – TM), while TA (the period T is multiplied by the pulse number) remains unchanged. In a discharge period, the Lissajous figure is determined by voltage–current waveform, and the capacitance and energy per cycle are calculated by the Lissajous figure. Since the voltage–current waveforms are fixed under different duty cycles, the shapes of the Lissajous figures are almost the same. Obviously the electrical characteristic, including the capacitance and energy per cycle, is changeless under different duty cycles.
The influence of load power on RF SDBD is studied with the load power ranging from 5 W to 95 W. Figure
 | Fig. 7. Voltage–current waveforms and images of RF discharge under different load powers: (a) 21 W, (b) 65 W. Other parameters are frequency: 0.67 MHz, operating pressure: 30 kPa, duty cycle: 1:20. |
Figure
 | Fig. 8. Lissajous figures of RF discharge under different load powers: (a) Q–V Lissajous figures at different load powers, (b) capacitance and energy per cycle at different load powers. Other parameters are frequency: 0.67 MHz, operating pressure: 30 kPa, duty cycle: 1:20. |
As a real-time and non-intrusive diagnostic method which is effective in distinguishing spatio-temporal influence, optical emission spectroscopy is widely used to investigate non-equilibrium plasma.[17–19] In this paper, the optical emission spectrum of RF SDBD plasma is measured under varying operating pressures, duty cycles and load powers.
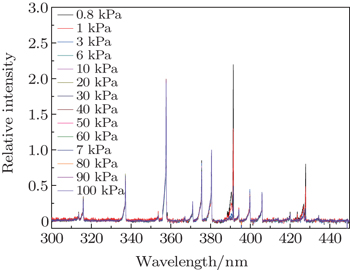
In this subsection, the influence of operating pressure (0.8 kPa–100 kPa) on RF SDBD plasma is investigated when the experimental conditions are as follows: the frequency of the RF generator is 0.67 MHz, the duty cycle is 1:20, and the power is 95 W. The integration time of the spectrograph is set to be 1000 ms and the actuator is placed in the pressurized chamber. The optical emission spectrogram under varying pressures is shown in Fig.
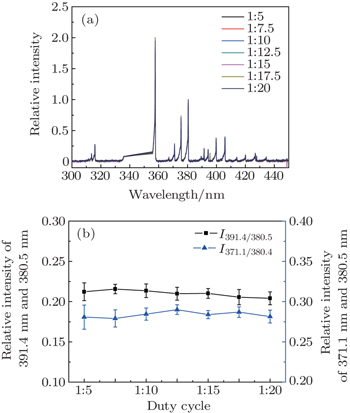
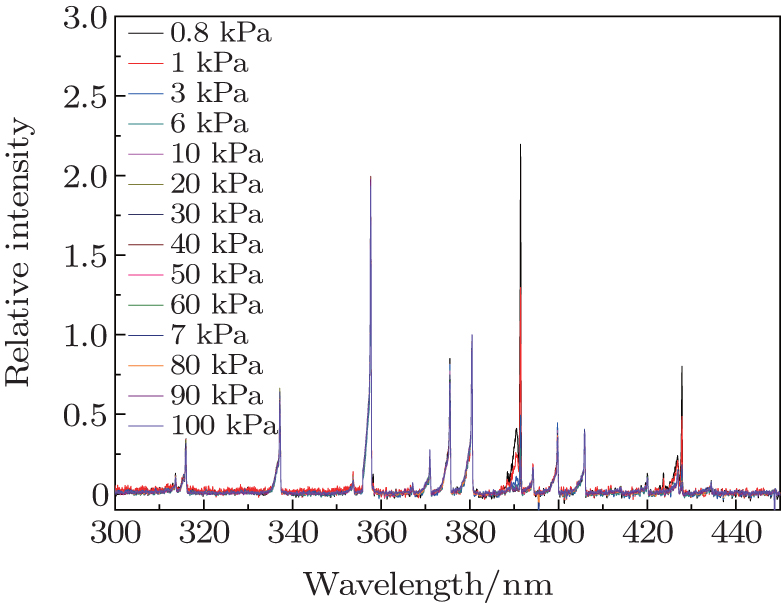 | Fig. 9. Optical emission spectrogram under varying pressure. |
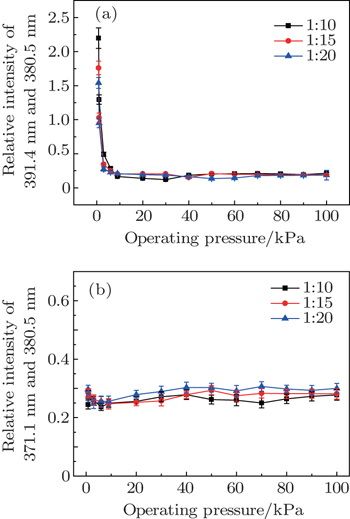
Figure 


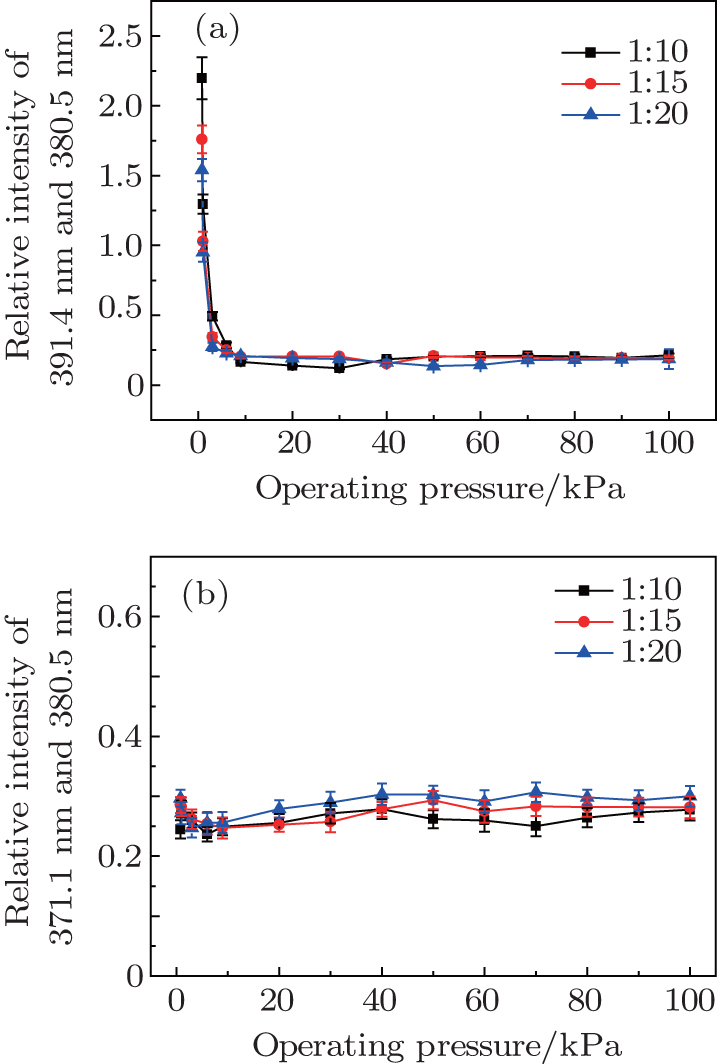 | Fig. 10. Plots of relative intensity versus operating pressure with duty cycles of 1:5, 1:10, and 1:20. (a)   |
In Fig. 

 | Fig. 11. Influence of the duty cycle on the optical emission spectrogram. (a) Optical emission spectrogram under varying duty cycles, (b) relative intensities under varying duty cycles. |
Figure 

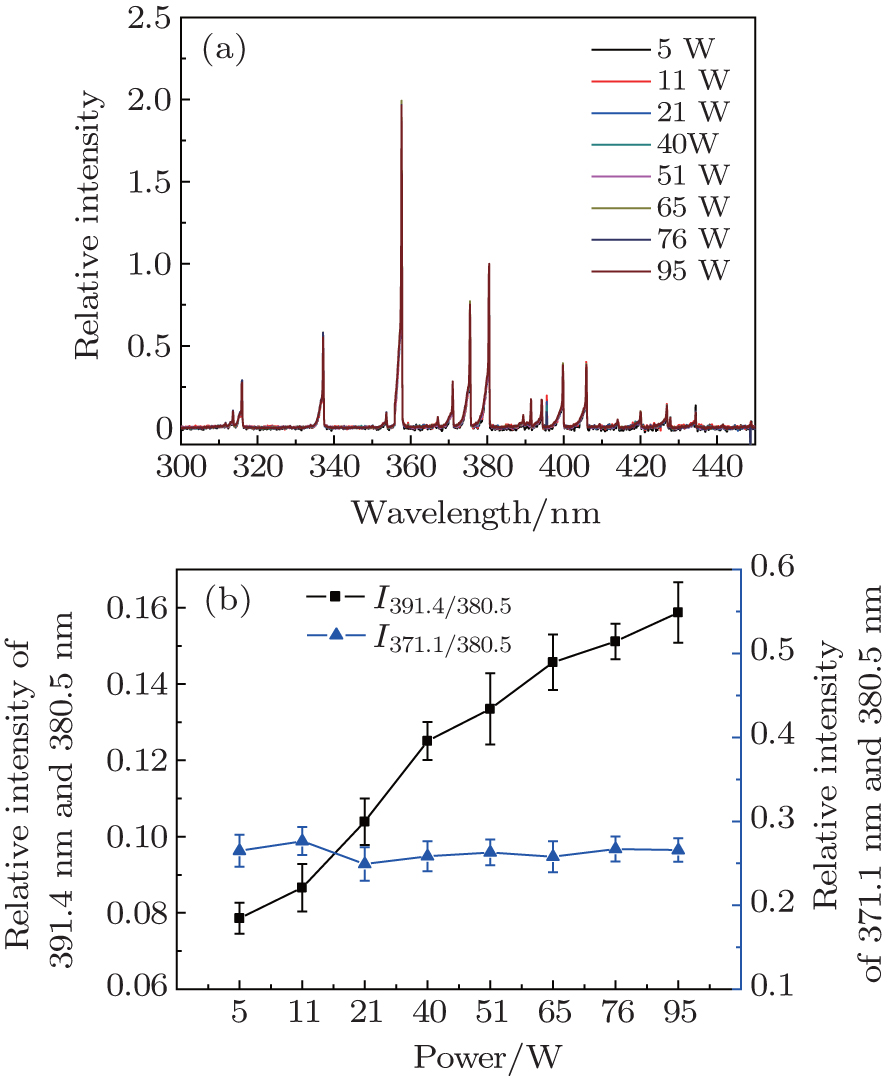 | Fig. 12. Influences of load power on the optical emission spectrogram. (a) Optical emission spectrogram under varying load power, (b) relative intensities under varying load power. |
The electrical characteristics and optical emission spectra of RF SDBD plasma under varying operating pressures, duty cycles, and load powers are experimentally investigated. The main conclusions are as follows.
The current waveform of RF SDBD has two obvious peaks at low pressure, while it possesses many spikes when operating pressure is relatively high. At a low operating pressure, the discharge mode is homogeneous and diffuses glow discharge. Q–V Lissajous figures of RF SDBD each are like a parallelogram under different operating pressures. The peak-to-peak value of the voltage ascends when the operating pressure is relatively high. When the operating pressure reaches up to 30 kPa, Ceff decreases remarkably while energy per cycle increases rapidly with the increase of pressure. Q–V loops, capacities, and energies per cycle remain almost unchanged under different duty cycles. When the load power is below 40 W, Ceff increases with the increase of load power, but it remains almost unchanged with load power in a range between 40 W and 95 W, which indicates that the discharge current is relatively stable during this period. The energy per cycle rises as load power increases.
When the duty cycle and load power of the RF power are fixed, with the pressure decreasing from 100 kPa to 4 kPa, the relative intensity 


The future work should focus on the characteristics and control of RF discharge in a high speed flow, and RF DBD plasma on shockwave control, and provide new technical solutions for enhancing flow control ability.
| 1 | |
| 2 | |
| 3 | |
| 4 | |
| 5 | |
| 6 | |
| 7 | |
| 8 | |
| 9 | |
| 10 | |
| 11 | |
| 12 | |
| 13 | |
| 14 | |
| 15 | |
| 16 | |
| 17 | |
| 18 | |
| 19 | |
| 20 | |
| 21 | |
| 22 | |
| 23 | |
| 24 |