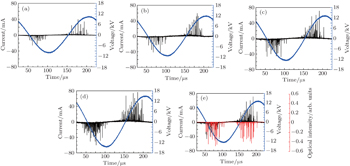
3.1. Electrical and optical characteristics of the microplasma array deviceFigures 2(a)–2(d) show the applied voltage and current waveforms of the atmospheric pressure microplasma array device, obtained at VP = 10 kV, 12 kV, 14 kV, and 15 kV, respectively. The measurements are performed at an air flow rate of 4 SLM and with a fixed repetition frequency of 5 kHz. It is clear that plasma is produced by strong pulsed microdischarge, and the duration of pulsed discharges in most cases is tens of nanoseconds, a phenomenon that is referred to as filamentary barrier discharge.[22] Furthermore, the directions and amplitude of these filament currents are different in the negative high voltage (NHV) and positive high voltage (PHV) half-cycles. Filamentary discharges in the PHV cycle are much stronger than the ones in the NHV cycle. The above-observed differences between two half-cycles could be explained by the polarity effect for a needle-shaped electrode configuration.[23–25] The electrons and ions behave differently on the outer surface of 200-μm-inner-diameter fiber during their propagation. The formation of atmospheric pressure microplasmas can be explained by the streamer mechanism, where UV ionization may be important for its propagation.[26–28] Obviously, the discharge current is significantly influenced by the applied voltage. In the initial discharge state with an applied voltage of 10 kV in Fig. 2(a), the amplitude of the filament discharge current varies from 8 mA to 39 mA. The duration of the discharge process is about 42.2 μs in the NHV cycle and about 44.5 μs in the PHV cycle. And the time lags of the adjacent filamentary currents vary randomly from about 240 ns to 5.9 μs. With VP increasing from 10 kV to 15 kV, the intensity of the discharge currents and the density of filament currents in the discharge process are both greatly improved, and the time lags of the adjacent filamentary currents decrease as shown in Figs. 2(b)–2(d). This result also indicates an improvement in the density of this well-aligned microplasma when voltage rises from 10 kV to 15 kV.
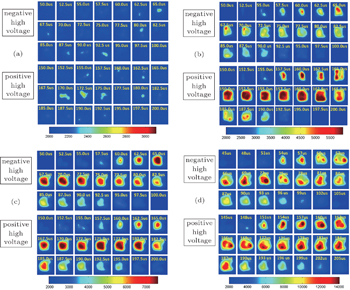
To investigate the discharge characteristics of the well-aligned microplasma array, the high-speed ICCD camera is used to capture the dynamics of the air discharge. Figure 3 shows a sequence of ICCD images of the whole area covered by 6×6 units over one complete cycle. The measurements are performed at an air flow rate of 4.0 SLM and f = 5 kHz. The ICCD images are obtained with a gate width of 20 ns in steps of 200 ns at the applied voltages of 10 kV (Fig. 3(a)), 12 kV (Fig. 3(b)), 14 kV (Fig. 3(c)), and 15 kV (Fig. 3(d)). The time labeled on each photograph corresponds to the time shown in Fig. 2. In Fig. 3(a), the discharge is triggered at 55.0 μs and ended at 95.0 μs in the NHV cycle while one in the PHV cycle happens at 152.5 μs and ends at 197.5 μs. With the discharge going on, the propagation process images in the NHV and PHV cycle are almost symmetrical, but this is another story at VP = 10 kV. With the applied voltage increasing up to 12 kV, the amplitude of the discharge current reaches 45 mA in the NHV cycle and 60 mA in the PHV cycle. The corresponding ICCD images of propagation process at the delay of 50.0 μs–100.0 μs are obtained during the NHV cycle while those at the delay time of 150.0 μs–200.0 μs during the PHV cycle as shown in Fig. 3(b). In the NHV cycle, appreciable charges accumulate on the surface of the 1.0-mm-thick fibers to form the inverse electric field, lowering the net voltage across the high-voltage and grounded electrode. The original symmetrical propagation in the NHV cycle and PHV cycle is disrupted. A higher voltage increases the expansion of the filament discharge region and shortenes the time required for the occurrence of complete uniformity. Thus, a large-area and homogeneous discharge in PHV cycle is fully covered on the dielectric surface due to the diffusion effect of the discharge filaments.
Figure 3(c) shows the discharge propagation process with an applied voltage of 14 kV. With the increase of applied voltage, a growing number of filament channels are generated. In the propagation process of the discharge, the adjacent filament current channels are merged into one channel with a larger width on the order of μs, forming a type of visually uniform discharge due to the plasma diffusion effect, which is consistent with the ICCD images. At 65.0 μs in the NHV cycle, it is clearly seen that the regional filament discharge convert into a uniform one. This uniform discharge mode lasts from 65.0 μs to 97.5 μs in the NHV cycle and from 162.5 μs to 200.0 μs in the PHV cycle, and the discharge region covers the whole ITO electrode surface. In this mode, a feedback mechanism at the ground electrode surface is formed. Impinging ions and photons produced secondary electrons which are fed back into the discharge channel. Figure 3(d) shows the discharge propagation process with an applied voltage of 15 kV and f = 5 kHz. Compared with VP = 10 kV, 12 kV, 14 kV, the discharge propagation process triggered earlier at 45 μs. With applied voltage increasing, a large amount of power is transferred into the discharge region. At high frequency there appears this situation where an electrode exhibits a preferential location for the repetitive initiation of one or more microfilaments, leading to accumulated thermal instability.
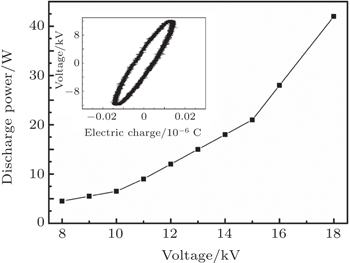
Figure 4 shows the discharge power as a function of applied voltage and the Lissajous figure obtained at an applied voltage of 12 kV with a repetition frequency of 5 kHz. As stated before, the Lissajous figure can be used to calculate the discharge power, and the area of the closed curve is proportional to the discharge power. With the fixed frequency of 5 kHz, the discharge power slowly increases with the applied voltage varying from 8.0 kV to 15 kV and sharply increases over the applied voltage of 15 kV. The increase in the discharge power indicates an improvement in well-aligned microplasma density, which is well consistent with the propagation process. The well-aligned air plasma generated at VP = 14 kV is utilized for plasma modification of PET and inactivation of E. coli cells, and its discharge power is 16 W. indicating a low gas temperature of the well-aligned plasma.
The ICCD images display that a stable and large area diffusion discharge could be achieved in a wide range of discharge voltage. As the discharge voltage increases, the plasma area is significantly enlarged both horizontally and vertically (see Fig. 3). When the discharge voltage increase up to 12 kV, the discharge plasma spreads over the whole dielectric layer surface under the square array electrode, and a large area (about 35 mm×35 mm) of discharge plasma is formed. This behavior can be understood by using a simple model for the breakdown of the discharge as shown in Fig. 1(d). With the well-aligned array microelectrodes, the localized filament channels are generated with the localized high electron density and energy. Figure 2(e) shows an optical intensity monitored by a PMT at the side of the well-aligned microplasma arrays, with the voltage and current waveforms recorded simultaneously. Apparently, optical intensity signals are consistent with filaments of discharge current on the whole. Furthermore, the filament from a single jet (individual unit) is also investigated. With a high-speed ICCD camera, a diffusing and bright circle ring outside the individual plasma jet unit is continuously seen in the discharge time, in accordance with the above discussion. As already discussed above, the arrays are not triggered simultaneously but show repetitive spatial variations, acting as a mode of filamentary barrier discharge. Usually at a high jet density, jet–jet interactions will be so strong that they can cause repelled or converged jet channels, thus defeating the purpose of forming an array.[29] Difference in plasma ignition can be attributed to jet–jet interactions in general, since the transport of neutral species and UV photons caused by one plasma jet should affect the dynamics of its sounding jets. Less straightforward is, however, the difference in the voltage of plasma ignition, when the plasmas are just triggered and their interactions must be very weak.
To overcome the discharge excitation threshold requires the applied voltage Ua to be increased to reach the breakdown voltage Ub over the discharge gap d. Ub is only related to the kind of gas used and the discharge gap d, and can be considered as a constant in this aligned air plasma discharge. Then Ua is given by

where

Here,
Ud is the voltage difference between the upper and lower surfaces of the dielectric layer;
Cd is the electric capacity of dielectric;
∫ I d
t is the integral of breakdown current, and represents the electrical charges accumulated on the dielectric layer surface. With the increase of the applied voltage,
Q value can be improved, also indicating the increase of the density of electrical charges. Figure
1(d) shows the discharge and diffusion models of the microplasma arrays. In the negative half period, electrons are accelerated out of the microplasma units towards the grounded electrode. They reach the excitation threshold at the top of the single jet unit, leading to a spacious emission feature (expanding). In the positive half period, electrons are accelerated from the ground electrode into the microplasma units. In addition, increasing the discharge voltage can contribute to the increase of reduced electric field E/N, which leads to an increase in the density of the high-energy electrons. Accordingly, more electron avalanches can be obtained in the discharge gap. Additionally, a greater number of excited molecules and ions can be generated in a larger region. Therefore, the discharge becomes more intense and the plasma area expands. For more details of streamer propagation mechanism, the literature
[30] is strongly recommended.
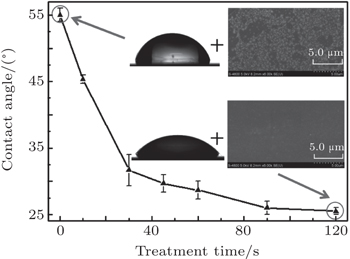
3.2. Large-area surface modification of materialsSuch a diffusing and large-area microplasma with low temperature is highly suitable for large-area surface modification of materials or biological sterilization. The plasma has no detrimental effect on the heat-sensitive material due to its low gas temperature, which is indicated by the discharge power from Lissajous figures; the discharge power is calculated to be about 16 W. The sessile water-drop contact angles of PET samples are plotted as a function of the plasma treatment time as shown in Fig. 5.
Plasma treatment may result in a hydrophobic surface of PET sample and have a great effect on the contact angle of PET sample. The contact angle of PET sample decreases markedly from (55.0±1.0)° to (25.5±0.5)° with the plasma treatment time being 2 mins. Figure 5 also shows the typical SEM images for platelet adhering to the untreated and plasma-treated PET sample respectively. Clearly, there is a high density of platelets adhering to the untreated PET sample, whereas no adhesion of platelets was observed on the plasma-treated PET sample, possibly as a result of the hydrophilic property of PET surface. A hydrophobic recovery of plasma-activated PET sample is observed under ambient conditions, where after 3-days aging the water contact angle for the sample treated in air is raised to 39° and the adhesion of platelets on PET sample is also significantly affected.
The obvious differences in contact angle and platelet adhesion between untreated and plasma-activated PET samples are attributed to their surface change in chemical composition and bonding environment. Survey-scan XPS spectra show that carbon, nitrogen and oxygen are existent, and they are the built blocks of the film. Figure 6(a) shows that the surface concentrations of oxygen and nitrogen in the treated PET sample increase from the initial 18.6% and 13.3% to 22% and 15.2%, respectively, while the carbon concentration decreases from 67.8% to 62.8%. A decrease in the C content indicates that H atoms at PET surface can be replaced by N- or O-containing reactive species generated in the air plasma jet. Interestingly, after 3-days aging of relaxation process, the concentrations of these elements on plasma treated samples essentially return to their original levels: for each of the samples, its carbon concentration rises to 67.1% and oxygen and nitrogen concentration decrease to 19.2% and 13.7% respectively. The XPS C1s spectrum for the untreated PET sample is shown in Fig. 6(b). The carbon spectrum may be decomposed into three features.[31] The peaks at 286.4 eV and 288.8 eV arise from −C–O/–C–N and −C=O groups respectively, while the peak at 284.8 eV is assigned to the −C = C– in the aromatic ring. The XPS C1s for the PET sample treated with the air plasma jets is shown in Fig. 6(c). Plasma treatment results in the changes in intensity and width of these three peaks. The increases in intensity of these peaks at 286.4 eV and 288.8 eV, suggest that −C–O/–C–N and −C = O groups can be formed due to the plasma treatment. When the platelet-rich blood plasma is applied onto the well-activated surface of PET, the molecular adsorption mechanism of plasma protein becomes different from that on the untreated sample. With the principle of “like dissolves like”, H2O molecules can easily be adsorbed onto the surface of the plasma-activated PET sample while plasma proteins tend to be adsorbed onto the untreated PET surface.
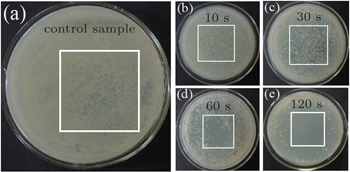
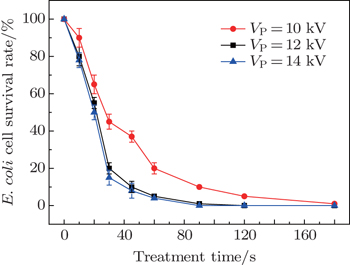
3.3. Large-area bacterial inactivationFigure 7 shows the images of (a) plasma-untreated (control) E. coli sample, and the E. coli samples treated by well-aligned air plasma for (b) 10 s, (c) 30 s, (d) 1 min, and (e) 2 min. The marked square areas indicate the well-aligned microplasma regions above the E. coli samples. All plasma-treated samples are cultivated for 24 h in a 37-°C thermostat after plasma treatment. The blank area in the petri dish rapidly increases when the plasma treatment time increases from 10 s to 2.0 min, which confirms that the atmospheric-pressure air microplasma results in the rupturing of E. coli cells. It can be seen that most of the E. coli cells in the Petri dish in the marked area are killed after the 2-min plasma treatment. Moreover, a large-area and homogeneous inactivation of E. coli cells in the marked area can be formed, which is attributed to the plasma uniformity on the dielectric surface. The plasma-activated species can come into direct contact with the E. coli samples and efficiently kill E. coli cells in the Petri dish. The survival rate of the E. coli cells is plotted as a function of the plasma treatment time as shown in Fig. 8. Increasing VP from 10 kV to 14 kV leads to a noticeable improvement in the efficiency of bacterial inactivation for a given treatment time. The improved inactivation efficiency is likely due to an increase in the discharge power. When the plasma treatment time increases from 10 s to 60 s, the inactivation efficiency is also greatly improved. This improvement gradually slows down with the further increase of treatment time. The inactivation efficiency can reach up to almost 100% within 2-min treatment.
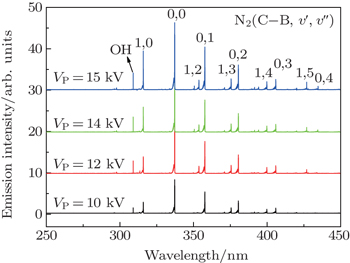
The optical emission spectra (OES) with a wavelength range from 200 nm to 500 nm at various discharge voltages are collected as shown in Fig. 9. The optical fiber is fixed to be 3 cm away from the broadside of the discharge region. These OES spectra are dominated by N2 (C–B) and OH. The excited N2 (C–B) and reactive OH species are mainly produced via the energetic collisions of electrons with N2, O2, and H2O molecules.[21] An increase of discharge voltage applied to the well-aligned plasma device contributes to high density of OH or excited N2 (C–B) radicals. Our OES measurements are well consistent with the observations from bacterial experiments for the reason that these plasma-generated species are very reactive and could be important contributors in the sterilization processing.
In this paper, the well-aligned microplasma operating at room temperature is designed for the large-area surface modification of heat-sensitive PET polymers and inactivation of resistant E. coli cells. This design can generate a kind of visible large-area and homogeneous discharge, resulting in a uniform surface interaction of plasma species with PET polymers and E. coli cells. It is suggested that various plasma-activated particles including charged species, UV photons and radicals, which are natural carriers of energy, play the leading role in the plasma modification and inactivation process, provided they excite a polymer, or break the chemical bonds at the polymer surface or directly reach E. coli cells.
The surface interactions of both radicals and energetic ions with the PET surface can create the dangling bonds and contribute to the incorporation of oxygen and nitrogen.[32] Our SEM measurements also show that the surface topography of the PET sample is not influenced by the plasma treatment. The temperature of the plasma-treated PET sample is measured with an infrared radiation thermometer, and it is usually lower than 40 °C. Therefore, the stable and homogeneous air plasma operating at room temperature does not cause damage to the heat-sensitive polymers and is suitable for the large-area surface modification of polymers in biomedical application.
Charged species are also supposed to induce the rupture of the outer membrane of bacteria cells.[33,34] The electrostatic force caused by charge accumulation on the outer surface of the cell membrane can overcome the tensile of the membrane and cause its rupture. Metastable or excited species can emit UV photons for plasma inactivation. The UV radiation with doses of several milliwatts per cm2 may cause lethal damage to cells.[35] However, no UV radiation in the 200 nm–300 nm wavelength range is observed by our OES measurement. It is generally believed that UV photons do not play a major role in the inactivation process by atmospheric-pressure cold plasma.[22,33,34] The O radicals are believed to play a crucial role in the plasma inactivation of microorganism.[35,36] Moreover, the frequent collisions between O radicals and O2 molecules can result in the production of ozone (O + O2 + M → O3).[4] Unsaturated fatty acids and sulfhydryl groups are readily oxidized with ozone. These oxidization process may lead to the inactivation of microorganisms and bacterial spores. The presence of these plasma-activated species can therefore compromise the function of the cell membrane which serves as a barrier against the transports of ions and polar compounds into and out of the cells.


 , Liu Dong-Ping1, 4, (Ken) Ostrikov Kostya5, 6, Yang Si-Ze1]