Cai Dan, Liu Lie, Ju Jin-Chuan, Zhao Xue-Long, Zhou Hong-Yu, Wang Xiao. Initiation of vacuum breakdown and failure mechanism of the carbon nanotube during thermal field emission. Chinese Physics B, 2016, 25(4): 045101
Permissions
Initiation of vacuum breakdown and failure mechanism of the carbon nanotube during thermal field emission
Cai Dan1, †, , Liu Lie1, Ju Jin-Chuan1, Zhao Xue-Long1, Zhou Hong-Yu1, Wang Xiao2
College of Optoelectric Science and Engineering, National University of Defense Technology, Changsha 410073, China
Project supported by the National Natural Science Foundation of China (Grant Nos. 11305263 and 61401484).
Abstract
Abstract
The carbon nanotube (CNT)-based materials can be used as vacuum device cathodes. Owing to the excellent field emission properties of CNT, it has great potentials in the applications of an explosive field emission cathode. The falling off of CNT from the substrate, which frequently appears in experiments, restricts its application. In addition, the onset time of vacuum breakdown limits the performance of the high-power explosive-emission-cathode-based diode. In this paper, the characteristics of the CNT, electric field strength, contact resistance and the kind of substrate material are varied to study the parameter effects on the onset time of vacuum breakdown and failure mechanism of the CNT by using the finite element method.
Owing to the high geometrical aspect ratio, electrical conductivity, and mechanical strength, the carbon nanotube (CNT) is considered as a good field electron emitting source,[1,2] which could be used as cathodes of various vacuum devices, such as flat panel display,[3–5] cathode ray tubes,[6] x-ray sources,[7–9] microwave radiation sources and amplifiers.[10,11]
As is well known, an explosive field emission (FE) cathode can generate intense-current electron beams under a high pulsed electric field, which has been used in various areas, such as high-power microwave generation[12–16] and surface modification.[17] Owing to the excellent FE properties of CNT, it has great potentials in the applications of an explosive FE cathode.[18–23] Usually, the features of initial vacuum breakdown could be used to judge the performance of the explosive FE cathode. The onset time of vacuum breakdown limits the efficiency of the diode because the delay of onset time is a substantial fraction of the total pulse length.[24] In addition, the electron emission uniformity[25–27] and diode closure[28] of the explosive FE cathode are influenced by the uniformity of the initial vacuum breakdown.
In previous experiments,[18,19] some of the CNT-based cathodes became unstable and even failed to work in a high pulsed electric field. The current failure mechanism of the CNT-based cathode is found to be the failure of the effective emitter. There are two main reasons for the failure of the effective emitter, i.e., one is the mechanical failure of the contact between the CNT and the substrate under the action of strong electrostatic force and the other is the removing or shortening of the CNT due to resistive heating during the FE.[29–37] In fact, the methods of improving the contact reliability have been successfully used and confirmed experimentally.[29,38,39] Therefore, in this paper, we make a special effort to study the mechanism of heat-induced damage. As already discussed extensively,[29,31,36] the binding material used as a substrate or support structure is important and the material with high conductance and high thermal conductivity is of benefit to improve the lifetime of a CNT-based cathode. In addition, Wei et al. confirmed by in-situ FE observation that under a combination of Joule heating and an electrostatic force effect, the failure of the CNT emitter tends to happen at the maximum temperature (Tmax) point, inducing a segment-by-segment breakdown process.[37] The Tmax point is located at the interior point rather than the tip of the CNT for the Nottingham effects.[40] These previous studies are useful to understand the failure mechanism of the CNT-based cathode; however, the discussion is not sufficient and the effects of the material parameters and CNT structure have not been discussed in detail.
In this paper, by using the finite element method, the influences of CNT size, electric field strength, CNT material parameters (such as resistivity and thermal conductivity), contact resistance, and the kind of substrate material on the initiation of vacuum breakdown and failure mechanism of the CNT are studied numerically. To model the thermal field (TF) emission, Nottingham effect, and heat radiation, a method based on electrostatic and transient thermal finite element analysis is developed.
2. Theoretical background
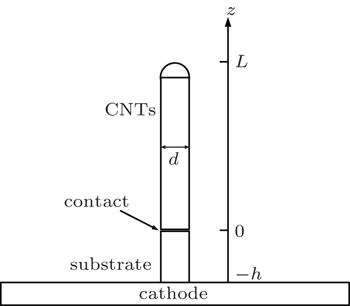
The most important feature of CNTs is the high aspect ratio (ratio of height to diameter). Owing to this feature, the magnitude of the electric field strength in the vicinity of the nanotube tip can be enhanced 100 times, which results in a significantly high electron current[41] from the CNT-based cathode at a relatively low voltage. In the process of electron emission, the temperature rise of the CNT is caused by Joule heating. In addition, other energy exchange processes (Nottingham effect,[40] heat conduction and heat radiation[42]) can also influence the thermal response. The model of the CNT is shown in Fig. 1. The CNT length is L and its diameter is d. In order to simplify the calculation, the substrate is assumed to be a cylinder with the same radius as the CNT. The length of the substrate is hsub.
Taking into account heat loss resulting from radiation from the wall of the CNT and heat conduction to the substrate, the time-dependent heat equation of the CNT (z > 0) is
where CCNT is the specific heat of the CNT, ρm−CNT is the density of the CNT, T (z,t) is the instantaneous temperature at position z, κCNT is the thermal conductivity of the CNT, σSB is the Stefan–Boltzmann constant, ɛCNT is the surface emissivity of the CNT, r is the radius of the CNT, and T0 is the ambient temperature. When the CNT operates under a high electric field and high temperature, the ballistic quantum effect of electronic transport in CNT can be neglected.[43–45] Therefore, the CNT could be equivalent to a simple resistance. Qj−CNT = ρCNTj2 is the Joule heating of the CNT. ρCNT is the resistivity of the CNT, j is the emission current density of the CNT.
Similarly, the time-dependent heat equation of the substrate (z < 0) is
where CSub is the special heat of the substrate, ρm−Sub is the density of the substrate, κSub is the thermal conductivity of the substrate, ɛSub is the surface emissivity of the substrate, Qj−Sub = ρSubj2 is the Joule heating of the substrate, and ρSub is the resistivity of the substrate.
The temperature of the surface at the top of the substrate is set to be the same as the temperature at the bottom of the CNT. Owing to the poor contact between the CNT and substrate, a surface heat source is introduced at the contact surface (z = 0).
where Rcontact is the contact resistance.
For a flat cathode, the bottom of the substrate may be assumed to be a heat source with a fixed temperature T0. In addition, the Nottingham effect and heat radiation should be considered at the top of the CNT.
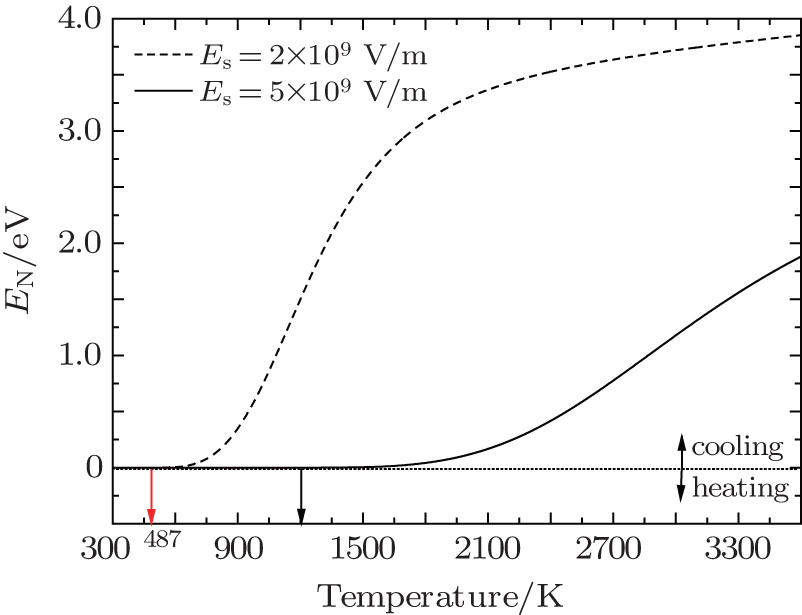
where EN is the net exchange energy for a single electron emitting from the surface of the CNT. The second term on the right-hand side of Eq. (6) indicates the influence of the Nottingham effect. When electrons are below the Fermi level tunnel and leave the metal, their replacement from the current supply fills the electron “sea” at the Fermi level. The energy difference between the electron lost and the electron replaced constitutes a small heat source. As the CNT temperature increases, this heating becomes less and eventually reverses to cooling.[42]
Paulini et al. proposed a fit formula of EN as[46]
where , , c = 0.687365/ϕ0.0525966, s = 3.48481, ϑ = ps/1 + ps, p = c(T/Ti − 1), aTi = π2k/2, a∞ = 2k. The approximation formula for the inversion temperature Ti is
where the optimized values of the ωi are as follows: ω1 = 7.1130×10⁻⁷, ω2 = 0.98604, ω3 = 0.47483, ω4 = 1.0296, ω5 = 0.91905, ω6 = 4.8022, ω7 = 8.8832×10⁻², ω8 = 0.15358, ω9 = 30.371.
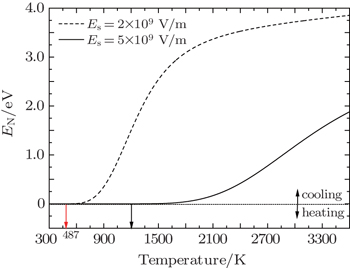
Figure 2 shows the relationships between net exchange energy EN and CNT temperature for values of 2×10⁹ and 5×10⁹ V/m. For the CNT work function ϕ = 5.1 eV,[47]Ti is equal to 487 K at Es = 2×10⁹ V/m, while Ti is equal to 1202 K at Es = 5×10⁹ V/m. When the temperature of the CNT is higher than the inversion temperature Ti, EN increases with the rise in temperature. The cooling of the Nottingham effect becomes remarkable at high temperatures. In addition, the cooling effect of the CNT reduces at the same temperature as Es increases from 2×10⁹ V/m to 5×10⁹ V/m. For example, at the melting point of the CNT,[47]EN decreases from 3.85 eV to 1.87 eV with an increase from 2×10⁹ V/m to 5×10⁹ V/m. Generally, the Nottingham effect is influenced by the temperature and external electric field nearby the emission surface. With low temperature and high electric field, the width of the surface potential barrier is relatively narrow. More low-energy electrons below the Fermi level can be emitted by tunneling the surface of the CNT. The CNT will be heated at this point. Conversely, more high energy electrons above the Fermi level will be emitted from the surface of the CNT under high temperature and low electric field. The cooling of the Nottingham effect cannot be ignored in this case.
According to Eqs. (1) and (2), Joule heating of the CNT and substrate depends on the emission current density. Considering the vacuum breakdown of the CNT, both temperature and electric field strength are high and therefore the Fowler–Nordheim equation[48] cannot be rational. According to the pioneering work (Murphy–Good equation),[49] Hantzsche developed a number of additive and harmonic combinations of the thermionic and FE formula to be:[50]
where A = 120, , C1 = 2.727 · 109 (ϕ/4.5)2, and D1 = 4.252 · 1017(ϕ/4.5)3.
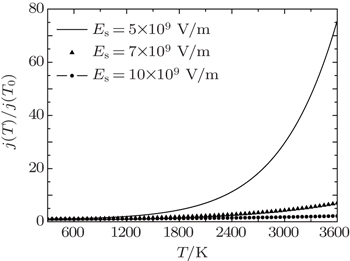
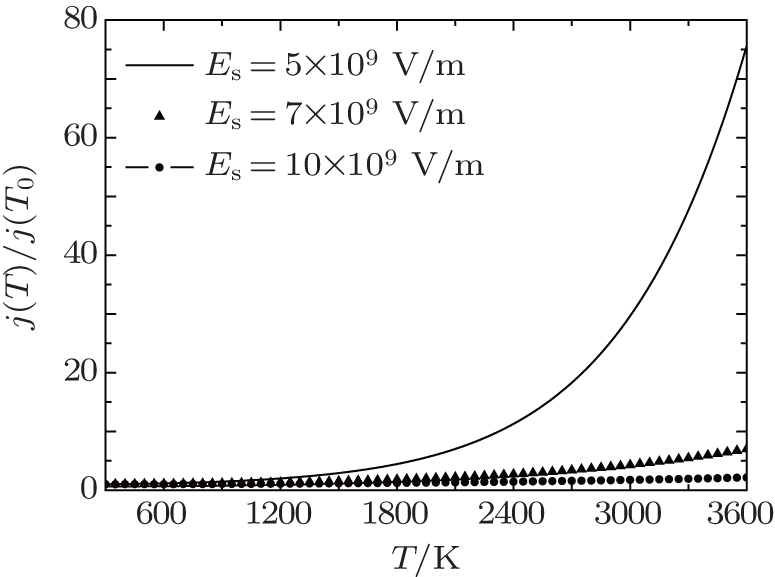
Figure 3 shows the effects of ratio j(T)/j(T0) on temperature for various values of electric field strength Es on the emitter surface. j(T)/j(T0) is directly proportional to the temperature of the CNT top. When Es = 5×10⁹ V/m, j(T)/j(T0) increases from 1 to 75 with the temperature of the CNT cap rising from T0 = 300 K to its melting point 3600 K. As Es increases from 5×10⁹ V/m to 1010 V/m, the emission current density becomes not sensitive to temperature at the CNT top. When, j(T)/j(T0) decreases to 2.15 at T = 3600 K.
Fig. 3. Effects of ratio j(T)/j(T0) on temperature for various values of Es.
3. Results and discussion
In this section, a finite element code (COMSOL Multiphysics V4.2a) is utilized to study the effects of parameters, such as CNT size, electric field strength, contact resistance, etc., on the onset of vacuum breakdown and failure of the CNT. The heat processes, including the Nottingham effect, joule heating, heat conduction and radiation, are represented in the heat transfer model.
3.1. Effects of CNT size
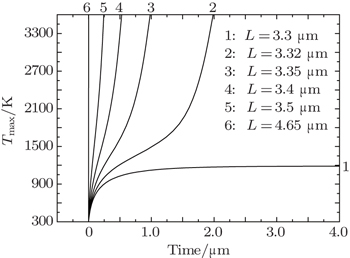
Figure 4 shows the time-evolutions of the CNT maximum temperature Tmax for various values of CNT length L. Ignoring the anode effect,[51] the field enhancement factor β at the emission tip can be expressed as β ≈ 1.2[2.15 + L/r]0.9.[52] The material parameters of the CNT and Fe substrate are listed in Table 1.
Fig. 4. Time-evolutions of CNT maximum temperature Tmax for several different values of L ranging from 3.3 μm to 4.65 μm (r = 6 nm, Rcontact = 1000 Ω, E0 = 200 kV/cm).
When L = 3.3 μm, Tmax is almost a constant (1186 K) after 3.8 μs, which is far blow the melting point of the CNT. In this case, the CNT reaches an equilibrium state. With L increasing from 3.3 μm to 3.32 μm, a thermal runaway occurs. It is obvious that the emission current of the CNT increases with L. When L reaches a critical value, heat generated by joule heating cannot be dissipated by heat conduction and surface heat radiation. Then, the heat accumulation leads to a temperature rise of the CNT. According to Eq. (9), the TF emission current is proportional to the temperature of the CNT. Therefore, a positive feedback will continue until the CNT reaches its melting point (or vacuum breakdown). Here, the time interval of the CNT reaching its melting point is expressed as tb. With L increasing from 3.32 μm to 4.65 μm, tb decreases from 1.99 μs to 1.52 ns.
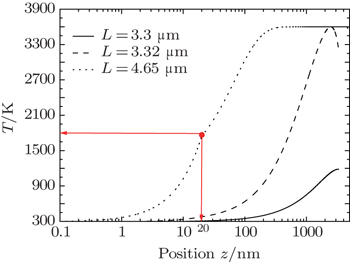
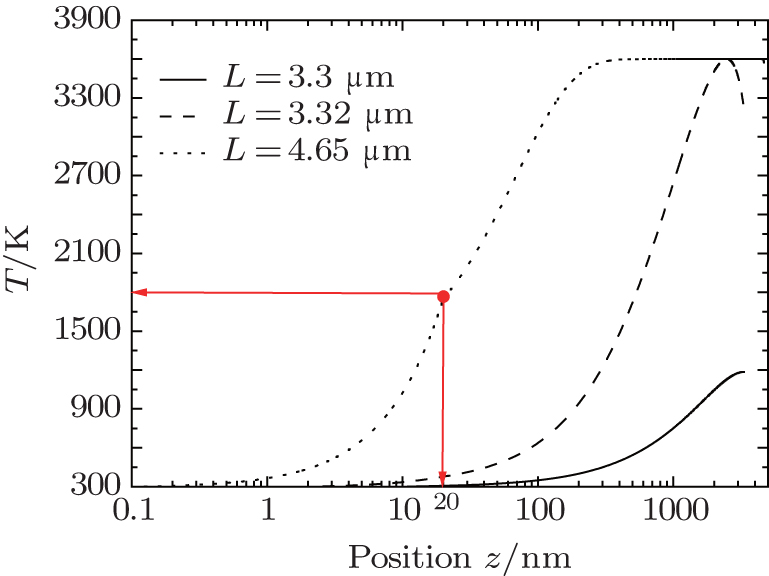
Figure 5 presents temperature distributions along the axis of the CNT at onset time of vacuum breakdown or heat equilibrium for different values of L. Other parameters are the same as those in Fig. 4. Notably, when L = 4.65 μm, the top of the Fe substrate (z = 20 nm) reaches its melting point (1800 K) at the onset time of the CNT vacuum breakdown. When L > 4.65 μm, the Fe substrate becomes melted before the CNT vacuum breakdown. Thus, L = 4.65 μm is the critical length for state change from heat equilibrium to vacuum breakdown. The influence of the Nottingham effect on the position of Tmax is also shown in Fig. 5. When L = 3.3 μm, the position zmax of Tmax is located at the emission top of the CNT. In this situation, the CNT reaches an equilibrium state and the Nottingham effect can be ignored. When L = 3.32 μm, the temperature of the emission top is 3192 K. The position zmax equals 0.74L (2482 nm). When the CNT reaches its melting point, the Nottingham effect will cool the emission surface. The inversion temperature Ti is 1740 K in this case. When L = 4.65 μm, the large part of the CNT body nearby the position zmax is approximate to the melting point of the CNT. This phenomenon could be caused by the rapid temperature rise and poor performance of heat conduction. Then, the CNT can be fractured and shortened under the action of electrostatic force during the TF emission. According to previous experimental investigations, when the contact between the CNT and substrate is sufficiently strong, the failure of the CNT emitter tends to take place at the Tmax point, leading to a segment-by-segment breakdown mode which is in good agreement with in-situ TEM observations by Doytcheva et al.[56] and Wei et al.[37]
Fig. 5. Temperature distributions along the axis of the CNT at the onset time of vacuum breakdown or heat equilibrium for three different values of L.
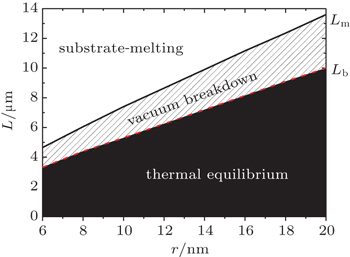
In summary, with an increase in CNT length L, the thermal response of the CNT during TF emission presents three different states: heat equilibrium, vacuum breakdown, and substrate melting. Two critical lengths should be introduced for state changing. Lb is defined as the critical length for state change from heat equilibrium to vacuum breakdown. Similarly, Lm is defined as the critical length for state change from vacuum breakdown to substrate melting. Figure 6 shows curves (Lb and Lm) separating the square into three areas. Heat equilibrium appears when the structure parameters of the CNT fall in the black area. A vacuum breakdown caused by a thermal runaway appears when structure parameters of the CNT fall in the bias area. For the upper area, the Fe substrate reaches a substrate-melting state.
Fig. 6. Influence of CNT size on the thermal response of the CNT in TF emission.
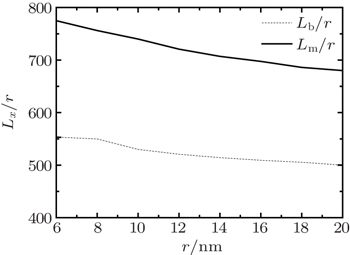
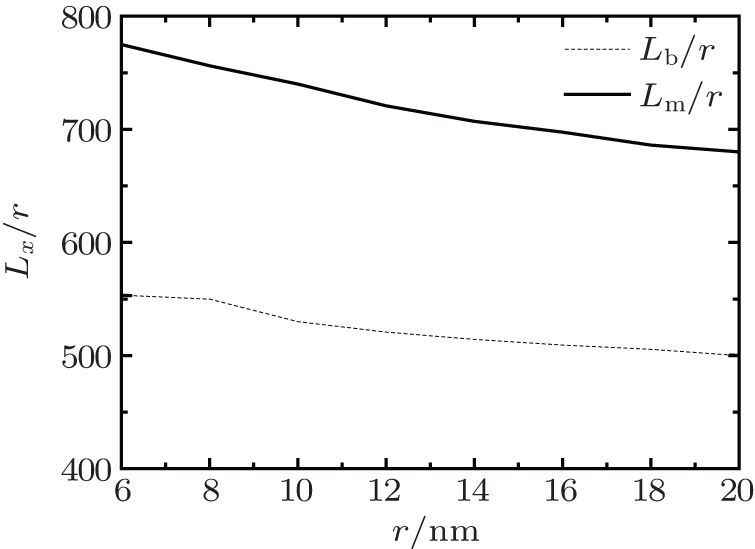
Figure 7 shows the relationships between ratios (Lb/r, Lm/r) and CNT radius rrespectively. With the radius r increasing from 6 nm to 20 nm, ratios Lb/r and Lm/r decrease. That is to say, the critical lengths Lb and Lm with various radii are not obtained at the same field enhancement factor (or the same emission current density). With an increase in the CNT radius, the number of the micro-heat sources increases and the superimposition heat is enhanced under the heat conduction. That is the reason why ratios Lb/r and Lm/r of thick CNT are smaller than those of thin CNT.
Fig. 7. Relationships between ratios (Lb/r, Lm/r) and CNT radius r respectively.
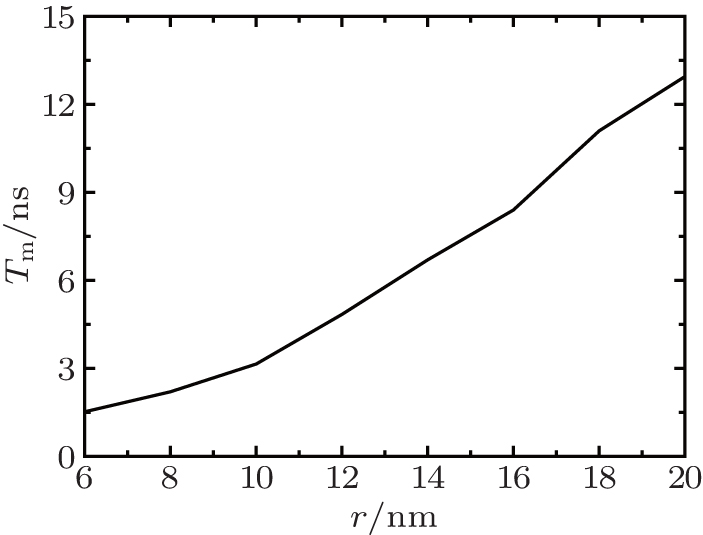
The relationship between Tm and the CNT radius r is shown in Fig. 8. tm is defined as the time interval of the substrate reaching its melting point. With the CNT radius r increasing from 6 nm to 20 nm, tm increases from 1.52 ns to 12.95 ns. This phenomenon could be explained by the competitive relation between the joule heating and cooling effects caused by heat conduction and radiation. For short and thick CNT, the heat conduction and radiation are larger than those for high and thin CNT. Drastic competition leads to the increase of tm.
Fig. 8. Dependence of the time interval of the substrate reaching its melting point Tm on the CNT radius r.
3.2. Effects of electric field strength
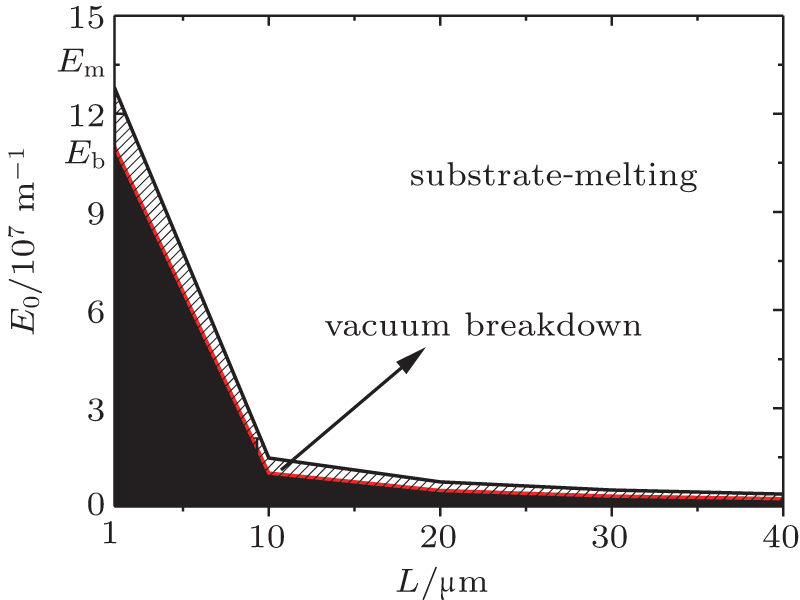
According to Eq. (9), the current density is in direct proportion to the average electric field strength E0. Therefore, the thermal response of the CNT during TF emission can be influenced by E0. Here, the critical electric field strength for the state change from heat equilibrium to vacuum breakdown is expressed as Eb. Similarly, Em denotes the critical electric field strength for the state change from vacuum breakdown to substrate melting. Figure 9 shows the relationships between critical strengths (Eb, Em) and CNT length L respectively. The values of CNT length L equal 1, 10, 20, 30, and 40 μm respectively. Other parameters are the same as those in Fig. 4. If L and E0 fall in the black area, the CNT reaches a heat equilibrium state. If L and E0 fall in the bias area, the vacuum breakdown event may be caused by thermal runaway. For the upper area, the Fe substrate melts before the vacuum breakdown of the CNT. Eb, Em, and their differences are inversely proportional to L, i.e., the long CNT may be more sensitive to E0 than the shorter one with the same CNT radius.
Fig. 9. Relationships between critical values (Eb, Em) and CNT length L respectively.
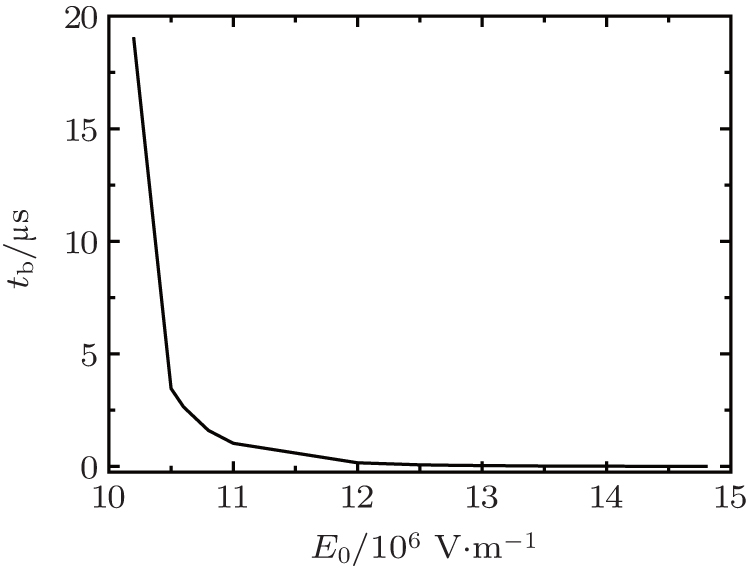
Figure 10 shows the relationship between tb and E0. The range of E0 is located in the bias area (see Fig. 9). With E0 increasing from 1.02×10⁷ V/m to 1.48×10⁷ V/m, tb decreases from 19 μs to 3.5 ns.
Fig. 10. Relationship between tb and E0 with r = 10 nm and L = 10 μm.
3.3. Effects of contact resistance
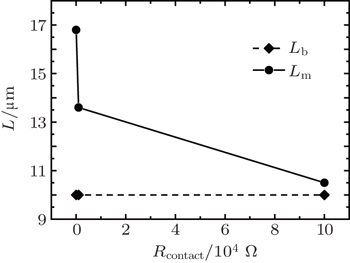
Owing to the poor contact between the CNT and substrate, the surface heat source caused by Joule heating cannot be ignored. In fact, the contact resistance is liable to increase during FE, because some conducting channels may break up mechanically by the tensile loading of the CNT due to electrostatic force.[36] Figure 11 shows the relationships between critical lengths (Lb, Lm) and contact resistance respectively. The values of contact resistance Rcontact equal 10, 103, and 105 Ω respectively. Other parameters are the same as those in Fig. 6. Lm decreases from 16.8 μm to 10.5 μm with Rcontact increasing from 10 Ω to 105 Ω. In addition, Lb is not sensitive to Rcontact. That means that the substrate-melting might not appear at the lower CNT length with low Rcontact, which can be indirectly verified by Ribaya et al.’s experiment.[29] Ribaya et al. proposed a method to enhance the electrical reliability of individual CNT cathode by optimizing the thickness of Ni film coating on the Si microstructure. They suggested that an increase of the thickness of the Ni film coating to 25 nm should eliminate the heat-induced failure by reducing the contact resistance.
Fig. 11. Relationships between critical lengths (Lb, Lm) and contact resistance respectively with E0 = 200 kV/cm and r = 20 nm.
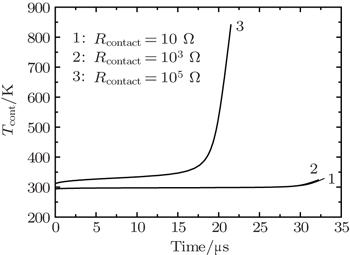
Here, the temperature rise of the contact surface before the onset of CNT vacuum breakdown is expressed as Tcont. Figure 12 shows time-evolutions of Tcont for three different values of Rcontact. L equals the critical length Lb. Other parameters are the same as those in Fig. 11. When Rcontact equals 10 Ω or 103 Ω, Tcont is very small. When Rcontact = 105 Ω, Tcont is 841 K (far below the melting point of CNT). Therefore, the effect of the temperature rise of the substrate on the CNT vacuum breakdown can be ignored. That is why Lb is not sensitive to Rcontact.
Fig. 12. Time-evolutions of Tcont for three different contact resistances.
3.4. Effects of CNT material parameters
In previous experiments, the measurement results of thermal conductivity[54,57] and resistivity[58] of CNT were discussed. Thermal conductivity represents the performance of the heat conduction of the CNT. The resistivity affects the Joule heating of the CNT during TF emission. Thus, the effects of thermal conductivity and resistivity on the thermal response of CNT should be considered. Figure 13 shows the relationships between critical lengths (Lb, Lm) and CNT heat conduction κCNT respectively. Other parameters are the same as those in Fig. 6. With κCNT increasing, the critical length Lb increases and Lm decreases. This phenomenon can be explained as follow. When κCNT increases from 50 W/m·K to 500 W/m· K, the performance of the heat conduction of the CNT can be improved. More heat can be conducted to the substrate, wall and top cap of the CNT, and then the heat disperses by heat radiation and heat conduction. Thus, the temperature rise of the CNT body can be reduced and the substrate may be heated up more quickly.
Fig. 13. Relationships between the critical lengths (Lb, Lm) and the CNT heat conduction κCNT respectively for r = 20 nm.
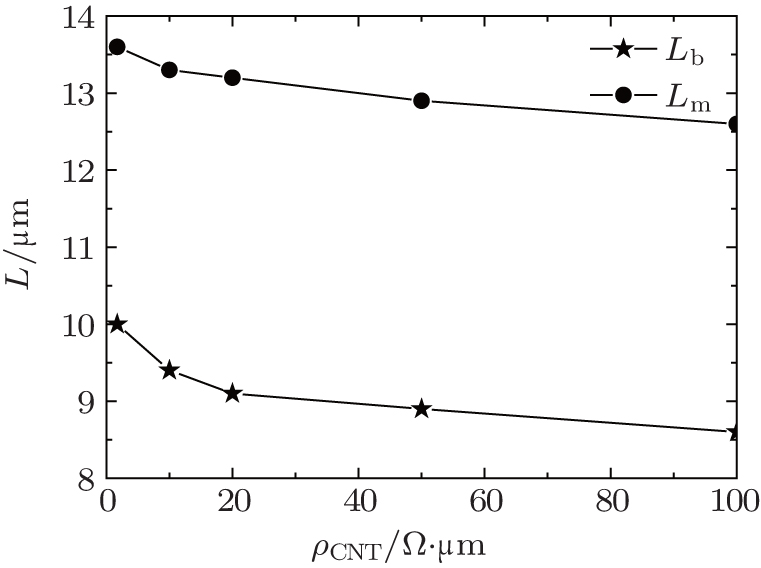
Figure 14 shows the relationships between the critical lengths (Lb, Lm) and CNT resistivity ρCNT. The parameters are the same as those in Fig. 6. With ρCNT increasing, both Lb and Lm decrease. Obviously, the heat of the CNT, generated by Joule heating and heat flux conducting to the substrate, increases with ρCNT increasing, which means that the vacuum breakdown of the CNT and substrate-melting can appear at a lower CNT length with high ρCNT.
Fig. 14. Relationships between the critical lengths (Lb, Lm) and CNT resistivity ρCNT for r = 20 nm.
4. Effects of various substrate materials
As is well known, chemical vapor deposition (CVD) is by far the most important technique presently available for preparing the CNT film or arrays. The CVD process is based on the decomposition of hydrocarbon gas over a transition metal (such as Ni, Co, Fe, and Mo) that acts as a catalyst. To grow the CNT on a substrate, the catalyst is first deposited on the substrate surface and subsequently, in a reduction process in hydrogen gas, the catalyst film breaks into many small particles of sizes in a nanometer scale. A single CNT may grow from one of the catalyst particles in a bottom-growth process. In the bottom-growth process, the catalyst particles remain at the surface of the cathode.[59] The effects of this kind of substrate material (or catalyst) are calculated in this section. The parameters of the substrate materials are listed in Table 2.
Table 2.
Table 2.
Table 2.
Material parameters of substrates.
.
Table 2.
Material parameters of substrates.
.
According to the simulation results, Lb is not sensitive to the kind of substrate. The effects of various substrates on the vacuum breakdown of CNT can be ignored.
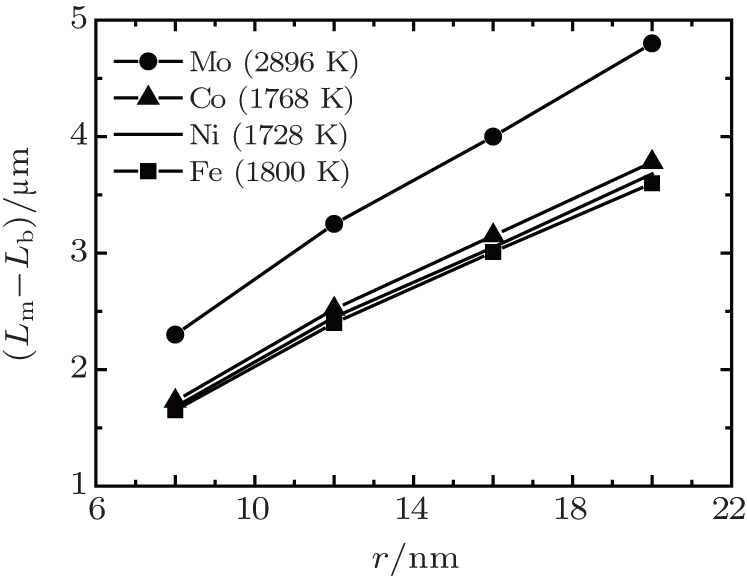
Generally, the material parameters can affect temperature rise and substrate-melting as well. The substrate with a high melting point and high thermal conductivity is difficult to melt. In addition, the product of specific heat and density determines the temperature rise of the material, caused by unit heat (see Eq. (2)). According to Table 2, the order of the melting point from high to low is Mo, Fe, Co, Ni; the descending order of thermal conductivity is Mo, Co, Ni, Fe; the product of specific heat and density from large to small can be listed in the order: Mo, Fe, Co, Ni. Thus, it is difficult to analyze the effect of substrate material on Lm by simple comparison of material parameters. Figure 15 shows the relationships between Lm − Lb and the CNT radius for substrates of different materials. The value of Lm − Lb increases with the CNT radius increasing. The descending order of Lm − Lb is Mo, Co, Ni, Fe. That means the effects of the melting point and thermal conductivity are more important than the product of specific heat and density in this case.
Fig. 15. Relationships between Lm − Lb and the CNT radius for substrates of different materials.
5. Conclusions
Initiation of vacuum breakdown and the failure mechanism of the CNT during thermal FE are analyzed by using the finite element method. The Nottingham effect and heat radiation are taken into account in the thermal response of the CNT. It is found that the thermal response of CNT during TF emission presents three different states: heat equilibrium, vacuum breakdown, and substrate melting. There are two critical lengths (Lb and Lm) for the state change. The characteristics of the CNT, electric field strength, contact resistance and the kind of substrate material influence the value of the critical length. Lb is in direct proportion to the CNT thermal conductivity κCNT and inversely proportional to the CNT resistivity ρCNT, and the average electric field strength E0. Lm is inversely proportional to ρCNT, E0, and the contact resistance Rcontact. The onset time interval tb, which represents the time interval of the CNT reaching its melting point, is not sensitive to Rcontact, but decreases rapidly with the increase of E0. In addition, the effect of the substrate material on the critical length cannot be analyzed by varying the material parameters. The material parameters can affect temperature rise and substrate-melting as well. The descending order of Lm − Lb is Mo, Co, Ni, Fe. The effects of melting point and thermal conductivity are more important than the product of specific heat and density.
TeoK B KMinousEHudanskiLPeaugerFSchnellJ PGangloffLLegagneuxPDieumegardDAmaratungaG A JMilneW I2005 Nature437 968
11
MilneW ITeoK B KMinousEGroeningOGangloffLHudanskiLSchnellJ PDieumegardDPeaugerFBuI Y YBellM SLegagneuxPHaskoGAmaratungaG A J2006 J. Vac. Sci. Technol.24 345


 , Liu Lie1, Ju Jin-Chuan1, Zhao Xue-Long1, Zhou Hong-Yu1, Wang Xiao2]