Xie Yang, Han Hai-Nian, Zhang Long, Yu Zi-Jiao, Zhu Zheng, Hou Lei, Pang Li-Hui, Wei Zhi-Yi. Frequency-stabilized Yb:fiber comb with a tapered single-mode fiber. Chinese Physics B, 2016, 25(4): 044208
Permissions
Frequency-stabilized Yb:fiber comb with a tapered single-mode fiber
Xie Yang1, Han Hai-Nian2, †, , Zhang Long2, Yu Zi-Jiao2, Zhu Zheng2, Hou Lei2, Pang Li-Hui2, Wei Zhi-Yi2, ‡,
School of Physics and Optoelectronic Engineering, Xidian University, Xi’an 710071, China
Beijing National Laboratory for Condensed Matter Physics, Institute of Physics, Chinese Academy of Sciences, Beijing 100190, China
† Corresponding author. E-mail: hnhan@iphy.ac.cn
‡ Corresponding author. E-mail: zywei@iphy.ac.cn
Project supported by the National Basic Research Program of China (973 Program) (Grant No. 2012CB821304) and the National Natural Science Foundation of China (Grant No. 61378040).
Abstract
Abstract
We demonstrate a stable Yb:fiber frequency comb with supercontinuum generation by using a specially designed tapered single-mode fiber, in which a spectrum spanning from 500 nm to 1500 nm is produced. The carrier-envelope offset signal of the Yb:fiber comb is measured with a signal-to-noise ratio of more than 40 dB and a linewidth narrower than 120 kHz. The repetition rate and carrier-envelope offset signals are simultaneously phase locked to a microwave reference frequency.
Optical frequency combs have promoted great development in frequency metrology over the past few decades.[1,2] Fiber frequency combs are becoming increasingly prevalent due to their excellent long-term operation, compactness and environmental stability.[3,4] In some special applications, such as time and frequency transfer, absolute large distance measurement and calibration of high-resolution spectrographs, fiber combs are always chosen over Ti:sapphire frequency combs, being reliable and dependable tools.[5–10]
The introduction of Yb:fiber frequency combs contributes to the improvements in optical linewidth, phase-locking performance, repetition rate, and average power.[11,12] The state-of-the-art Yb:fiber comb with submillihertz linewidth and more than 10-W average power was reported by JILA and IMRA in 2008, and using such a comb laser they continued to succeed in the generation of extreme ultraviolet combs at MHz level repetition rate which are very important for research in fundamental physics and nuclear spectroscopy.[11,13] In the process of constructing a Yb:fiber comb system, the generation of a spectrum spanning more than an optical octave is necessary to measure the carrier-envelope offset (CEO) signal of the femtosecond pulse train by a self-reference technique. Photonic crystal fiber (PCF) is normally chosen as a nonlinear medium to broaden the spectrum emitted directly from the oscillator or amplifier.[14,15] As an alternative method, the tapered single-mode fiber (TSMF) technology has been developed and has drawn more attention recently.[16,17] Compared with the PCF, the TSMF also has the advantages of good repeatability, a high nonlinear coefficient, and an adjustable zero dispersion wavelength (ZDW). Besides, the TSMF is low-cost and has a double-funnel structure enabling an easy coupling process with high efficiency. To our knowledge, using a TSMF in a frequency comb has not yet been reported. Last year, we generated a supercontinuum (SC) and measured the CEO signal in an Yb: fiber laser by using a section of TSMF with a diameter of 3 μmm and a tapered length of 9 cm.[18] A spectrum ranging from 500 nm to 1500 nm and a CEO signal with a signal-to-noise ratio (SNR) of nearly 30 dB were obtained. But in that case, the commercial Yb:fiber oscillator (Menlosystems GmbH) that we used was unable to adjust the dispersion in the cavity, so we had no opportunity to optimize the characteristics of the CEO signal, including the SNR and the linewidth.
In this paper, we utilize a nonlinear polarization evolution (NPE) mode-locked Yb:fiber oscillator at a repetition rate of 222 MHz which is built by ourselves instead of the previous commercial laser. After one stage single-mode fiber amplification and grating pair compression, laser pulses with a power of approximately 350 mW and a duration of 79 fs are coupled into a segment of TSMF. An SC spectrum ranging from 500 nm to 1500 nm is obtained, similar to our results in Ref. [18]. Based on the SC spectrum, the optimized SNR of the CEO signal reaches 44 dB and the linewidth decreases to nearly 110 kHz. The repetition rate and the CEO signal are phase-locked to the outside microwave reference and show the same stability as the reference source.
2. Experimental setup
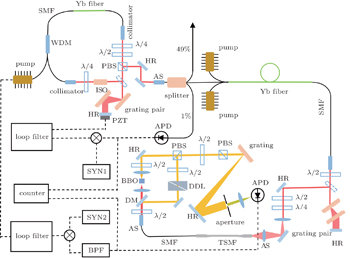
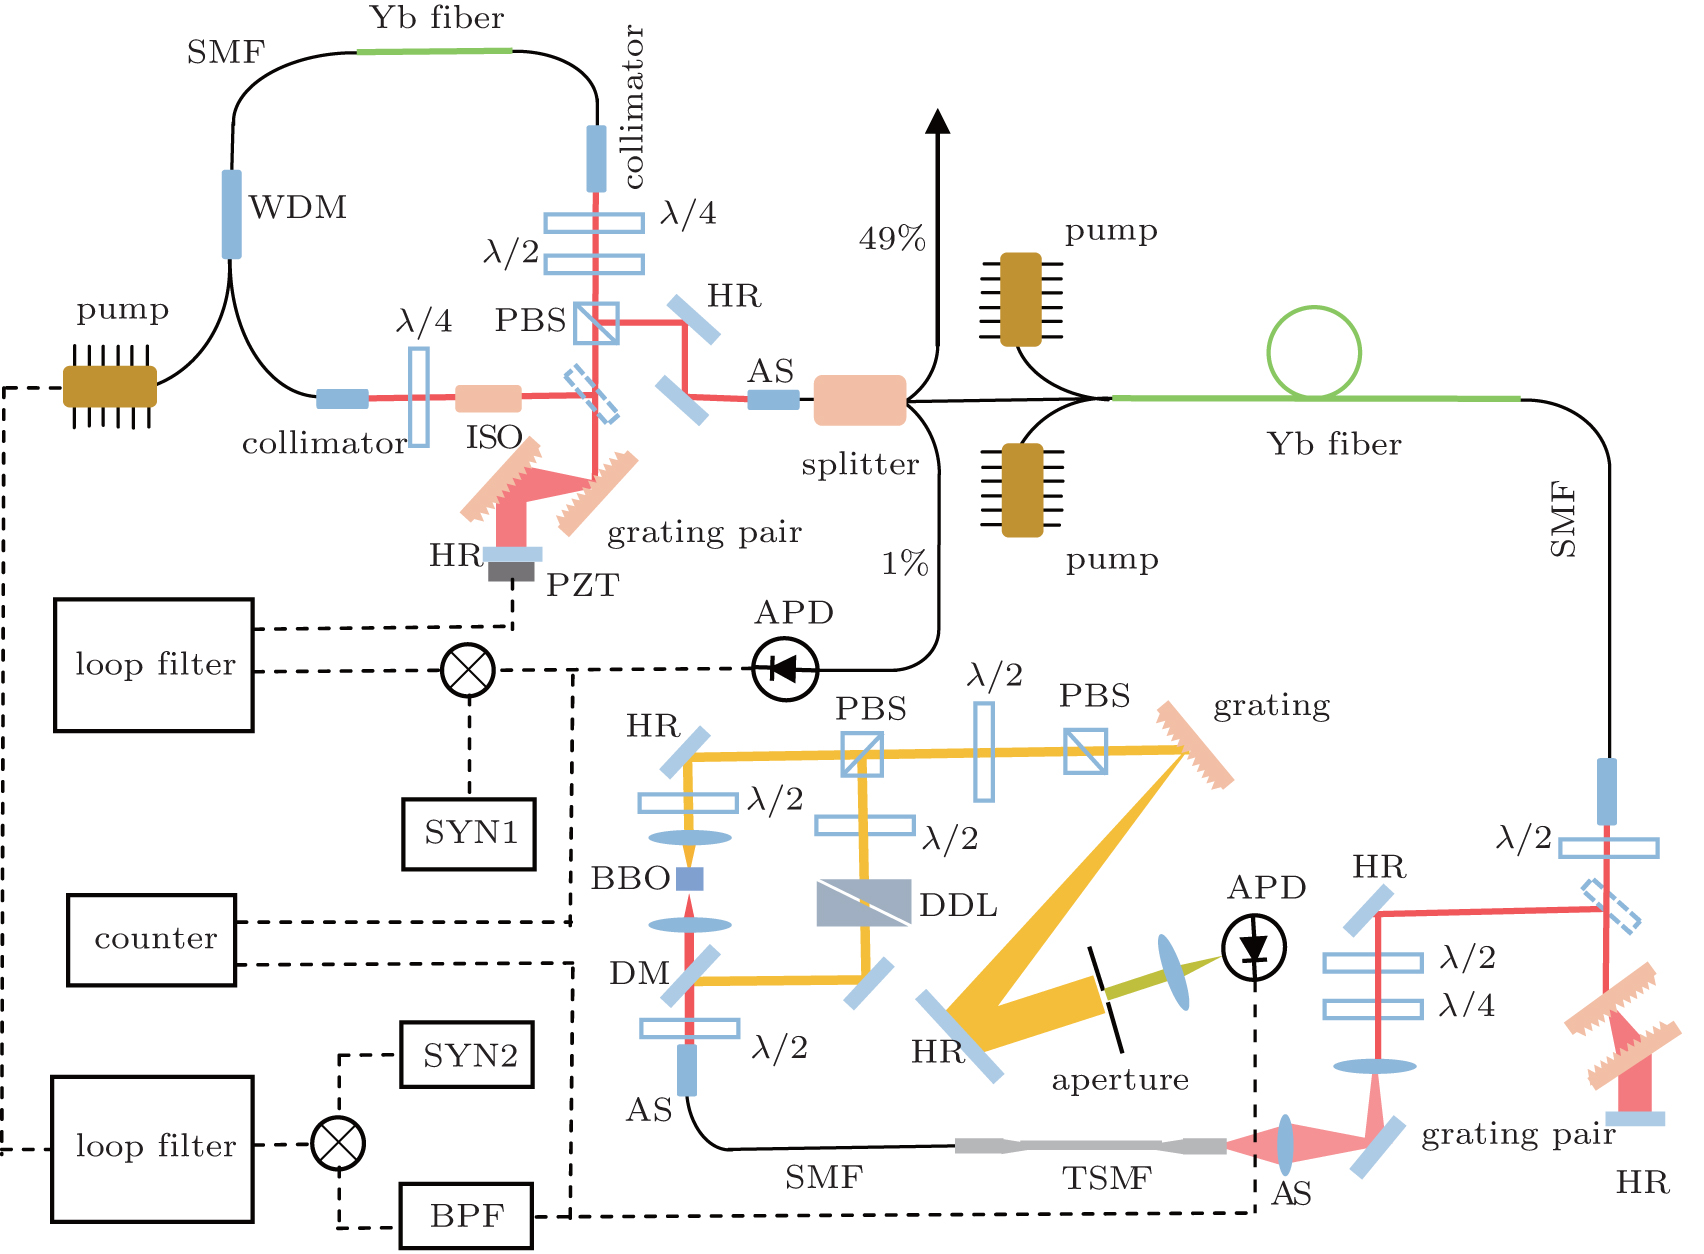
The schematic diagram of the experimental setup is shown in Fig. 1. The Yb-doped fiber oscillator is mode-locked by the NPE technique and operates in the stretched pulse regime with a standard ring cavity design. The gain medium is a section of highly Yb-doped single-mode fiber (Coractive, Yb 125) with a length of 15 cm. The free-space section consists of a polarization dependent isolator, two highly reflecting mirrors, three wave plates (two quarter-wave plates, one half-wave plate), a polarization beam splitter (PBS) and a pair of 600 lines/mm reflection gratings. The pump laser utilizing a laser diode at the wavelength of 976 nm is coupled into the Yb-doped fiber ring cavity via a wavelength division multiplexer (WDM).
Fig. 1. Experimental setup of the Yb:fiber frequency comb based on a tapered single-mode fiber. AS: aspherical lens, DDL: dispersion delay line, DM: dichroic mirror, and BPF: band pass filter.
In order to meet different demands, the output pulses directly from the oscillator are coupled into a fiber splitter by an aspherical lens and then divided into three routes with average powers of 1%, 49%, and 50% respectively. The 1% route is used for detecting and controlling the repetition rate. The 49% route is reserved for monitoring the output pulses and other applications. The 50% route, about 30 mW, is used to measure the CEO signal of the Yb:fiber laser. We build a one-stage amplifier to amplify the laser pulses in the 50% route. The amplifier mainly consists of a 1-m-long single cladding Yb-doped fiber, a high power WDM, a polarization beam combiner, and two polarization-maintaining 976-nm laser diodes (LDs) with a total maximum output power of 1.3 W. The amplified pulses are then compressed by a pair of parallel 1000 lines/mm transmission gratings installed at the Littrow angle. In order to achieve an octave-spanning spectrum, the de-chirped pulses are injected into the TSMF (SMF-28, Coning) via an aspheric lens with a focal length of 6.24 mm. The cladding diameter and length of the tapered region are about 3 μmm and 9 cm, respectively. The down-tapering regions of both sides are both 3.5-cm long. Owing to the refractive index difference between the cladding and air, in the tapered region the pulses propagate within the whole cladding rather than being confined to the core. The nonlinear coefficient of the optical fiber mainly depends on the diameter of its core, the effective core area, and the refractive index difference between the core and cladding. The nonlinear coefficient of a 3-μm fiber is about 53 W−1·km−1 at 1030 nm. The third order dispersion has almost no effect on the SC generation with TSMF. In this work we just consider the group velocity dispersion, which is about −46 ps2/km at 1030 nm. Meanwhile, the ZDW of the TSMF used in this work is calculated to be about 830 nm.[19,20]
Wavelengths in the long wavelength part and short wavelength part of the SC spectrum are selected to measure the CEO signal. Using a dichroic mirror, the long wavelength part and the short one are divided into two routes and injected into a typical f-to-2f interferometer. To adjust the time delay of the pulses in the two routes, a dispersion delay line consisting of two rectangular prisms is located in the short wavelength route. A BBO crystal with the three-dimensional size of 3 mm×3 mm×3 mm is placed in the long wavelength route to efficiently double frequency from 1180 nm to 590 nm. The polarization of the pulses is optimized by rotating the half wave-plate in each route, and the two beams are then combined by a PBS. In order to measure the CEO signal, a reflection grating is used to diffract the beam in the parallel plane and the light is then focused onto an APD.
The schematic diagram of the electronic locking system for the repetition rate and the CEO signal is shown in the lower-left corner of Fig. 1. In general, the repetition rate and the CEO signal can be controlled independently, according to actual requirements. In our experiment, we implement both lockings simultaneously to obtain absolute stability of each mode in the Yb:fiber comb. To stabilize the repetition rate, a piezoelectric transducer (PZT) attached to the back of a small reflecting mirror is used to control the cavity length. The repetition rate signal is detected by a fiber-coupled high-sensitivity PIN detector. The general approach to stabilizing the CEO signal is to adjust the pumping current of the laser diode of the Yb:fiber oscillator.
3. Results and discussion
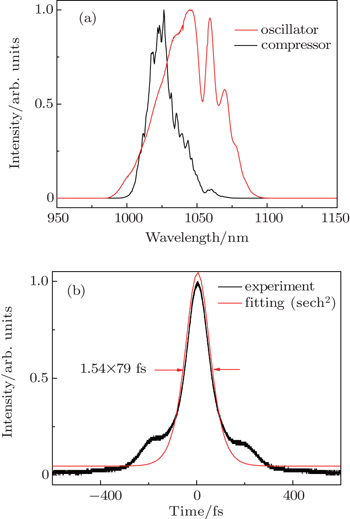
With a pump power of 365 mW, mode-locked pulses are emitted from the intra-cavity PBS with an average power of about 110 mW at a repetition rate of 222 MHz. The output spectrum of the oscillator is shown in Fig. 2(a), corresponding to a transform-limited pulse duration of 45 fs in theory. The duration of the chirped pulses from the oscillator is measured by the intensity autocorrelator to be about 0.8 ps (sech2 profile fitting). With 1.2 W of pump power, 730-mW amplified pulses are obtained, of which the optical-optical efficiency is about 61%. After being compressed by a pair of transmission gratings, de-chirped pulses with an average power of 680 mW are obtained, of which the spectrum is shown in Fig. 2(a). Owing to the gain narrowing effect in the process of amplification, the full width at half maximum of the spectrum is narrowed to about 17 nm and the theoretical transform-limited duration is about 63 fs. The intensity autocorrelation trace of the compressed pulse is depicted in Fig. 2(b), and the pulse duration is about 79 fs (sech2 profile fitting).
Fig. 2. (a) Normalized spectra of the oscillator (red curve) and after the compressor (black curve). (b) Experimentally measured intensity autocorrelation trace (black curve) after the compressor and sech2 fitting trace (red curve).
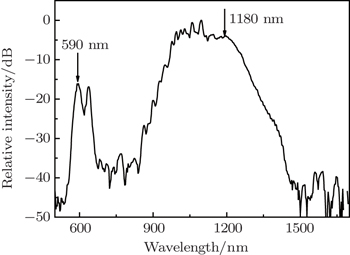
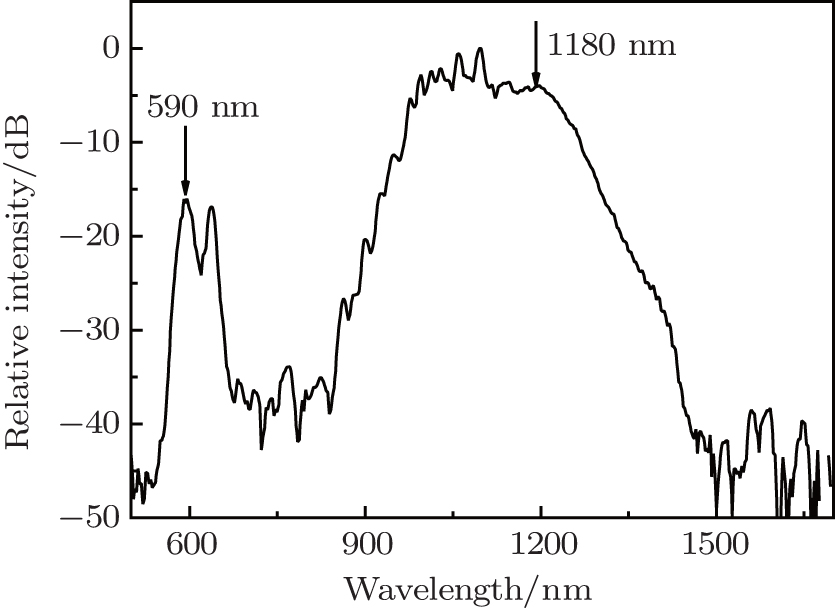
When the de-chirped pulses exceeding 200 mW are coupled into the TSMF, an octave-spanning spectrum is achieved. With the input power increasing, the range of the SC spectrum extends slowly and simultaneously to the longer and shorter wavelength regions. Figure 3 shows an SC spectrum from the TSMF with a coupled average power of 340 mW, corresponding to a peak power of 20 kW and a pulse energy of 1.5 nJ. It is obvious that the power at both wavelengths of 590 nm and 1180 nm in the SC spectrum is high enough to measure the CEO signal by a typical f-to-2f interferometer.
Fig. 3. Octave-spanning spectrum generated in the TSMF.
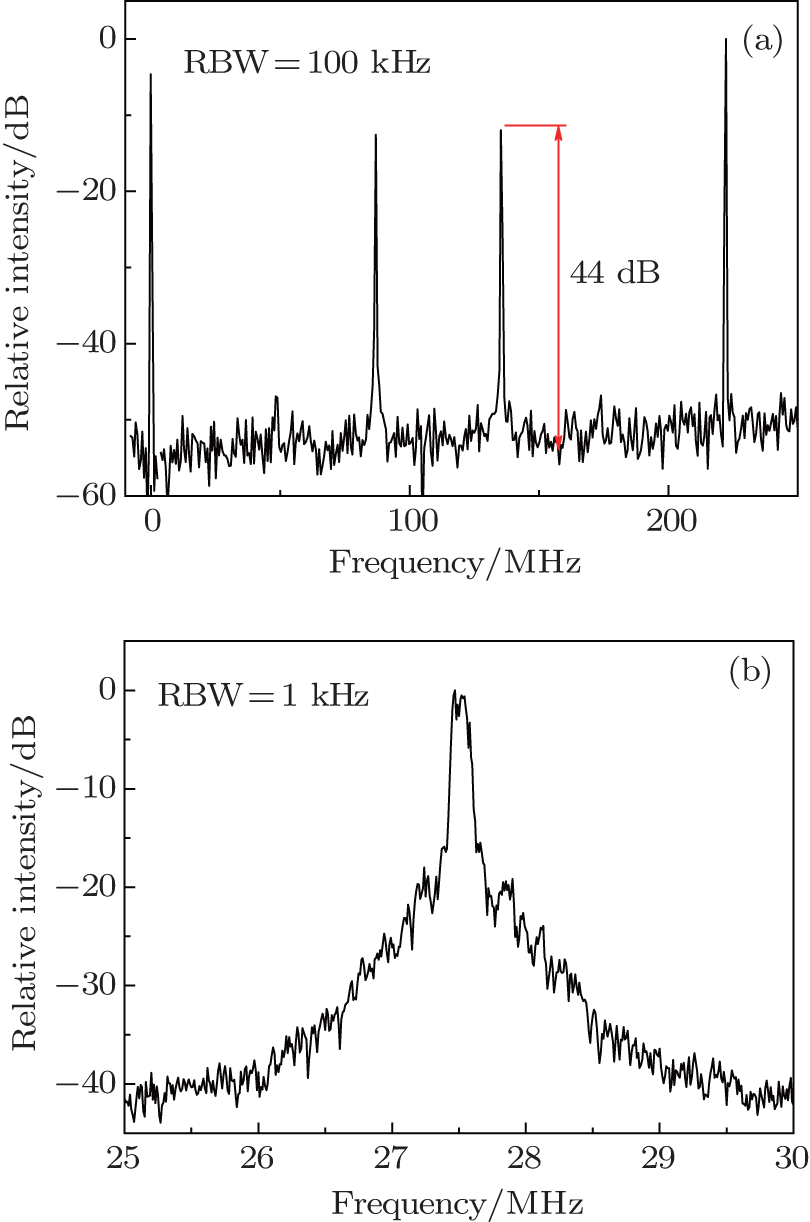
The SC spectrum is split into two routes which are then guided into a typical f-to-2f interferometer. Adjusting the insertion length of the rectangular prism placed in the short wavelength route and rotating the BBO crystal for the frequency-doubling process carefully, the CEO signal is measured by a frequency spectrum analyzer with high SNR. As shown in Fig. 4, the SNR of the CEO signal is about 44 dB with a resolution bandwidth (RBW) of 100 kHz. The SNR is observed to decrease slowly (about 10 dB after one day) due to the slow drift of the space coupling optical path. In terms of the linewidth of the CEO signal, optimizing the intra-cavity dispersion of the Yb:fiber oscillator by adjusting the spacing between the reflection grating pairs leads to considerable narrowing. When the spacing is about 25.5 cm, the net cavity dispersion is close to zero and the linewidth of the CEO signal is significantly compressed to less than 110 kHz with an RBW of 1 kHz. The feature of the CEO signal is good enough for phase locking.
Fig. 4. (a) The CEO signal with 44 dB SNR and (b) The bandwidth of the CEO signal at 1-kHz resolution bandwidth.
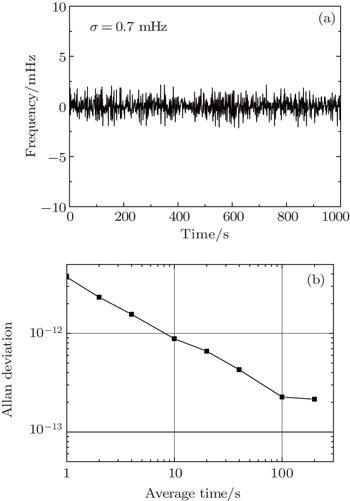
In order to improve the locking accuracy of the repetition rate, the fifth harmonic of the repetition rate is extracted and compared with a 1.11-GHz signal provided by a synthesizer (SYN1) with referencing to an outside reference source. The reference source is provided by the 10-MHz signal output port of a synthesizer (SYN2) with an Allan deviation of about 1×10⁻¹²/s. The control signal obtained from the loop filter is fed back to the PZT to control the cavity length of the Yb:fiber oscillator. The fluctuation of the repetition rate is recorded by a frequency counter. As shown in Fig. 5(a), the standard deviation is 0.7 mHz with an integration time of 1000 s. The calculated Allan deviation as shown in Fig. 5(b), indicates a tracking stability of 2.26×10⁻¹³/τ1/2 in a gate time of 100 s. The instability of the optical frequency comb contributes a value of 3.15 × 10⁻¹²/s by the repetition rate (at the center wavelength of 1030 nm).
Fig. 5. (a) Residual frequency fluctuation of the locking repetition rate, and (b) Allan deviation of the locking repetition rate.
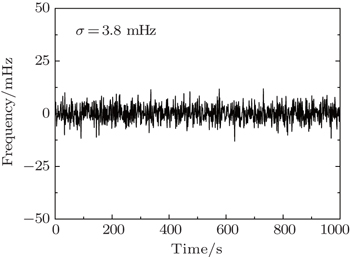
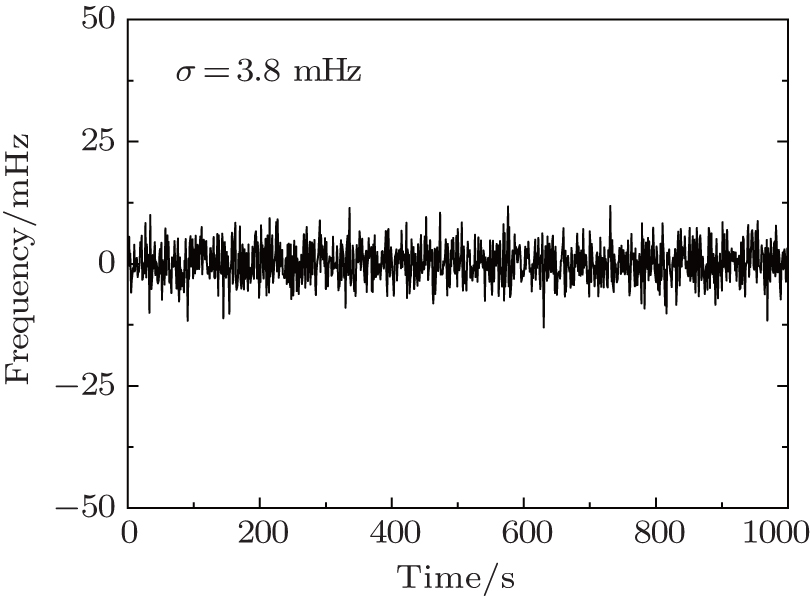
The CEO signal was set to be nearly 21.4 MHz by adjusting the pump current of the Yb:fiber oscillator. The CEO signal is obtained by a band pass filter, and the frequency of the reference signal from SYN2 is set to be 21.4 MHz. The error signal is obtained by the loop filter and fed back to stabilize the CEO signal by adjusting the pumping current of the Yb:fiber oscillator. As shown in Fig. 6, the standard deviation of the locked CEO signal is 3.8 mHz with an integration time of 1000 s. The instability of the optical frequency comb contributes a value of 1.3×10⁻¹⁷/s by the CEO frequency (at the center wavelength of 1030 nm). Therefore, the stability of the frequency comb mainly depends on the repetition rate. Limited by our locking technique, the linewidth of the locked CEO signal shows no significant narrowing compared with the unlocked CEO signal.
Fig. 6. Residual frequency fluctuation of the locked CEO signal.
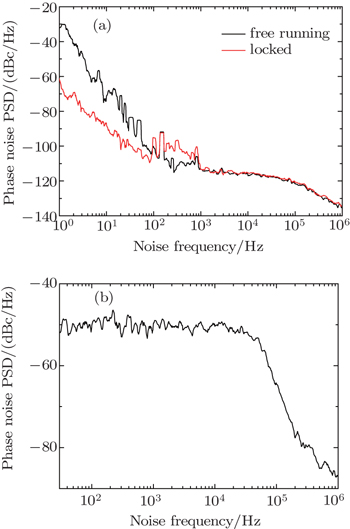
The phase noise power spectral densities (PSDs) of the repetition rate and the CEO signal are also measured and shown in Fig. 7. As shown in Fig. 7(a), while the repetition rate is in the free running state (black curve), the PSD is about −28 dBc at 1 Hz. If locked, the PSD decreases to about −58 dBc/Hz at 1 Hz. Limited by the response speed of the PZT, the phase noise is well suppressed below 100 Hz, but the phase noise at higher frequency still maintains the previous state. It is possible to compensate for those high frequency noises by using an electro-optical modulator or an acousto-optic modulator.
Fig. 7. Phase noise power spectral densities of (a) the repetition rate signal and (b) the locked CEO signal.
In order to reduce the phase noise of the CEO frequency, we utilize an LD pump source with a current modulation frequency of at least 200 kHz. The PSD of the locked CEO signal is shown in Fig. 7(b), the PSD is about −52 dBc at 30 Hz and the PSD curve starts to rapidly decrease at 100 kHz. From the trend of the curve, we can deduce that the phase noise of the CEO frequency below 100 kHz is well compensated for.
4. Conclusions
In this paper, we present a stable low noise 222-MHz Yb:fiber frequency comb based on TSMF. An octave-spanning SC spectrum from 500 nm to 1500 nm is generated via launching the 345-mW de-chirped pulses into the TSMF. A CEO signal with a high SNR of up to 44 dB and a linewidth of about 110 kHz are obtained. According to the stable CEO signal, we phase-lock the fifth harmonic of the repetition rate and the CEO signal simultaneously to a microwave reference source. Their phase noises are measured and clearly suppressed by the servo electronics. Owing to their compactness and inexpensiveness, fiber combs based on TSMF have great potential applications.


 , Zhang Long2, Yu Zi-Jiao2, Zhu Zheng2, Hou Lei2, Pang Li-Hui2, Wei Zhi-Yi2, ‡,