Second harmonic generation of metal nanoparticles under tightly focused illumination
Sun Jing-Wei1, Wang Xiang-Hui1, †, , Chang Sheng-Jiang1, Zeng Ming2, Zhang Na1
Institute of Modern Optics, Optical Information Science and Technology Key Laboratory of the Ministry of Education, Nankai University, Tianjin 300071, China
School of Electrical Engineering and Automation, Tianjin University, Tianjin 300072, China


† Corresponding author. E-mail: wangxianghui@nankai.edu.cn

Project supported by the National Natural Science Foundation of China (Grant No. 61378005).

Abstract
Abstract

The near-field and far-field second harmonic (SH) responses of a metal spherical nanoparticle placed in the focal region of a highly focused beam are investigated by using the calculation model based on three-dimensional finite-difference time-domain (FDTD) method. The results show that off-axis backward-propagating SH response can be reinforced by tightly focusing, due to the increase of the relative magnitude of the longitudinal field component and the phase shift along the propagation direction.

1. Introduction

Owing to the outstanding localized surface plasmon (LSP) resonance[1] leading to field localization and enhancement, metal nanoparticles can exhibit unique optical properties and have received great interest in the last decade.[2] Due to various applications, such as subwavelength emitters in high-resolution microscopy,[3] particle sizing,[4] and optical indicators for diagnostic purposes in medicine and biology,[5] metal nanoparticles are very necessary to thoroughly understand the interaction of focused beam with metal nanoparticles, especially after the incident beam is tightly focused by a high numerical aperture (NA) objective. Recently metal nanoparticles with various materials and shapes excited by highly focused beams have been investigated.[69] For example, the plasmon spectra of gold and silver nanospheres under tightly focused illumination have been studied[8] and it was found that higher-order multipoles (where the multipoles are those of the Mie theory) can be suppressed, compared to the case of plane wave (PW) illumination. The analyses on the influence of highly focused illumination on the near-field coupling of silver dimers[9] showed that larger maximum field enhancement and stronger localization of the near field can be induced by tightly focusing.

Nonlinear optical effects of metal nanoparticles also have attracted a lot of interest,[10,11] due to the potential applications, such as frequency mixing, wavelength converters, and optical switches. Second harmonic generation (SHG) is a frequency doubling process that is the simplest nonlinear optical response and forbidden in the bulk of centrosymmetric media,[12] e.g., metals, within the electric dipolar approximation. Hence, the SHG usually arises from the surface of metal nanoparticles, where centrosymmetry is broken.[13] Compared to the linear response, it has been experimentally demonstrated that SHG is more sensitive to the metal nanostructure shape.[14] We have already investigated the SHG of centrosymmetric dielectric nanoshperes excited by tightly focused linearly polarized beams[15] or cylindrical vector beams[16] in the frame of the nonlinear Rayleigh–Gans–Debye (RGD) theory[17] when the incident field is not significantly perturbed by particles of low refractive index contrast. However, for the case of metal nanoparticles, due to near-field effect, the excitation filed is not equivalent to the incident field and the RGD approximation is no longer valid. The near-field distributions around metal nanoparticles can be calculated by numerical methods, such as three-dimensional finite-difference time-domain (FDTD) numerical method.[18] Although FDTD has been used to investigate SHG microscopy, this method was applied only to the fundamental field (FF) but not the SHG field,[19] especially for the case of focused field illumination.

In this paper, we extend our previous research to the case of metal nanoparticles excited by focused field. The method based on three-dimensional FDTD algorithm will be employed to examine the near-field distribution and far-field radiation pattern of SHG from a gold spherical nanoparticle located in the focal region of a highly focused beam. The comparison between the results under PW and focused field illuminations indicates that for the case of focused field excitation, because of the increase of the relative magnitude of the longitudinal field component and the phase shift along the propagation direction, the magnitude of off-axis backward-propagating SH response becomes stronger.

2. Calculation model

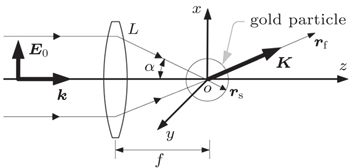
A schematic diagram describing SHG from a gold spherical nanoparticle under tightly focused illumination is shown in Fig. 1. An incoming monochromatic PW E0 at the fundamental frequency of ω propagates along the z axis and is focused by an infinity-corrected objective. The PW is assumed to be linearly polarized along the x axis. A spherical particle made of gold in the focal region is excited by the focused field and the SH response is induced. The origin O of the Cartesian coordinate system and the center of the particle are taken at the beam focus. k and K are the wave vectors of the fundamental incident beam and the scattered SH radiation, respectively. In the following analysis, it is assumed that the detection point is in the far field. rs and rf are the position vectors in the particle and the detection point, respectively. The parameter α is the maximal angle determined by the NA of the illumination objective.

Fig. 1. Schematic diagram of SH response from a spherical particle excited by a focused beam.

Following the vector diffraction theory of Richards and Wolf,[20] if a monochromatic PW linearly polarized in the x direction is normally incident upon the system shown by Fig. 1, the electrical field at a given point rp in the focal region can be expressed as

where φp is the azimuthal angle of the point rp. A = kfl0/2 is a constant proportional to the incident field amplitude l0. The integrals In are defined by

where k is the magnitude of the wave vector of the fundamental beam, Jn is the Bessel function of the first kind with order n, θp is the polar angle of the point rp. Then, the incident field is determined by its steady value (as calculated from Eq. (1)) multiplied by the time-harmonic factor exp(− i ωt).

For the case of a gold nanoparticle in the focal region, the RGD approximation is no longer valid and the excitation filed is not equivalent to the incident field. Three-dimensional FDTD algorithm will be employed to calculate the excitation field. Since the incident field can be determined analytically, the scattered field formalism for FDTD[18] will be adopted to reduce the computation burden.

Under the electric dipolar approximation, SHG can only be observed at the surface of metal nanoparticles, which is usually described by a sheet of nonlinear polarization induced by the excitation field at the fundamental frequency. The surface nonlinear polarization can be expressed as[21]

where is the surface second-order susceptibility tensor, h(rs) denotes the surface of the spherical particle, which implies that there is a surface dipole sheet because the symmetry of the bulk is broken at the surface of the particle. The surface is assumed to be locally flat. In the case of centrosymmetric medium possessing isotropic with a mirror plane perpendicular to the local surface, is a three-rank nonlinear susceptibility tensor and presents four non-zero elements: χs,⊥⊥⊥, χs,⊥∥∥, χs,∥ ⊥ ∥ = χs,∥∥⊥, where ⊥ and | | correspond to the directions perpendicular (along ) and parallel (along and ) to the local surface, respectively. We consider only the χs,⊥⊥⊥ component, which is known to dominate the surface response for metallic nanoparticles.[22,23] Therefore, equation (3) reduces to

The coordinate transformation of the surface susceptibility tensor between the local surface coordinate and the Cartesian coordinate is implemented. After that, the double multiplication between the electrical vector and the nonlinear susceptibility tensor is performed and then the surface polarization can be described as

From Eq. (5), it can be found that the surface polarization relates to all three Cartesian components of FF. Therefore, the effect of the vector property of the FF on the SH response of centrosymmetric nanoparticle should be taken into account.

Because the SH response is driven by the nonlinear polarization source rather than the incident field and there is no need to decompose the total components into the incident and scattered terms, the total field formalism for FDTD[24] will be employed to calculate the near-field distribution of SHG.

In many practical cases, it is easier to detect the far-field radiation of SHG. The propagation of the SHG field in a homogeneous and isotropic medium is governed by the inhomogeneous wave equation[25]

Green’s function approach can be utilized to resolve the inhomogeneous wave equation. For far-field radiation (rfrs), the radiation pattern of SHG can be presented in spherical coordinates

Here, Θ and Φ are the polar and azimuthal angles of the detection point rf, respectively, and K is the magnitude of the wave vector of the SH radiation.

3. Simulation results and discussion

Based on the three-dimensional FDTD algorithm, we developed a MATLAB code to investigate SHG from a gold nanoparticle excited by focused beams. In the following simulations, the center of the spherical particle with a diameter of 200 nm is located at the focus. The fundamental wavelength λ is 780 nm. The incident light is linearly polarized along the x axis and focused by a focusing objective with NA = 0.9. In the three-dimensional FDTD calculations, the simulated area have 500 nm×500 nm×500 nm dimensions along the x, y, and z directions and the mesh grid is set to 2.5 nm in all directions. The time step Δt is smaller than the Courant time step tc and takes the value of 0.9tc. The convolutional perfect matched layers are adopted as the absorbing boundaries. The optical constants for gold are obtained from Ref. [26]. The medium surrounding the particle is assumed to be air.

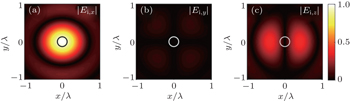
Firstly, we examine the properties of the focused field calculated using the vector diffraction integrals (as shown by Eq. (1)). Figures 2(a)2(c) show the normalized intensity distributions of the three Cartesian components of the focused field in the focal plane. The intensities are normalized with respect to the peak magnitude of Ei,x. The x and y axes by the dimensions of 2λ × 2λ are along the horizontal and vertical directions, respectively. The circle denotes the location of the gold particle in the focal plane. As seen in Fig. 2, the relative magnitude of Ei,x is the strongest and the intensity maximum is observed at the focus. Therefore, the component Ei,x will play the dominant role in the interaction of a linearly polarized focused beam with metal particle. The intensities of the components Ei,y and Ei,z at the focus are all zero. In addition, the component Ei,y is weakest and then the effect of this component can be effectively ignored. However, according to careful investigation, it should be noted that the relative magnitude of Ei,z can reach 0.3 at the surface of the metal particle. Hence, in some cases it is likely that the role of the component Ei,z should be taken into account.

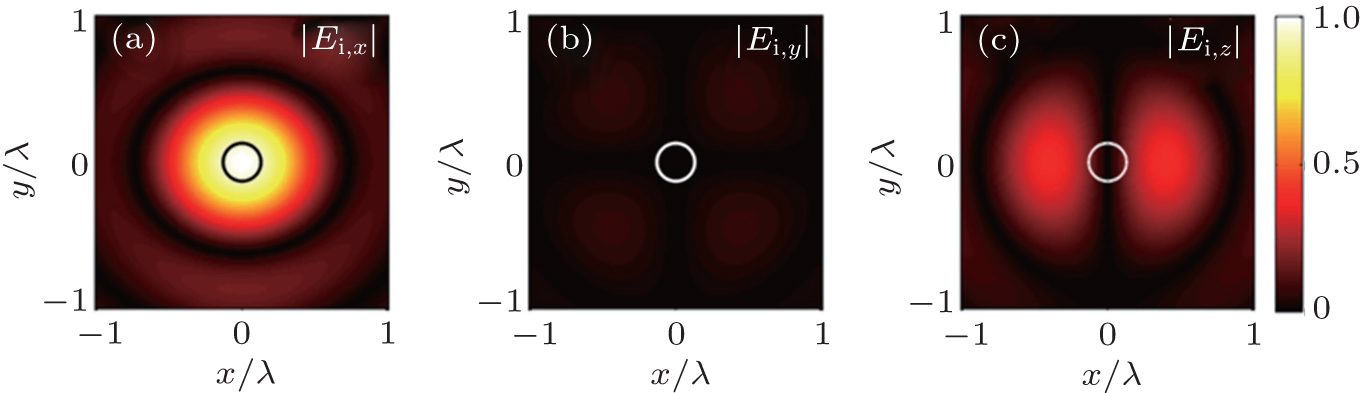
Fig. 2. Intensity distributions (a) Ei,x, (b) Ei,y, (c) Ei,z of field components of the focused field at the focal plane.

Figures 3(a) and 3(b) display the phase distributions of the component Ei,x of PW and focused field in the xz plane, respectively. There is a π -phase change between different orders of the lobes. Comparison of Fig. 3(a) and Fig. 3(b) shows that there is a dramatic difference between those two phase distributions. Figure 3(c) displays the axial phase shift of the focused field, which is known as the Gouy phase shift.[27] In the region where the metal particle is placed, the phase shift is −0.1π from z = −100 nm to z = 100 nm. Because of the coherent nature of SHG, this phase difference will be likely to have an influence on the SH response of metal particles.

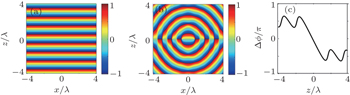
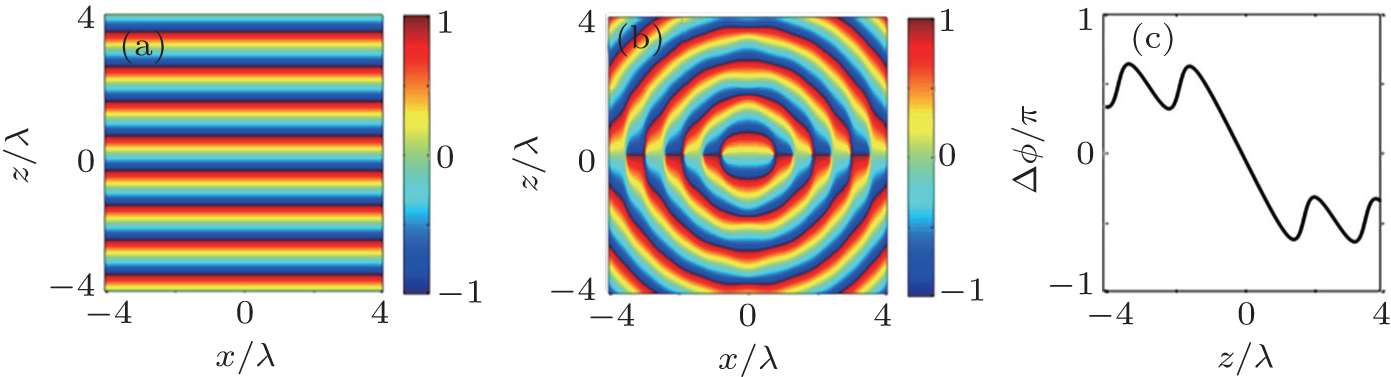
Fig. 3. Phase distributions of the component Ei,x of (a) PW and (b) focused field in the xz plane; (c) axial phase shift of the focused field.

Figures 4(a)4(f) depict the near-field distributions of FF surrounding the gold particle in the xz plane under PW and focused field illuminations, respectively. From the results of Figs. 4(a), 4(b), 4(d), and 4(e), for those two different illuminations, the differences of the distributions of the total field and the components Ex are small. A closer look at the data shows that the average field enhancements in the near field around the gold particle are almost identical, which is in agreement with the conclusions of Ref. [28]. In addition, the component Ex is dominant and the field enhancement is maximal along the x direction. However, it should be noted that in the case of focused field excitation, the intensities of the two backward lobes of the component Ez increase (as shown by the comparison of Fig. 4(c) and Fig. 4(f)). The corresponding profiles of the component Ez along the dashed lines in Figs. 4(c) and 4(f) are displayed in Fig. 4(g). This phenomenon is also observed in the case of a metal block excited by focused beams and explained in terms of the distribution of the Poynting vector.[7] Compared to the case of PW illumination, the Poynting vector for the case of a linearly polarized focused beam distributes much more closely to the axial axis and the energy tends more easily to be reflected by the gold particle at the focus, which results in the reinforcement of the backward scattering. According to Eq. (5), there is the tensorial nature of SHG. Therefore, even though the component Ez is not strong as the component Ex, the difference of the component Ez between the two different illumination conditions still has a chance to affect the SH response of the gold particle. The component Ey in the xz plane is very weak and then the corresponding distribution is not given.

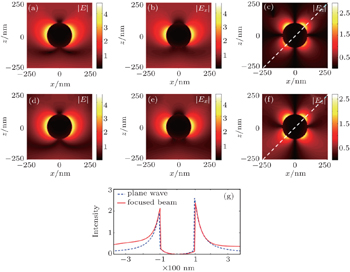
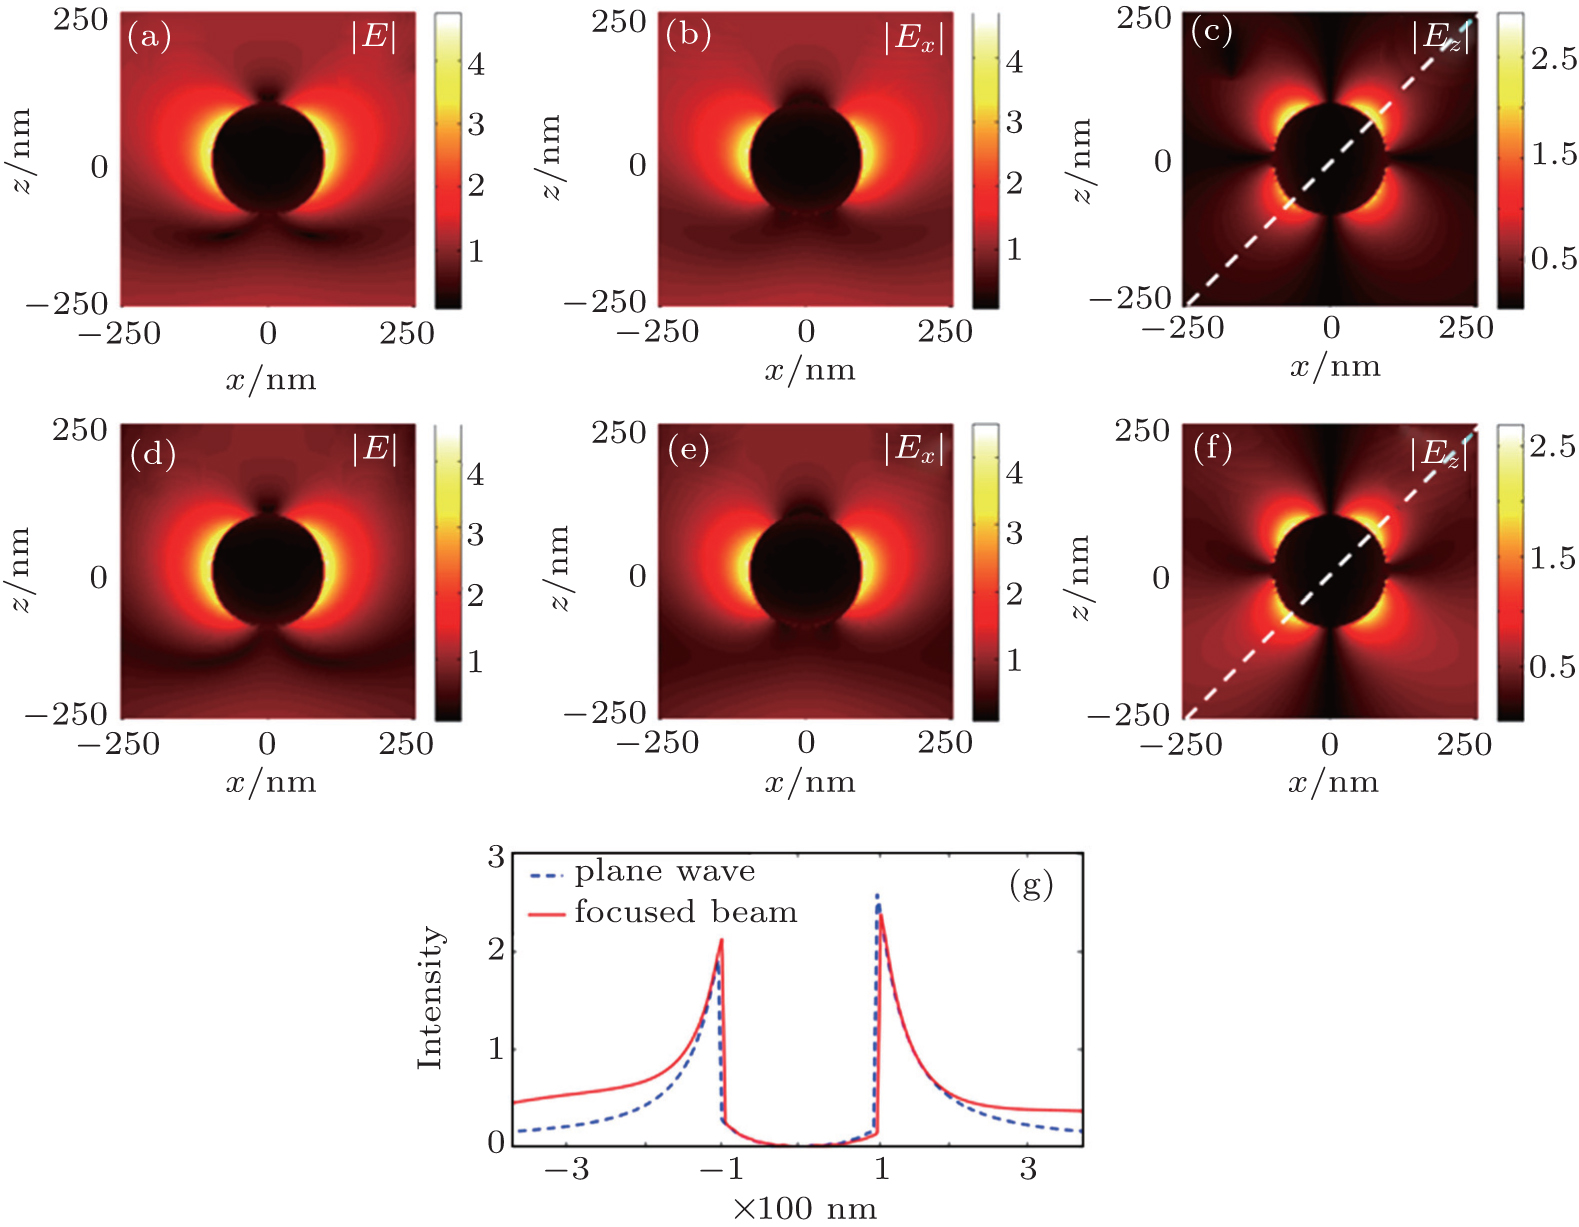
Fig. 4. Near-field distributions of FF under (a)–(c) PW and (d)–(f) tightly focused illuminations, respectively; (g) the corresponding profiles of Ez along the dashed lines in Figs. 4(c) and 4(f).

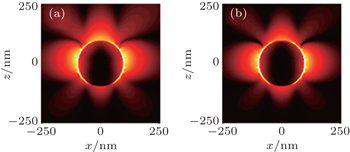
The near-field distributions of the SH field of the gold particle under PW and tightly focused illuminations are illustrated by Figs. 5(a) and 5(b), respectively. The intensities are shown in a logarithmic scale. From the results of Fig. 5, it can be found that a quadrupole mode can be observed and near-field distribution of SH field is more confinement.

Fig. 5. Near-field distributions of SH field of gold particle illuminated by (a) PW and (b) focused field.

Figure 6 shows the far-field angular distributions of SHG generated by the gold particle illuminated by a PW and tightly focused beam, respectively. At Φ = 0°, the SH radiation as a function of Θ is given by Fig. 6(c). The black curve represents the SH radiation under PW illumination, while the blue and red curves represent the SH radiations under tightly focused illumination without and with Ei,z = 0. The intensities are normalized relatively to their own maximum. According to Figs. 6(a) and 6(b), for the two different illumination conditions, the SH response vanishes in the exactly forward and backward directions, which can be explained by the selection rule as the consequence of the rotational symmetry of the particle shape around the longitudinal direction.[29] In addition, the main features of those distributions are similar, due to the fact that the role of the component Ex of the excitation field is dominant (as shown by Fig. 4). However, from the results of Fig. 6(c), it can be found that off-axis backward-propagating SH response can be reinforced by tightly focusing, which could be attributed to the increase of the relative magnitude of the longitudinal field component Ei,z (as shown by Fig. 2). Simulations under different NA (data not shown) indicate that if the value of NA is smaller than 0.5, the difference of the far-field SH radiations between the two different illuminations becomes negligible. When the value of NA exceeds 0.5, the backward SH response will be strengthened as the value of NA increases. In addition, it should be also pointed that even if the role of Ei,z is completely ignored (as denoted by the red curve in Fig. 6(c)), the backward SH response is still enhanced, compared to the case of PW illumination. According to Fig. 3, there is the phase shift of the component Ei,x. Because of the coherent feature of SHG, the far-field radiation is very sensitive to the phase variation of the incident field, which induces the above phenomenon. Actually, for smaller particles whose size is merely about dozens of nanometers, the effect of the component Ei,z cannot be taken into account, while the role of the phase shift still exists. For simplicity, those data are not given in this paper.

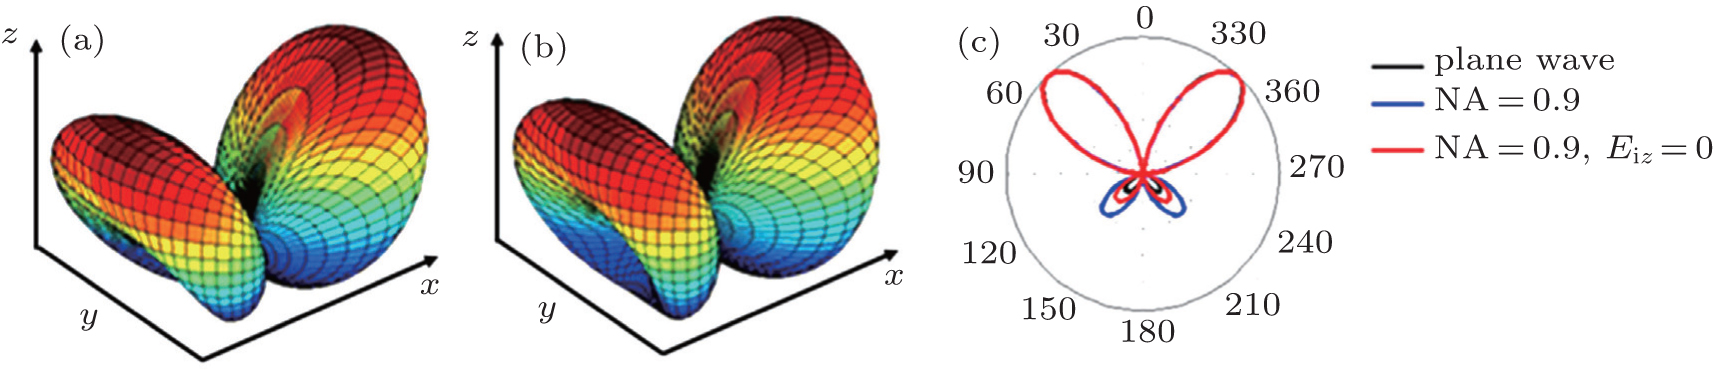
Fig. 6. Far-field radiation patterns of SHG under (a) PW and (b) focused field illuminations; (c) SH radiation diagrams as a function of Θ at Φ = 0°.
4. Conclusion

By using the method based on three-dimensional FDTD algorithm, we have investigated the near-field and far-field SH response from the interaction of a tightly focused beam with metal particles. Compared to the case of PW illumination, the off-axis backward-propagating SH radiation can be reinforced by tightly focusing, which could be attributed to the roles of an increase of the relative magnitude of the longitudinal field component and the phase shift along the propagation direction.

Reference
1Omidi MAmoabediny GYazdian FHabibi-Rezaei M 2015 Chin. Phys. Lett. 32 18701
2Wei X XCheng YHuo DZhang Y HWang J ZHu YShi Y 2014 Acta Phys. Sin. 63 217802 (in Chinese)
3Palomba SNovotny L 2009 Nano Lett. 9 3801
4Godefroy CAdjouadi M 2000 Part. Part. Syst. Charact. 17 47
5Huang XQian WEl-Sayed I HEl-Sayed M A 2007 Lasers Surg. Med. 39 747
6Lermé JBonnet CBroyer MCottancin EMarhaba SPellarin M 2008 Phys. Rev. B 77 245406
7Kitamura KSakai KNoda S 2011 Opt. Express 19 13750
8Mojarad N MSandoghdar VAgio M 2008 J. Opt. Soc. Am. B 25 651
9Sancho-Parramon J 2011 Opt. Lett. 36 3527
10Kauranen MZayats A V 2012 Nat. Photonics 6 737
11Kim SJin JKim Y JPark I YKim YKim S W 2008 Nature 453 757
12Boyd R W2003Nonlinear Optics(Academic press) p. 22
13Nili-Ahmadabadi HKhorsandi A R 2011 Chin. Phys. B 20 054205
14Butet JThyagarajan KMartin O J F 2013 Nano Lett. 13 1787
15Huo B ZWang X HChang S JZeng MZhao G H 2011 J. Opt. Soc. Am. B 28 2702
16Huo B ZWang X HChang S JZeng M 2012 J. Opt. Soc. Am. B 29 1631
17Martorell JVilaseca RCorbalán R 1997 Phys. Rev. A 55 4520
18Challener W ASendur I KPeng C 2003 Opt. Express 11 3160
19Shen HNguyen NGachet DMaillard VToury TBrasselet S 2013 Opt. Express 21 12318
20Richards BWolf E 1959 Proc. R. Soc. A 253 358
21Dadap J IShan JHeinz T F 2004 J. Opt. Soc. Am. B 21 1328
22Guyot-Sionnest PChen WShen Y R 1986 Phys. Rev. B 33 8254
23Bachelier GButet JRussier-Antoine IJonin CBenichou EBrevet P F 2010 Phys. Rev. B 82 235403
24Taflove AHagness S C2000Computational Electrodynamics: The Finite-Difference Time-Domain Method(Artech House Publishers)
25Cheng J XXie X S 2002 J. Opt. Soc. Am. B 19 1604
26Johnson P BChristy R W 1972 Phys. Rev. B 6 4370
27Cheng J XXie X S 2004 J. Phys. Chem. B 108 827
28Foreman M RSivan YMaier S ATörök P 2012 Phys. Rev. B 86 155441
29Finazzi MBiagioni PCelebrano MDuò L 2007 Phys. Rev. B 76 125414