Review of magnetic properties and magnetocaloric effect in the intermetallic compounds of rare earth with low boiling point metals
Li Ling-Wei1, 2, †,
Key Laboratory of Electromagnetic Processing of Materials (Ministry of Education), Northeastern University, Shenyang 110819, China
Institute of Materials Physics and Chemistry, Colleague of Materials Science and Engineering, Northeastern University, Shenyang 110819, China


† Corresponding author. E-mail: lingwei@epm.neu.edu.cn

Project supported by the National Natural Science Foundation of China (Grant Nos. 11374081 and 11004044), the Fundamental Research Funds for the Central Universities, China (Grant Nos. N150905001, L1509006, and N140901001), the Japan Society for the Promotion of Science Postdoctoral Fellowships for Foreign Researchers (Grant No. P10060), and the Alexander von Humboldt (AvH) Foundation (Research stipend to L. Li).

Abstract
Abstract

The magnetocaloric effect (MCE) in many rare earth (RE) based intermetallic compounds has been extensively investigated during the last two decades, not only due to their potential applications for magnetic refrigeration but also for better understanding of the fundamental problems of the materials. This paper reviews our recent progress on studying the magnetic properties and MCE in some binary or ternary intermetallic compounds of RE with low boiling point metal(s) (Zn, Mg, and Cd). Some of them exhibit promising MCE properties, which make them attractive for low temperature magnetic refrigeration. Characteristics of the magnetic transition, origin of large MCE, as well as the potential application of these compounds are thoroughly discussed. Additionally, a brief review of the magnetic and magnetocaloric properties in the quaternary rare earth nickel boroncarbides RENi2B2C superconductors is also presented.

1. Introduction of magnetocaloric effect and materials

The magnetocaloric effect (MCE) is a magneto-thermodynamic phenomenon, which was first discovered in pure Fe by Emil Warburg in 1881,[1] and its origin was independently explained by Debye and Giauque in the 1920s.[2,3] All magnetic materials exhibit MCE, although the intensity of this effect depends on the properties of each material. Generally, for a simple ferromagnetic material near its Curie temperature, when a magnetic field is applied, the spins tend to align parallel to the magnetic field, which lowers the magnetic entropy. To compensate for the loss in the magnetic entropy in an adiabatic (isentropic) process, the temperature of the material increases. When the magnetic field is removed, the spins tend to become random which increases the magnetic entropy and the material cools. Meanwhile, Debye and Giauque have also proposed the adiabatic demagnetization in order to achieve temperature lower than that of the liquid helium. This possibility was later experimentally demonstrated by the chemist Nobel Laureate William F. Giauque in 1933, he was able to reach a temperature of 0.25 K based on the adiabatic demagnetization of 61 g paramagnetic salt Gd2(SO4)3· 8H2O.[4] Besides the success in the ultralow temperature, the magnetic refrigeration technology has also been applied at the higher temperature ranges, such as ∼ 2 K to 20 K, the range of liquid helium and hydrogen, as well as ∼ 20 K to 80 K, the range of liquid hydrogen and nitrogen.[58]

In 1997, two key developments enhanced the feasibility for producing a magnetic refrigerator for commercial or industrial use. The first is that Zimm et al.[9] realized the first near room temperature magnetic refrigeration prototype at the Ames Laboratory. The second is that Pecharsky and Gschneider[10] observed a giant MCE in the Gd5(Si2Ge2) compound. Besides the discovery of the giant MCE in Gd5(Si2Ge2) and related compounds,[10,11] a number of materials with giant/large MCE have been realized in the last three decades, for example, RECo2 (RE = Er, Ho, and Dy) alloys,[12,13] MnAs based compounds,[1417] manganites (RE, M)MnO3, (RE = lanthanide, M = Ca, Sr, and Ba),[18,19] Ni–Mn–X (X = Ga, In, and Sn) based Heusler alloys,[2024] La(Fe,Si)13 and related compounds,[2528] MnTX (T = Co, Ni, and Fe; X = Si, Ge) based compounds,[2932] as well as some rare earth based intermetallic compounds.[3336] The structure, physical properties, as well as the MCE and its application in most of the above mentioned materials have been summarized in a number of review articles,[1114,1719,22,23,26,27,3235,3740] which will not be repeated here. In this paper, we give a brief review of our recent progress in exploring magnetocaloric materials, mainly related to several typical systems of RE-based intermetallic compounds.

2. Characterization of magnetocaloric materials
2.1. Evaluation of magnetic entropy change and adiabatic temperature change

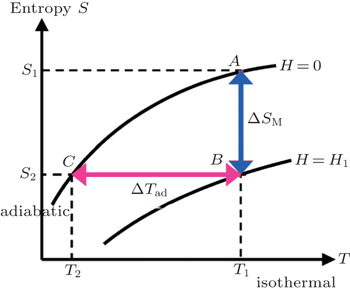
The MCE is an intrinsic phenomenon for a magnetic material, which manifests as the isothermal magnetic entropy change ΔSM or/and the adiabatic temperature change ΔTad when it is exposed to a varying magnetic field, the definition of ΔSM and ΔTad can be found in Fig. 1. The MCE can be measured directly or it can be calculated indirectly from the experimentally measured heat capacity and/or magnetization. In the present review, the reported values of ΔSM and ΔTad were estimated by two different methods using the indirect technology: (i) from field and temperature dependence of heat capacity C(H,T), (ii) from field and temperature dependence of magnetization M(H,T) and zero field heat capacity C(T, 0 T), which are described as follows.

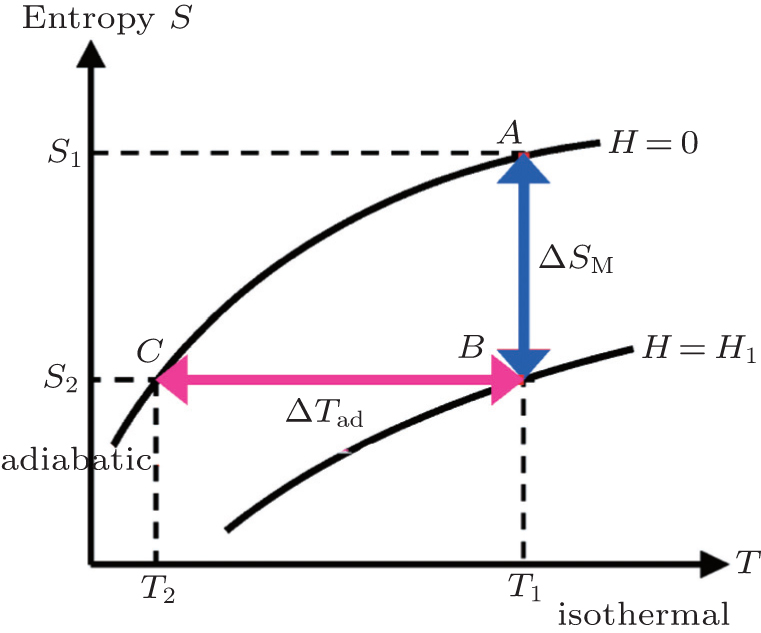
Fig. 1. The total entropy S as a function of magnetic field H and temperature T, schematically illustrating the definition of the isothermal magnetic entropy change ΔSM and the adiabatic temperature change ΔTad.

The temperature dependence of total entropy S under different fields can be calculated from the heat capacity by numerical integration

where H is the magnetic field at which the heat capacity is measured. Then the ΔSM as well as the adiabatic temperature change ΔTad can be calculated from the heat capacity measurements using the following relations:

According to the thermodynamical theory, the isothermal magnetic entropy change associated with a magnetic field variation is given by

From Maxwell’s thermodynamic relation

one can obtain the following expression:

where S, M, H, and T are the magnetic entropy, the magnetization of the material, the applied magnetic field, and the temperature of the system, respectively. From the magnetization measurements made at discrete field and temperature intervals, ΔSM can be approximately calculated by the following expression:

From zero field C(T), we can calculate S (T, 0 T) by using Eq. (1). With the magnetic entropy change ΔSM calculated from M(H,T), the S(T,H) can be calculated from the following expression:

Then the adiabatic temperature change ΔTad can be calculated using Eq. (3). By using the present method, the accuracy of the ΔSM calculated from the magnetization data for the materials studied here is better than 10%.

2.2. Evaluation of relative cooling power and refrigerant capacity

Another important quality factor(s) for magnetocaloric materials is the relative cooling power (RCP) or/and refrigerant capacity (RC), which is a measurement of the amount of heat transfer between the cold and hot reservoirs in an ideal refrigeration cycle. The RCP is defined as the product of the maximum magnetic entropy change and the full width at half maximum δTFWHM in the ΔSM(T) curve,

Whereas, the RC is calculated by numerically integrating the area under the −ΔSMT curve taking the half maximum of the peak as the integration limits

where T1 and T2 are the temperatures of the cold end and the hot end of an ideal thermodynamic cycle, respectively.

An example for the evaluation of the RCP and RC is displayed in Fig. 2. It is easy to find that the value of RC is around 25 % lower than that of the RCP for the ΔSM(T) that has a single broad triangle peak around TC, which is a typical character for the second order MCE materials.

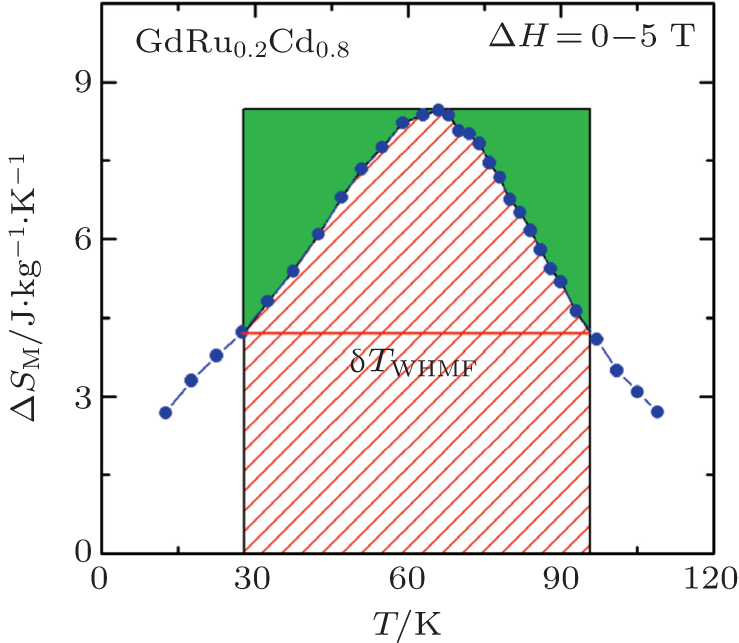
Fig. 2. Definitions of relative cooling power (RCP) and refrigerant capacity (RC) for GdRu0.2Cd0.8. The rectangular area is RCP and the area full with parallel lines is RC.
2.3. Determination of the order of magnetic phase transition

It is well known that the magnitude, temperature, and magnetic field change dependence of MCE have strong correlations with the nature of the corresponding magnetic phase transition; therefore, it is important to determine the order of magnetic transition of the magnetocaloric materials. The Inoue–Shimizu model,[41,42] which involves a Landau expansion of the magnetic free energy up to the sixth power of the total magnetization M, can be used to determine the magnetic transition type,[41,42]

After mimimization of the above equation with respect to the magnetization M, the magnetization near the Curie temperature TC satisfies

The parameters c1(T), c2(T), and c3(T) represent the Laudau coefficients, and it has been reported that the order of a magnetic transition is related to the sign of c2(T). A transition is expected to be the first order when c2(∼ TC) is negative, whereas it will be the second order for a positive c2(∼ TC). The sign of c2 can be determined by the Arrott plot (H/M versus M2 curves),[43] i.e., the magnetic transition is of the second order if all the H/M versus M2 curves have positive slopes. On the other hand, if the H/M versus M2 curves show negative slopes, the magnetic transition is of the first order. In the present review, the order of magnetic phase transition of all the materials was determined by this method.

3. MCE in rare earth based intermetallic compounds containing low boiling point metal(s)

The rare earth (RE) and transition metal (T) based systems have been intensively investigated in recent years with respect to their interesting chemical and physical properties as well as practical applications in a wide spectrum of industries. Depending on the constituent element and composition, various properties like magnetic ordering, superconductivity, heavy-fermion behavior, valence fluctuation, large magneto-resistance (MR) effect, and large/giant MCE have been observed.[4448] Compared to the other transition metals, Zn, Mg, and Cd-based intermetallic compounds are less researched. This might be a consequence of the difficulty in material synthesis due to the low boiling point (high vapour pressure) of Zn, Mg, and Cd. Pöttgen et al.[49,50] have proposed a simple method to prepare such materials. First, stoichiometric amounts (0.5%–1% of the low boiling point metals were added) of the consistent elementals with purity better than 99.9% were weighted. Second, the weighted metals were arc-welded[49] in a Ta or Nb tube under an argon pressure of ca. 75–85 kPa. The argon was purified over a titanium sponge (900 K), silica gel, and molecular sieves. Third, the crucible was placed in a water-cooled sample chamber of an induction furnace (Hüttinger Elektronik, Freiburg, Germany, Typ TIG 1.5/300)[50] and heated up to a certain high temperature for several minutes, followed by several hours annealing at a selected temperature. Then the obtained samples were ground and cold-pressed into pellets, and finally annealed at a certain temperature for several days in evacuated quartz tubes. The structural properties and phase purity were subsequently characterized by x-ray powder diffraction (XRD) and energy dispersive x-ray spectroscopy (EDX) analyses. In the following sections, our recent progress related to the magnetism and MCE in the binary or ternary intermetallic compounds of RE with low boiling point metal(s) (Zn, Mg, and Cd) is reviewed, respectively. For a quick comparison, the magnetic transition temperatures together with the MCE parameters of the compounds in the present review as well as some other rare earth based intermetallic compounds with significant MCE properties are summarized in Table 1.

Table 1.

The transition temperature (TM), the maximum magnetic entropy change , the maximum adiabatic temperature change , and the relative cooling power (RCP) under the field changes of 0–2 T and 0–5 T for the intermetallic compounds of rare earth with low boiling point metal(s) (Zn, Mg, and Cd) as well as some giant/large MCE materials with similar TM. The column with a mark “−” means that the value was not reported in the literature.

.
3.1. Zn-based intermetallic compounds

The equiatomic binary compounds REZn with the cubic CsCl-type structure (space group Pm3m) have attracted some attention due to their simple crystal structure as well as their interesting physical and chemical properties.[5154] The magnetic studies revealed that the heavy REZn compounds order ferromagnetically with the ordering temperature ranging from 267 K for GdZn to 8.5 K for TmZn, whereas the light ones order antiferromagnetically.[5154] Sousa et al.[55,56] have theoretically investigated the MCE in REZn (RE = Tb, Ho, and Er), and some anomalies in ΔSM(T) curves were found due to spontaneous and/or spin reorientation transitions in these compounds. Very recently, we have experimentally investigated the magnetic phase transition and magnetocaloric properties of REZn (RE = Tm and Ho) compounds.[57,58]
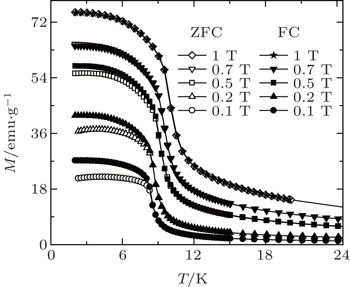
Figure 3 shows the temperature dependence of the zero field cooling (ZFC) and field cooling (FC) magnetizations (M) for TmZn under various magnetic fields (H) from 0.1 T to 1 T. Both ZFC and FC M(T) curves show a typical PM to FM transition. With increasing magnetic field, TC increases gradually from 8.4 K for H = 0.1 T to 10.3 K for H = 1 T. To evaluate the MCE in TmZn, a set of M(H) curves with increasing and decreasing magnetic field up to 7 T together with the temperature dependence of the heat capacity C for the magnetic field changes of 0–2 T and 0–5 T were measured. No obvious hysteresis can be observed for the whole temperature range. Several isotherms with increasing field are presented in Fig. 4 and the corresponding Arrott plot (H/M versus M2 curves) is shown in Fig. 5. At the low temperature, the M(H) curve shows the typical behavior of a soft ferromagnet. With the temperature increasing to above 8 K, a field induced metamagnetic transition can be observed in the M(H) curves in a wide temperature range, resulting in a clear S-shape in the Arrott plots, which is a typical characterization of the first-order magnetic phase transition.[43] Additionally, the observed magnetic properties in TmZn are quite similar to those in one of the most important class of MCE materials, RECo2 (RE = Dy, Ho, and Er), which were highlighted due to the occurrence of IEM as well as its close relationship with giant MCE.[12,13]

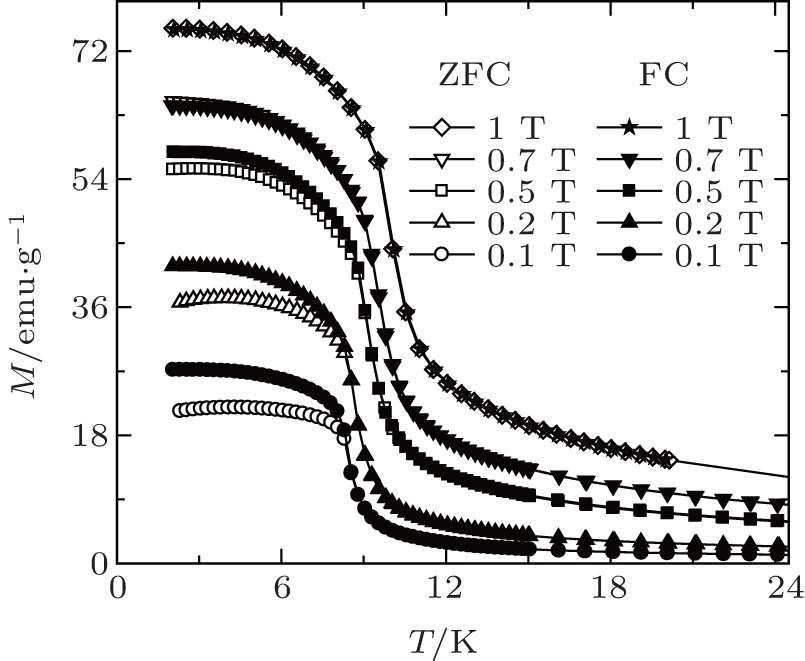
Fig. 3. Temperature dependence of the zero field cooling (ZFC) and field cooling (FC) magnetization (M) for TmZn under various magnetic fields (H) up to 1 T.[57]
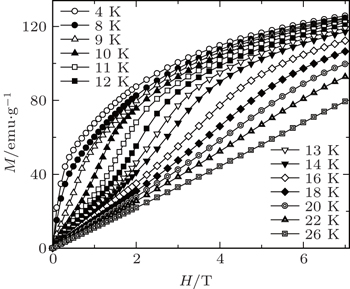
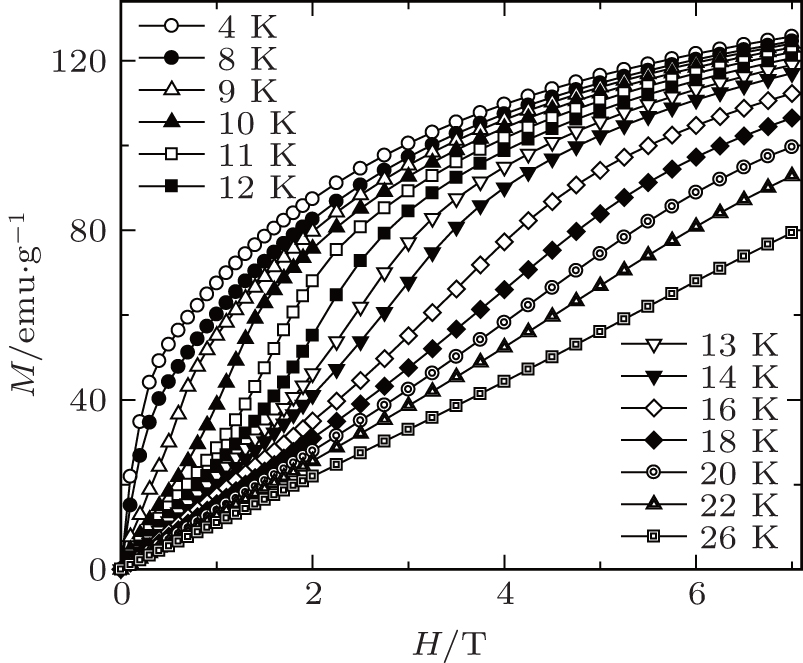
Fig. 4. Magnetic field dependence of the magnetization (increasing field only) for TmZn at some selected temperatures.[57]
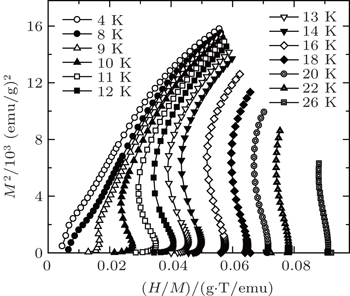
Fig. 5. The plots of H/M versus M2 for TmZn at some selected temperatures.[57]

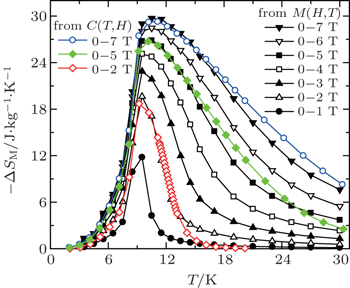
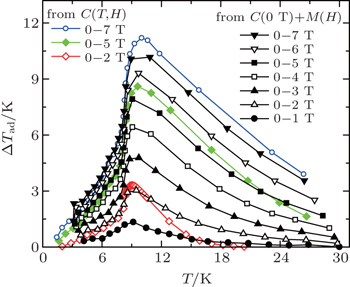
The temperature dependences of −ΔSM and ΔTad for TmZn are shown in Figs. 6 and 7, which were calculated from the M(H, T) and C(T, H) data, respectively. Both ΔSM and ΔTad obtained by using the two methods described in Section 2 are in good agreement with each other. The values of are 26.9 J/kg·K and 29.7 J/kg·K for the magnetic field changes of 0–5 T and 0–7 T, respectively, and the corresponding values of are 8.6 K and 11.2 K, indicating that the binary equiatomic compound TmZn belongs to a class of giant magnetocaloric materials. Moreover, for the relatively small field changes of 0–1 T and 0–2 T, the values of reach 11.8 J/kg·K and 19.6 J/kg·K, which is beneficial for applications. The observed giant MCE in TmZn is related to the first order, field-induced metamagnetic phase transition. The field sensitive magnetic transition, sharp changes of magnetization around TC, and large values of magnetization of TmZn are considered to be the origin of the giant MCE. For the magnetic field changes of 0–2 T, 0–5 T, 0–7 T, the values of RCP and RC are determined to be 76 J/kg, 269 J/kg, 422 J/kg and 59 J/kg, 214 J/kg, 335 J/kg, respectively. The corresponding values of are estimated to be 3.3 K, 8.6 K, and 11.2 K.[57] These MCE parameters of TmZn (see Table 1), especially for the magnetic field change of 0–2 T, are comparable to or obviously larger than those of most potential promising magnetic refrigerant materials in the similar temperature region, thus TmZn is attractive for low temperature active magnetic refrigeration.[57]

Fig. 6. Temperature dependence of magnetic entropy change −ΔSM for TmZn with the magnetic field changes up to 0–7 T.[57]
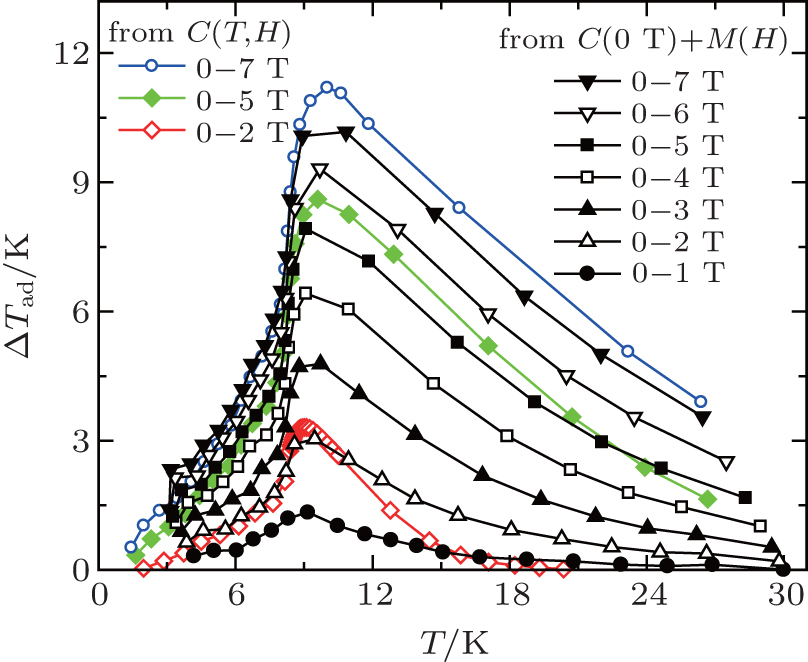
Fig. 7. Temperature dependence of adiabatic temperature change ΔTad for TmZn with the magnetic field changes up to 0–7 T.[57]

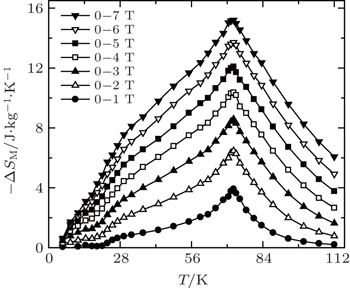
Whereas, two successive magnetic transitions are observed around TC ∼ 72 K and TSR ∼ 26 K for HoZn, which are the paramagnetic to ferromagnetic and the spin reorientation transitions, respectively.[58] Magnetization and modified Arrott plots indicate that HoZn undergoes a second-order magnetic phase transition around TC. The critical behavior around TC has been investigated by modified Arrott plots, scaling analysis, scaling plots, and field change dependence on the magnetic entropy change method. The critical exponents β, γ, and δ of HoZn are determined to be 0.47 ± 0.02, 1.09 ± 0.03, and 3.32 ± 0.04, respectively, which have some small deviations from the mean-field theory, indicating a short range or a local magnetic interaction which is properly related to the coexistence of FM and SR transitions at low temperature.[58]

The magnetic entropy change ΔSM for HoZn was calculated from the M(H, T) data (as shown in Fig. 8). One large peak together with a shoulder can be observed in the −ΔSM(T) curves around the FM and SR transition temperatures, respectively. Two peaks (shoulder) overlap with each other, resulting in a wide temperature range with a large RCP, which is beneficial for active applications. The maximum magnetic entropy changes of HoZn for the magnetic field changes of 0–2 T, 0–5 T, and 0–7 T are 6.5 J/kg·K, 12.1 J/kg·K, and 15.2 J/kg·K, respectively. The corresponding values of RCP are evaluated to be as large as 255 J/kg, 792 J/kg, and 1124 J/kg.[58] These values are obviously larger than those recently reported for potential magnetic refrigerant materials with similar working temperature under the same field changes (see Table 1). The large values of and RC indicate that HoZn could be a promising candidate for active magnetic refrigeration in the temperature range of 30–90 K.[58]

Fig. 8. Magnetic entropy change −ΔSM as a function of temperature for various magnetic field changes up to 0–7 T for HoZn.[58]

Hermes et al.[59] have studied the magnetic properties and MCE in EuRh1.2Zn0.8, which crystallizes with the MgCu2 structure and orders ferromagnetically at TC ∼ 95 K. For the magnetic changes of 0–2 T and 0–5 T, the values of , , and RCP are evaluated to be 3.1 J/kg·K and 5.7 J/kg·K, 1.4 K and 2.8 K, and 233 J/kg and 513 J/kg, respectively. A large reversible MCE was reported in EuAuZn around 52 K accompanied by a second order magnetic phase transition from a PM state to an FM state.[60] The values of in EuAuZn reach 4.8 J/kg·K, 9.1 J/kg·K, and 11.3 J/kg·K for the magnetic field changes of 0–2 T, 0–5 T, and 0–7 T, respectively, and show no thermal and magnetic hysteresis around TC. The corresponding values of are evaluated to be 2.1 K, 3.8 K, and 4.7 K. Very recently, Zhang et al.[61] have reported the magnetic and magnetocaloric properties in the equiatomic intermetallic compounds of TmZnAl. They found that the TmZnAl compound undergoes a second order magnetic transition from PM to FM state around 2.8 K. A reversible MCE with considerable magnitude was observed at low temperature. For the magnetic field changes of 0–2 T, 0–5 T, and 0–7 T, the maximum values of −ΔSM are 4.3 J/kg·K, 9.4 J/kg·K, and 11.8 J/kg·K and the corresponding values of RCP (RC) are determined to be 53 (41) J/kg, 189 (149) J/kg, and 289 (228) J/kg, respectively.

3.2. Mg-based intermetallic compounds

The ternary RE-rich intermetallic compounds of the general composition RE4TMg (T = Rh, Pd, and Pt), crystallizing in the cubic Gd4RhIn-type structure, have attracted some attention due to their interesting physical and chemical properties.[6265] For this type of crystal structure, there are three crystallographically independent RE sites and the rare structural motif of Mg4 tetrahedra. The transition metal atoms are located in RE6 trigonal prisms with strong covalent RET bonding. These RE6T basic building units are condensed via common corners and edges to a three-dimensional network in which the cavities are filled by the Mg4 tetrahedra. Recently, we have reported the magnetic properties and MCE of RE4PdMg (RE = Eu and Er) and RE4PtMg (RE = Ho and Er).[6668] The magnetic phase transition, the origin of the MCE, and its potential application for magnetic refrigeration of these compounds will be shown below.
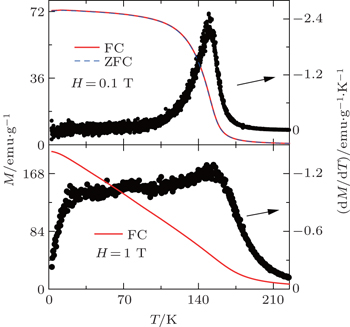
Figure 9(a) shows the temperature dependent ZFC and FC magnetization M (left scale) and dMFC/dT (right scale) under H = 0.1 T for Eu4PdMg. No difference is observed between the ZFC and FC MT curves around TC, which is usual in magnetic materials with a second order magnetic transition. Only one peak in dM/dT vs. T is observed around 150 K, which is corresponding to the PM to FM magnetic transition. Figure 9(b) shows the FC magnetization M (left scale) and dMFC/dT (right scale) for Eu4PdMg under H = 1 T. We note that M increases continuously with decreasing temperature, and dM/dT shows a table-like behavior from 20 K to 150 K.[66] Figure 10 shows the M(T) curves for Eu4PdMg under various magnetic fields up to 7 T. The magnetic transition is very sensitive to the magnetic field, a sharp PM to FM transition can be observed under a low magnetic field, and the transition gradually becomes broader with increasing magnetic field. The magnetization almost shows a linear temperature dependence under higher magnetic fields. This exotic magnetic transition behavior may be related to its special crystal structure and abundant rare earth site occupation.[66]

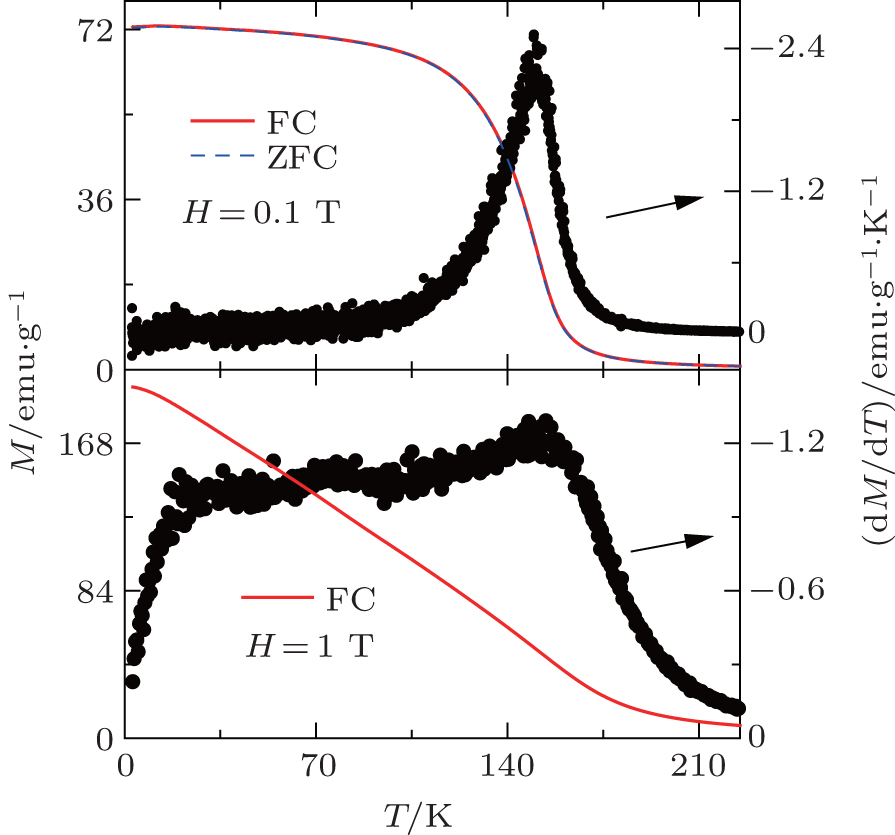
Fig. 9. (a) Temperature dependence of zero field cooling (ZFC) and field cooling (FC) magnetization M (left scale) as well as dMFC/dT (right scale) for Eu4PdMg in an external magnetic field H = 0.1 T. (b) Temperature dependence of FC magnetization M (left scale) and dMFC/dT (right scale) for Eu4PdMg under H = 1 T.[66]
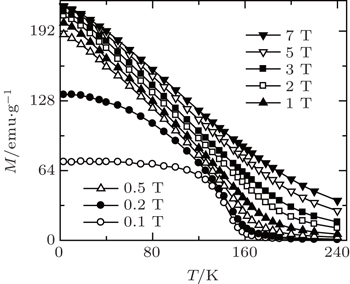
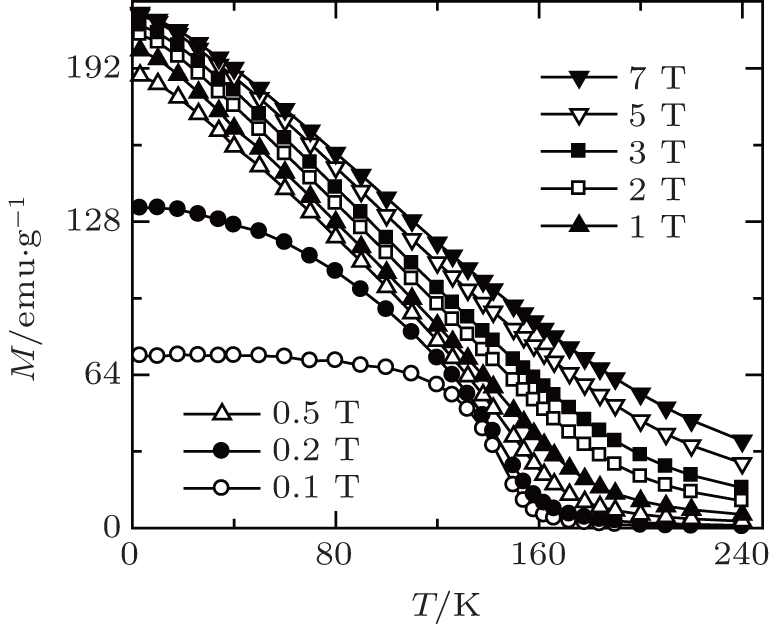
Fig. 10. Temperature dependence of the magnetization for Eu4PdMg under various magnetic fields up to 7 T.[66]

A set of magnetic isotherms were measured for Eu4PdMg in the temperature range from 3 K to 220 K to evaluate its magnetic entropy change. No obvious hysteresis can be observed in this temperature range. Additionally, the order of magnetic phase transition in Eu4PdMg is confirmed to be the second order based on the Banerjee criterion. The resulted −ΔSM(T) curves with the magnetic field changes up to 0–7 T are shown in Fig. 11. The −ΔSM(T) curves show a pronounced peak around TC for a samll magnetic field change, which is similar to the typical behavior of magnetocaloric materials with a single magnetic phase transition.[66] A very broad table-like behavior can be observed for a high magnetic field change, which is beneficial for application. These peculiar MCE properties in Eu4PdMg are probably related to the magnetic field sensitive magnetic phase transition and the large saturated magnetic moment which is corresponding to its exotic magnetic and/or crystal structure.[66] With the magnetic field changes of 0–2 T, 0–05 T, and 0–7 T, the values of are 2.6 J/kg·K, 5.5 J/kg·K, and 7.2 J/kg·K, respectively. The corresponding values of RCP (RC) are determined to be 53 (41) J/kg, 189 (149) J/kg, and 289 (228) J/kg. As a matter of fact, the values of are smaller than those of recently reported giant MCE materials in the low temperature region, which is related to the additional internal entropy loss due to the larger lattice heat capacity of the material with the higher TC. The value of Eu4PdMg is comparable with that of some potential magnetic refrigerant materials in the similar temperature region under the same field change (see Table 1). The RC and RCP values are obviously larger than those of some potential magnetic refrigerant materials in the similar temperature region. The excellent MCE properties indicate that Eu4PdMg is a promising candidate for active magnetic refrigeration in the 20 K to 160 K temperature range. The present results may also provide an important clue for searching suitable refrigerant materials in the category of materials with field sensitive magnetic phase transition(s).[66]

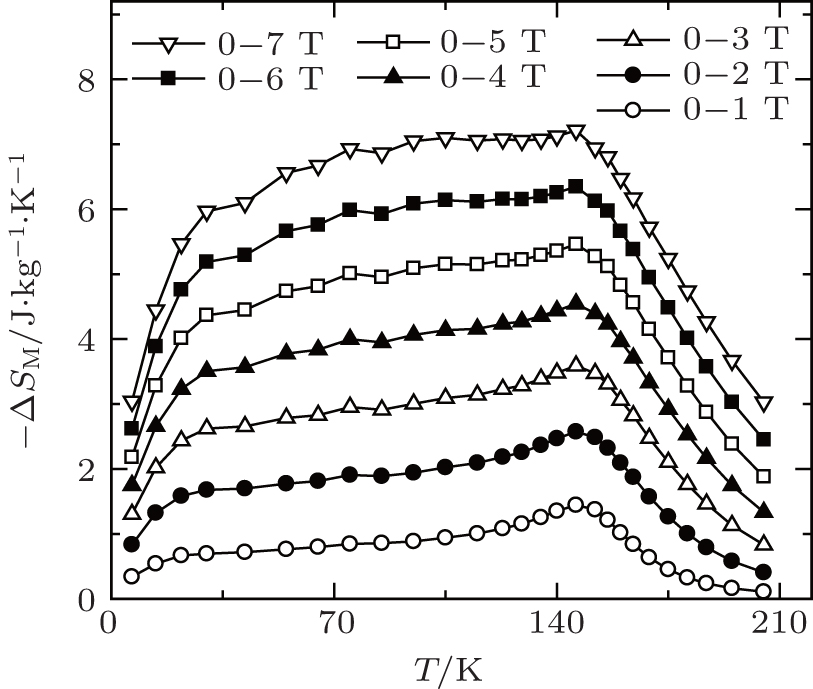
Fig. 11. Temperature dependence of magnetic entropy change −ΔSM for Eu4PdMg with the magnetic field changes up to 0–7 T.[66]

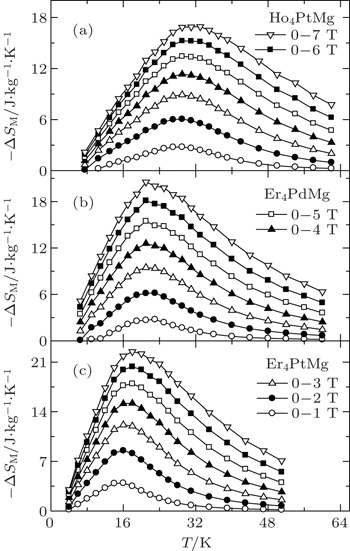
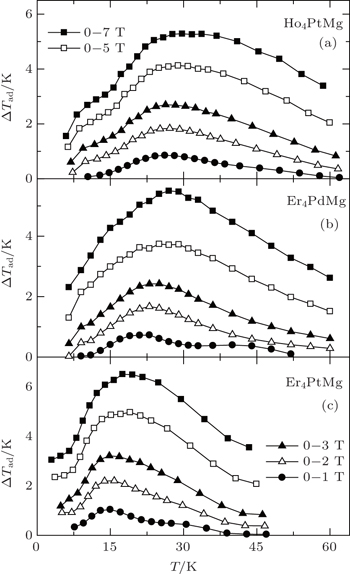
Very recently, the magnetic properties and MCE in Ho4PtMg, Er4PdMg, and Er4PtMg compounds have been investigated by magnetization and heat capacity measurements.[67,68] The compounds Ho4PtMg, Er4PtMg, and Er4PdMg undergo a second order magnetic phase transition from PM to FM at the Curie temperatures of 28 K, 21 K, and 16 K, respectively. The resulting temperature dependence of −ΔSM and ΔTad with various magnetic field changes up to 0–7 T for Ho4PtMg, Er4PdMg, and Er4PtMg are shown in Figs. 12(a)12(c) and 13(a)13(c), respectively. With the magnetic field changes of 0–1 T, 0–2 T, 0–5 T, and 0–7 T, the values of are evaluated to be 2.8 J/kg·K, 6.1 J/kg·K, 13.4 J/kg·K, and 16.9 J/kg·K; 2.8 J/kg·K, 6.2 J/kg·K, 15.5 J/kg·K, and 20.6 J/kg K; and 3.9 J/kg·K, 8.5 J/kg·K, 17.9 J/kg·K, and 22.5 J/kg K for Ho4PtMg, Er4PdMg, and Er4PtMg, respectively, indicating that the presently studied compounds belong to a class of large MCE materials. For the magnetic field changes of 0–2 T, 0–5 T, and 0–7 T, the values of RCP are determined to be 177 J/kg, 527 J/kg, and 762 J/kg; 142 J/kg, 457 J/kg, and 742 J/kg; 152 J/kg, 483 J/kg, and 716 J/kg for Ho4PtMg, Er4PdMg, and Er4PtMg, respectively, and the corresponding values of are evaluated to be 1.8 K, 4.1 K, and 5.3 K; 1.7 K, 3.7 K, and 5.5 K; and 2.2 K, 5.0 K, and 6.5 K, respectively. These values are comparable to or even larger than those of some potential promising magnetic refrigerant materials in the similar temperature region, classifying them as potential candidates for low temperature magnetic refrigeration.[67,68]

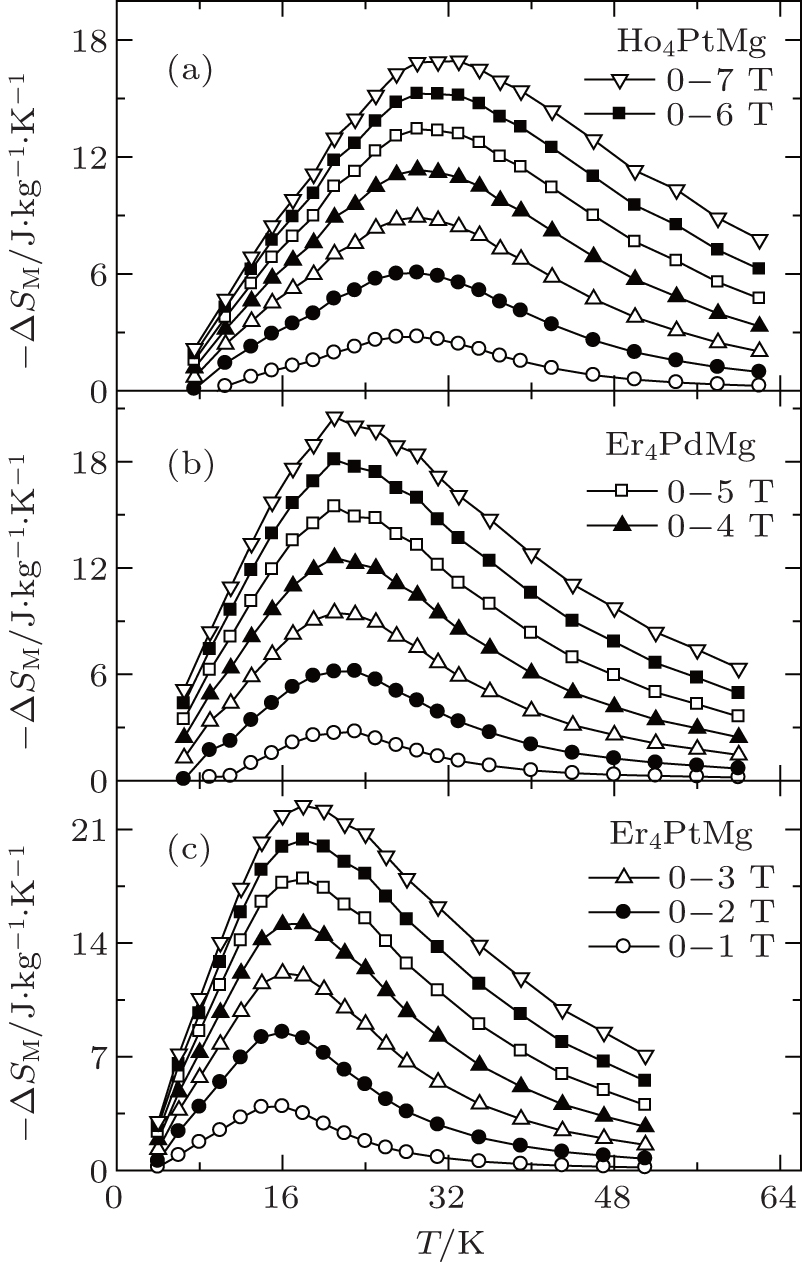
Fig. 12. Temperature dependence of magnetic entropy change −ΔSM with the magnetic field changes up to 0–7 T for (a) Ho4PtMg, (b) Er4PdMg, and (c) Er4PtMg.[67,68]
Fig. 13. Temperature dependence of adiabatic temperature change ΔTad with the magnetic field changes up to 0–7 T for (a) Ho4PtMg, (b) Er4PdMg, and (c) Er4PtMg.[67,68]

Linsinger et al.[69] have studied the magnetism and MCE in the Gd2NixCu2−xMg (x = 1 and 0.5) compounds. Both compounds show a large reversible MCE near their ordering temperatures. The values of reach 9.5 J/kg·K and 11.4 J/kg·K for the field change of 0–5 T with no obvious hysteresis loss around 65 K for x = 0.5 and x = 1, respectively. The corresponding values of RCP reach 688 J/kg and 630 J/kg, which are relatively high compared to those of other MCE materials in that temperature range. These results indicate that Gd2NixCu2−xMg could be a promising system for magnetic refrigeration at temperatures below liquid N2. The values of for Gd2Ni0.5Cu1.5Mg reach 1.6 K and 3.2 K for the magnetic field changes of 0–2 T and 0–5 T, respectively, whereas for Gd2NiCuMg (1.8 K and 4.3 K) is slightly higher. Gorsse et al. have investigated the MCE in the Gd4Co2Mg3 compound.[70] They found that the compound orders antiferromagnetically below TN = 75 K and shows a field-induced transition at approximately 0.93 T at 6 K. The values of reach 5.8 J/kg·K and 10.3 J/kg·K at 77 K for the magnetic field changes of 0–2 T and 0–4.6 T, respectively, which is related to the field-induced magnetic phase transition. The corresponding values of are 1.3(1) K and 3.4(1) K, respectively.

3.3. Cd-based intermetallic compounds

Due to the high toxicity of Cd and its compounds, the Cd-based alloys and compounds have limited technical application, and there is little work on the related topics.[7173] Hermes et al.[72] have investigated the magnetic and MCE properties in the Er4NiCd compound which crystallizes in the Gd4RhIn type structure. They found that Er4NiCd shows a Curie–Weiss behavior above 50 K with TN = 5.9 K. Under a field of 0.4 T, a metamagnetic step is visible, which together with the positive paramagnetic Curie-temperature (7.5 K) indicates a rather unstable antiferromagnetic ground state. The values of reach −7.3 J/kg·K and −18.3 J/kg·K, and the resulted RCP are 237 J/kg and 595 J/kg, for the magnetic field changes of 0–2 T and 0–5 T, respectively, in Er4NiCd. The corresponding values of are 3.1 K and 7.7 K for the magnetic field changes of 0–2 T and 0–5 T, respectively. These results indicate that Er4NiCd could be a promising system for magnetic refrigeration at temperatures below liquid H2.[72]

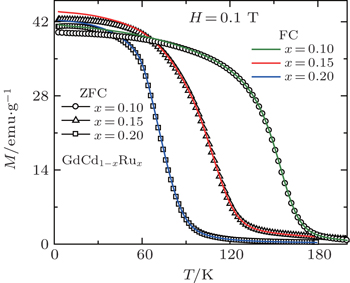
Recently, Li et al.[73] have investigated the magnetism and MCE in GdCd1−xRux (x = 0.1, 0.15, and 0.2) solid solutions. Figure 14 shows the temperature dependence of ZFC and FC magnetization for GdCd1−xRux under a low magnetic field of H = 0.1 T. A typical PM to FM transition can be observed around TC ∼ 149 K, 108 K, and 73 K for x = 0.1, 0.15, and 0.2, respectively. No obvious thermal hysteresis can be observed between ZFC and FC MT curves, which is beneficial for application. To evaluate the MCE in GdCd1−xRux, a set of M(H) curves around TC were measured. The resulted temperature dependences of −ΔSM for x = 0.1, 0.15, and 0.2 are shown in Figs. 15(a)15(c), respectively. The −ΔSM(T) curves show pronounced peaks around TC, and the peak is getting sharper and the peak temperature gradually shifts to lower temperature with increasing x. Interestingly, a table-like behavior in the −ΔSM(T) curve is observed for x = 0.1, which is beneficial for application, especially for a single material. For the magnetic field changes of 0–2 T, 0–5 T, and 0–7 T, the values of are evaluated to be 1.8 J/kg·K, 4.1 J/kg·K, and 5.6 J/kg·K; 2.4 J/kg·K, 5.8 J/kg·K, and 7.8 J/kg K; and 3.8 J/kg·K, 8.5 J/kg·K, and 11.0 J/kg K for x = 0.1, 0.15, and 0.2, respectively.

Fig. 14. Temperature dependence of zero field cooling (ZFC) and field cooling (FC) magnetization M for GdCd1−xRux (x = 0.1, 0.15, and 0.2) under a low magnetic field of H = 0.1 T.[73]
Fig. 15. Temperature dependence of magnetic entropy change −ΔSM with various magnetic field changes for GdCd1−xRux (x = 0.1, 0.15, and 0.2). The inset shows the maximum magnetic entropy change as a function of magnetic field change ΔH2/3.[73]

The as a function of magnetic field change ΔH2/3 for GdCd1−xRux is shown in the inset of Fig. 15(c). Franco et al.[74,75] have previously proposed a universal relation between and ΔH in a magnetic system with second-order phase transition, , where A is a constant. A linear relation between and (ΔH)2/3 can be observed for all the present studied samples under high magnetic field changes, indicating that the critical behavior in GdCd1−xRux is close to the mean field theory. For the magnetic field changes of 0–5 T and 0–7 T, the values of RCP for GdCd1−xRux are determined to be 636 J/kg, 597 J/kg; 583 J/kg, 889 J/kg; and 852 J/kg, 828 J/kg for x = 0.1, 0.15, and 0.2, respectively. Additionally, the GdCd1−xRux solid solution is quite interesting because it can cover a wide temperature range with excellent MCE properties by changing the Ru content, then the materials can be combined to design a composite material used as a magnetic refrigerant. Therefore, the considerable without any thermal/magnetic hysteresis and large RCP values together with the tunable TM indicates that the GdCd1−xRux solid solutions are attractive for active magnetic-refrigeration.[73]

4. Magnetic properties and MCE of RENi2B2C superconductors

The quaternary rare earth nickel boroncarbides RENi2B2C, which crystallize in the tetragonal LuNi2B2C-type structure, have attracted a great deal of attention due to the coexistence of superconductivity and magnetic ordering phenomena.[99103] The compounds are long range magnetic ordered for RE = Gd, Tb, Dy, Ho, Er, and Tm. The superconductivity is observed for RE = Y, Lu, Dy, Ho, Er, and Tm. Thus, superconductivity coexists with magnetic order for RE = Dy, Ho, Er, and Tm, and the ratio of superconducting transition temperature TSC to antiferromagnetic (AF) ordering temperature TN ranges from TSC/TN = 7.0 for TmNi2B2C to 0.60 for DyNi2B2C.[101103] The coexistence and competition of magnetism and superconductivity in these compounds have been systematically investigated experimentally and theoretically.[99103] In recent years, we have further investigated the MCE in parent and doped RENi2B2C superconductors.[104107] The main achievements will be shown in the following sections. The superconducting transition and the magnetic ordering temperatures together with the MCE parameters are summarized in Table 2 for a quick comparison of the MCE in the RENi2B2C superconductors.

Table 2.

The superconductivity transition temperature (TSC), the magnetic transition temperature (TM), the maximum values of magnetocaloric parameters (
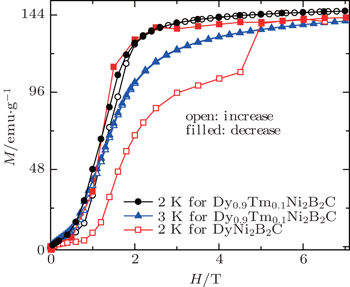
 and ΔTad), as well as the relative cooling power (RCP) for the magnetic field change of 0–5 T in the rare earth nickel boroncarbides RENi2B2C and RENiBC compounds. The column with a mark “–” means that the value was not reported in the literature. The column with a mark “N” means that superconductivity was not observed above 2 K.

.
4.1. Giant reversible MCE in Dy0.9Tm0.1Ni2B2C superconductor

Figure 16 shows the low temperature magnetic isothermals on increasing (open symbols) and decreasing (filled symbols) field for Dy0.9Tm0.1Ni2B2C at 2 K and 3 K as well for DyNi2B2C at 2 K for a comparison. A large hysteresis for DyNi2B2C is observed, in contrast, the hysteresis of Dy0.9Tm0.1Ni2B2C is negalectable for T ≥ 3 K. The magnetic phase transition TM and superconducting transition temperature TSC are determined to be 9.2 K and 4.5 K, respectively, which are lower than those in DyNi2B2C.[102,104] A set of selected magnetic isothermals M(H) were measured to evaluate the MCE in Dy0.9Tm0.1Ni2B2C. The M(H) curves were converted to the Arrot plot of H/M vs. M2 for Dy0.9Tm0.1Ni2B2C at some selected temperatures, which reveals the occurrence of a first order magnetic phase transition based on the Banerjee criterion,[43] as there is a clear S-shaped behavior below the transition temperature.

Fig. 16. Magnetic isothermals on increasing (open symbols) and decreasing (filled symbols) field for Dy0.9Tm0.1Ni2B2C at 2 K and 3 K as well for DyNi2B2C at 2 K.[104]

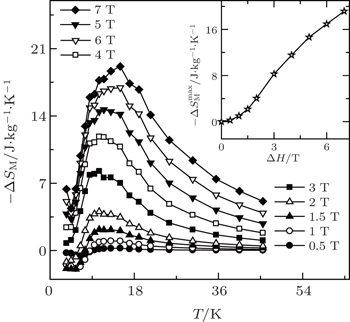
The resulted magnetic entropy changes −ΔSM in Dy0.9Tm0.1Ni2B2C, which were calculated from M(H, T) curves as a function of temperature, are shown in Fig. 17. The temperature and magnetic field change dependences of the −ΔSM(T) curves provide valuable information on the magnetic ordering in Dy0.9Tm0.1Ni2B2C. For the magnetic field changes ΔH ≤ 2 T, −ΔSM is negative (inverse MCE) below the transition temperature, and changes to positive with increasing temperature, which is corresponding to the magnetic transition from PM to AFM state. For ΔH ≥ 3 T, a positive −ΔSM (i.e., conventional MCE) with a broad peak around 13 K is observed. The values of maximum magnetic entropy change reach 14.7 J/kg·K and 19.1 J/kg·K for the magnetic field changes of 0–5 T and 0–7 T, respectively. The giant MCE is believed to be related to the field induced first-order magnetic transition from AFM to FM.[104] The field dependence of for Dy0.9Tm0.1Ni2B2C is also shown in the inset of Fig. 17. The increases continuously with the increasing field, and a faster increase of with increasing field is observed above 2 T, i.e., the MCE could attain a higher value in a higher magnetic field. The MCE parameters of Dy0.9Tm0.1Ni2B2C are comparable with those of the potential promising magnetic refrigerant materials in the similar temperature region.[104]

Fig. 17. Temperature dependence of magnetic entropy change −ΔSM for Dy0.9Tm0.1Ni2B2C. The inset shows the maximum magnetic entropy change as a function of magnetic field changes.[104]
4.2. Large magnetic entropy change in Dy1−xHoxNi2B2C superconductors

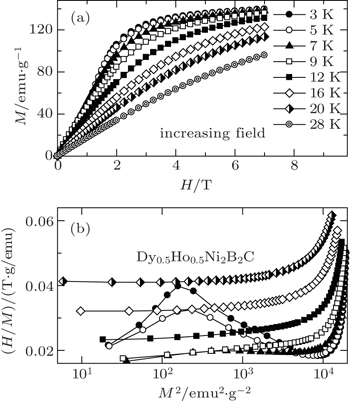
We have also investigated the superconductivity, magnetic properties, and MCE in Dy1−xHoxNi2B2C (x = 0–1) superconductors. The superconducting transition temperature TSC and the magnetic ordering temperature TM are determined to be 6.4 K, 6.4 K, 6.2 K, 8.1 K, 8.2 K and 10 K, 8.5 K, 8 K, 6 K, 5 K for x = 0, 03, 0.5, 0.7, 1, respectively.[105,106] A set of selected magnetic isothermals on increasing and decreasing field for Dy1−xHoxNi2B2C (x = 0, 0.3, 0.5, 0.7, and 1) are measured in the temperature range from 2 K to 36 K up to 7 T. Although some hysteresis of M(H) can be observed at low temperatures, it gradually becomes smaller with increasing temperature, and almost disappears above 5 K. All the samples show similar behaviors. Several isotherms with increasing field for x = 0.5 are presented in Fig. 18(a). To understand the order of magnetic transition in Dy1−xHoxNi2B2C, the measured MH isotherms are converted into H/M versus M2 plots. A clear negative slope in the low temperature and low magnetic field region can be observed for all the compounds, the Arrott plots of x = 0.5 are shown in Fig. 18(b) for an example, indicating the first order magnetic phase transition for Dy1−xHoxNi2B2C (x = 0, 0.3, 0.5, 0.7, and 1) compounds.[106]

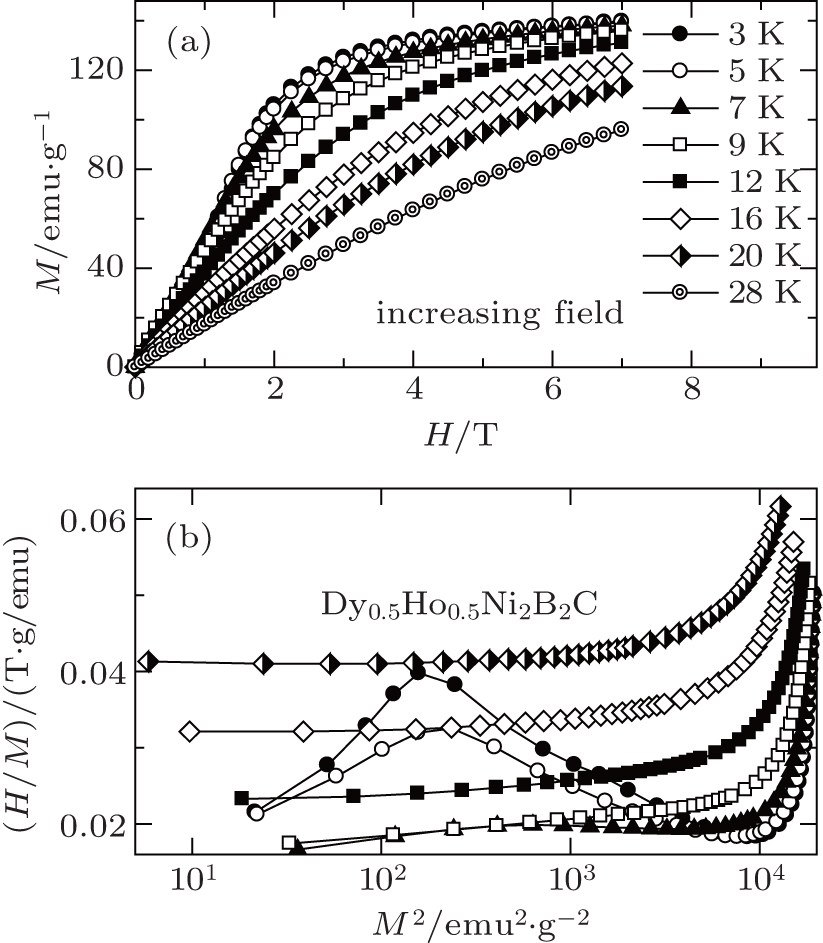
Fig. 18. (a) Magnetic field dependence of the magnetization for Dy0.5Ho0.5Ni2B2C at some selected temperatures. (b) The plots of H/M versus M2 for Dy0.5Ho0.5Ni2B2C at some selected temperatures. Copyright (2011) The Japan Society of Applied Physics.[105]

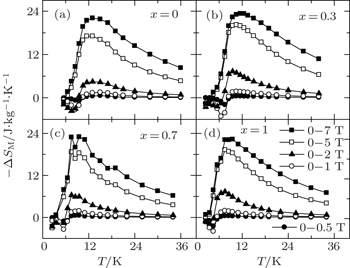
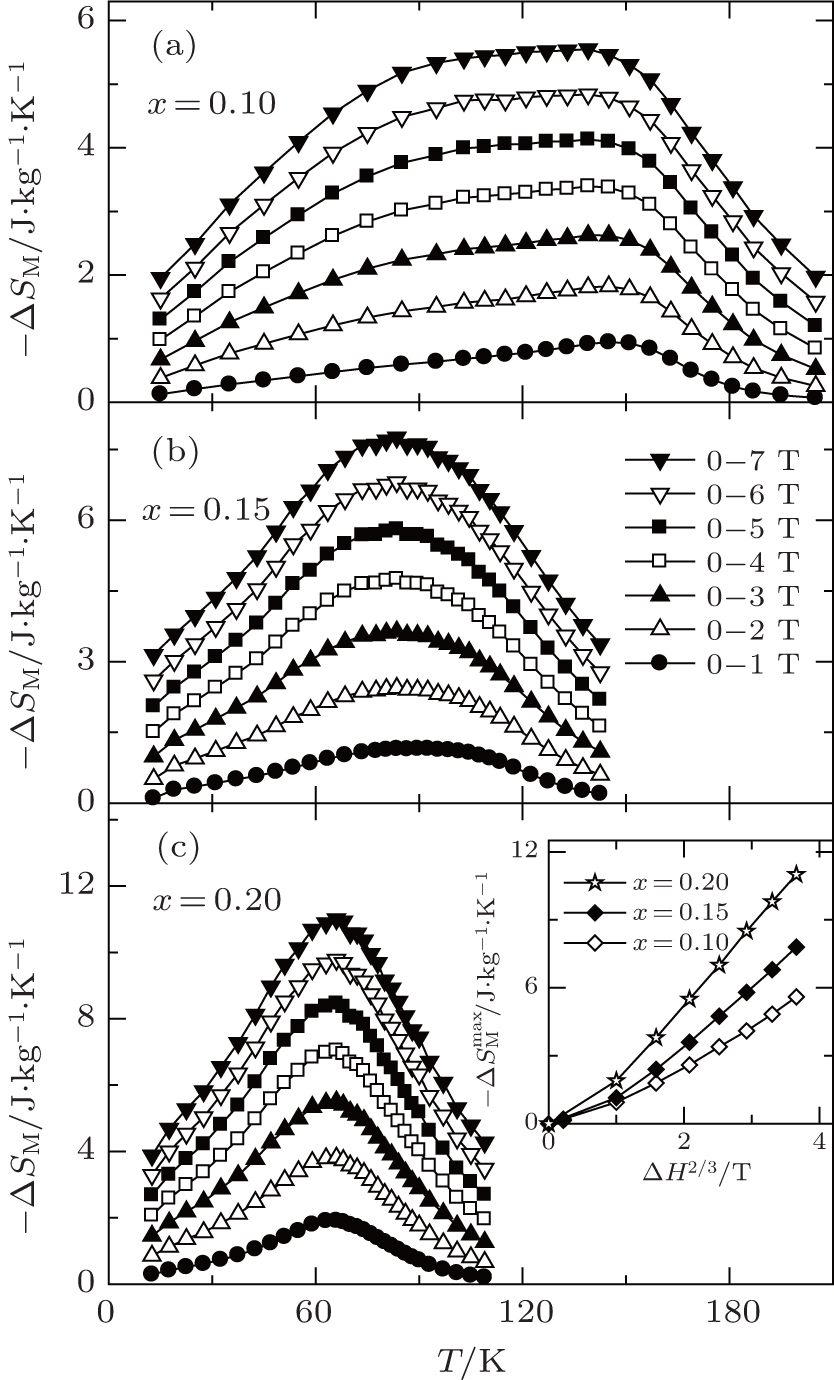
The magnetic entropy change −ΔSM was calculated from magnetization isotherm M(H,T) curves. The resulted temperature dependence of −ΔSM is shown in Fig. 19 for x = 0, 0.3, 0.7, and 1 and in Fig. 20(b) for x = 0.5. The magnetic entropy change for Dy0.5Ho0.5Ni2B2C was also calculated from the field and temperature dependence of heat capacity C(T, H) [as shown in Fig. 20(a)] using , and the results are shown in Fig. 20(b). The results of entropy changes calculated from M(T,H) and C(T,H) are consistent with each other. For low magnetic field changes, −ΔSM is negative (inverse MCE) below the transition temperature, and changes to positive with increasing temperature which can be understood in terms of the FM–AFM phase coexistence and the variation in the ratio of these phases under different magnetic fields. For the magnetic field changes of 0–5 T and 0–7 T, a positive −ΔSM (i.e., conventional MCE) with a broad peak can be observed. For the magnetic field changes of 0–2 T, 0–5 T, and 0–7 T, the maximum values of magnetic entropy change are evaluated to be 4.5 J/kg·K, 17.1 J/kg·K, and 22.1 J/kg·K for x = 0; 7.3 J/kg·K, 20.2 J/kg·K, and 23.3 J/kg·K for x = 0.3; 5.9 J/kg·K, 18.5 J/kg·K, and 22.4 J/kg·K for x = 0.5; 6.3 J/kg·K, 18.7 J/kg·K, and 22.9 J/kg·K for x = 0.7; and 7.3 J/kg·K, 19.2 J/kg·K, and 22.3 J/kg·K for x = 1, respectively.[106] The large magnetic entropy changes in Dy1−xHoxNi2B2C are believed to be related to the field induced first-order magnetic transition from AFM to FM. The values of RCP are all keeping at the same high values in the range of 45–62 J/kg, 243–290 J/kg, and 414–510 J/kg for the magnetic field changes of 0–2 T, 0–5 T, and 0–7 T, respectively. The values of and RCP for Dy1−xHoxNi2B2C (x = 0, 0.3, 0.5, 0.7 and 1) are comparable with those some potential magnetic refrigerant materials reported in the same temperature range, which indicate that the Dy1−xHoxNi2B2C compounds could be promising candidates for low temperature magnetic refrigeration.[106]

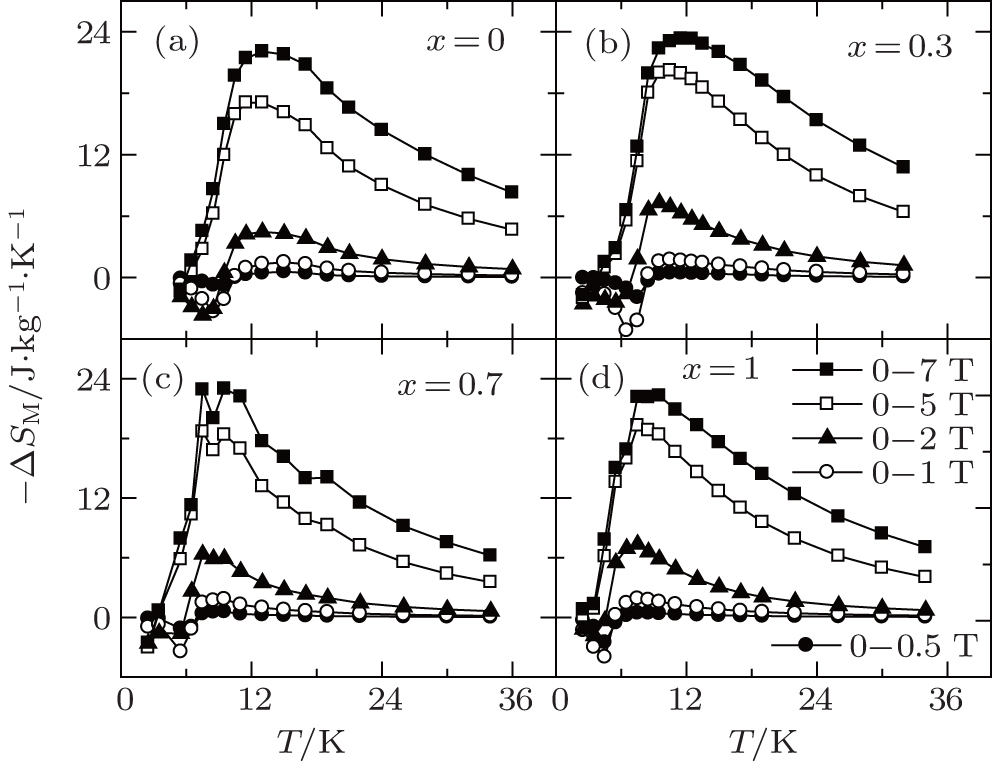
Fig. 19. Temperature dependence of magnetic entropy change −ΔSM calculated from M(T,H) for Dy1−xHoxNi2B2C (x = 0, 0.3, 0.7, and 1). Copyright (2011) The Japan Society of Applied Physics.[105]
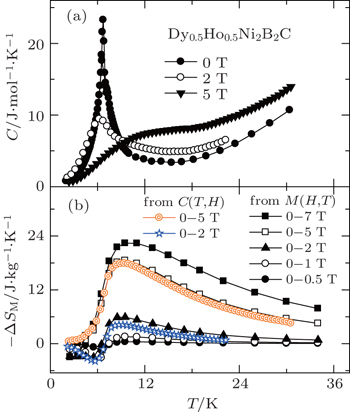
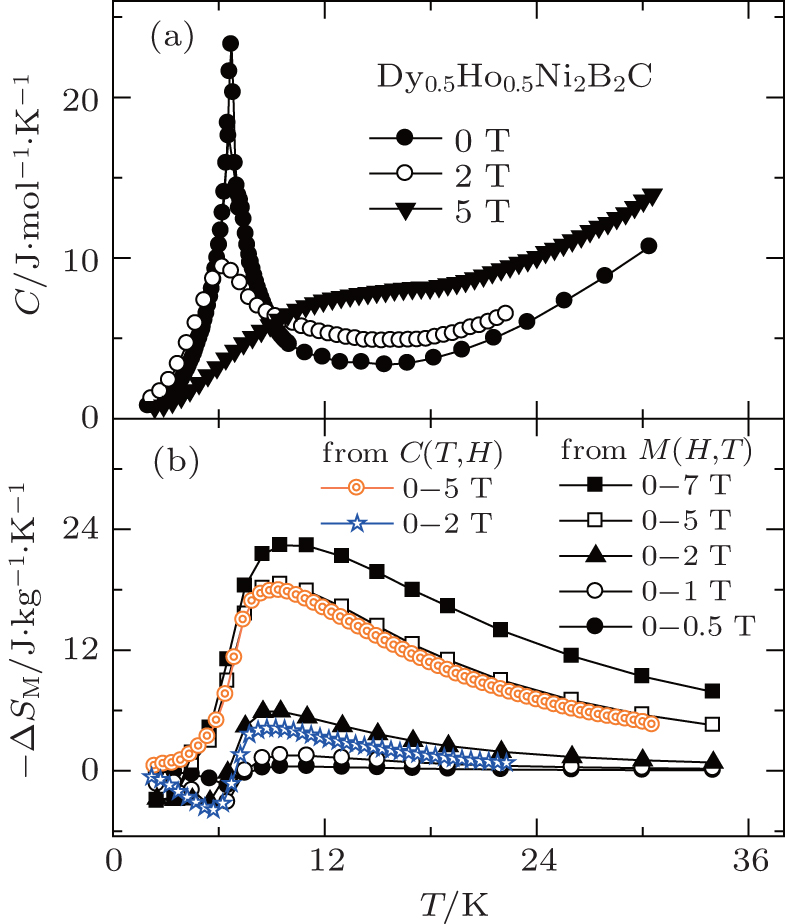
Fig. 20. (a) Temperature dependence of heat capacity under the magnetic field of 0 T, 2 T, and 5 T for Dy0.5Ho0.5Ni2B2C. (b) Temperature dependence of magnetic entropy change −ΔSM for Dy0.5Ho0.5Ni2B2C calculated from C(T,H) and M(T,H) respectively. Copyright (2011) The Japan Society of Applied Physics.[105]
4.3. Ni site doping effect on MCE for RENi2−xAxB2C (RE = Dy and Er)

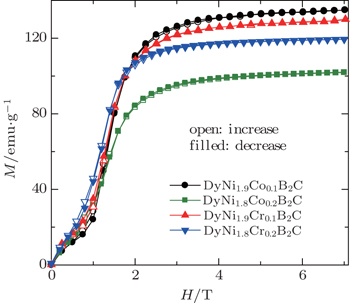
The magnetic properties and MCE of the DyNi2−xAxB2C (A = Co and Cr, x = 0.1 and 0.2) compounds were also investigated. No superconductivity can be observed above 2 K, and the magnetic transition temperatures TM are determined to be 9.8 K, 8.4 K, 8.0 K, 9.2 K, and 8.8 K for x = 0, 0.1 (Co), 0.2 (Co), 0.1 (Cr), and 0.2 (Cr) in DyNi2−xAxB2C system, respectively. Figure 21 shows the magnetic isothermals on increasing (open symbols) and decreasing (filled symbols) field for DyNi2−xAxB2C (A = Co and Cr, x = 0.1 and 0.2) at 2 K, the hysteresis is neglectable for all the present DyNi2−xAxB2C, which is beneficial for application. Similar to that of Dy site Tm substitution,[104] Ni site Co or Cr substitution can also effectively reduce (even eliminate) the magnetic hysteresis of DyNi2B2C.[107]

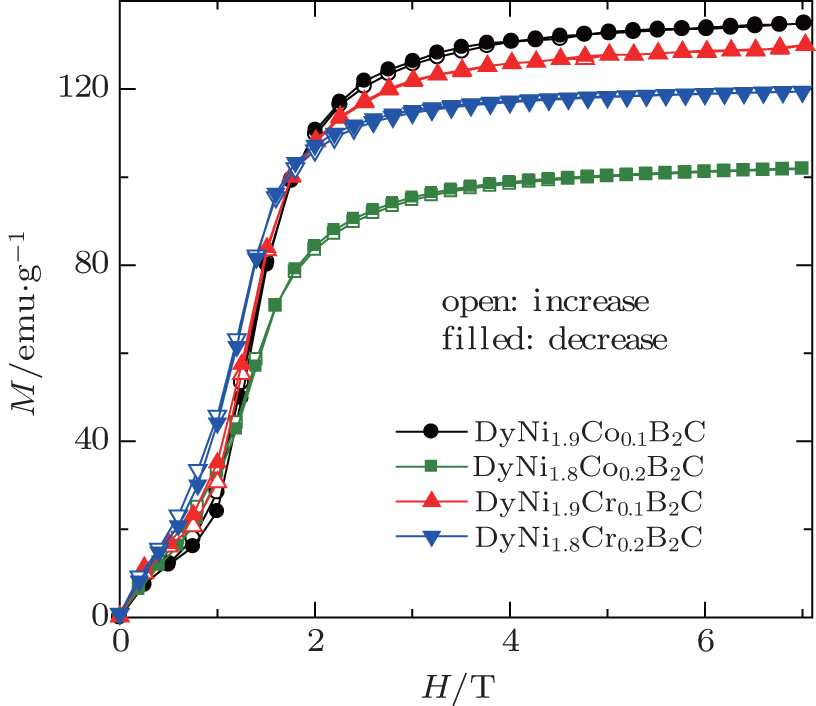
Fig. 21. Magnetic isothermals on increasing (open symbols) and decreasing (filled symbols) field at 2 K for DyNi2−xAxB2C (A = Co and Cr, x = 0.1 and 0.2).[107]

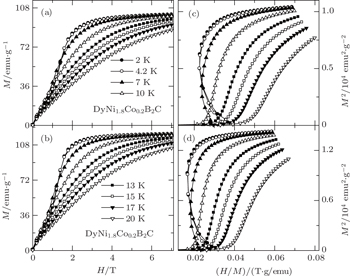
To evaluate the MCE in DyNi2−xAxB2C (A = Co and Cr, x = 0.1 and 0.2), a set of magnetic isothermals were measured. All the samples show similar behaviors. Several isotherms of DyNi1.8A0.2B2C for A = Co and Cr are presented in Figs. 22(a) and 22(b), and the corresponding Arrott plots are presented in Figs. 22(c) and 22(d). Ni site Co or Cr substitution lowers the magnetic transition temperature TM, and reduces the magnetic hysteresis of DyNi2B2C. A clear negative slope in the low temperature and low magnetic field region can be observed in Figs. 22(c) and 22(d), indicating the first order magnetic phase transition in the DyNi2−xAxB2C compounds.

Fig. 22. Magnetic isothermals at some selected temperatures for (a) DyNi1.8Co0.2B2C and (b) DyNi1.8Cr0.2B2C. The curves of H/M versus M2 for (c) DyNi1.8Co0.2B2C and (d) DyNi1.8Cr0.2B2C at some selected temperatures.[107]

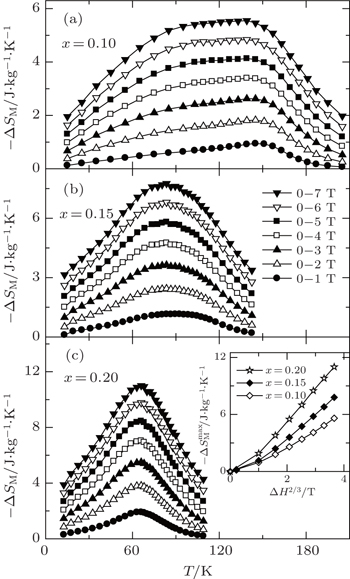
The temperature and field dependences −ΔSM for DyNi2−xAxB2C (A = Co and Cr, x = 0.1 and 0.2) were calculated based on the M(H,T) curves (as shown in Fig. 23). For the magnetic field changes of 0–1 T and 0–2 T, −ΔSM is negative (inverse MCE) below the transition temperature, and changes to positive with increasing temperature, for the magnetic field changes of 0–5 T and 0–7 T, a positive −ΔSM (i.e., conventional MCE) can be observed. This behavior is similar to that of the Dy1−xHoxNi2B2C compounds,[106] which can be understood in terms of the FM and AFM phase coexistence and the variation in the ratio of these phases under different magnetic fields. For the magnetic field change of 0–2 T, the minimum and maximum values of −ΔSM are evaluated to be −1.4 J/kg·K and 4.7 J/kg·K for DyNi1.9Co0.1B2C, −1.9 J/kg·K and 2.3 J/kg·K for DyNi1.8Co0.2B2C, −1.4 J/kg·K and 4.9 J/kg·K for DyNi1.9Cr0.1B2C, and −0.7 J/kg·K and 4.6 J/kg·K for DyNi1.8Cr0.2B2C, respectively. The values of are evaluated to be 16.3 J/kg·K, 10.2 J/kg·K, 16.1 J/kg·K, 13.7 J/kg·K and 19.3 J/kg·K, 13.7 J/kg·K, 19.1 J/kg·K, 15.8 J/kg K for x = 0.1 (Co), 0.2 (Co), 0.1 (Cr), 0.2 (Cr) in DyNi2−xAxB2C for the magnetic field changes of 0–5 T and 0–7 T, respectively.[107]

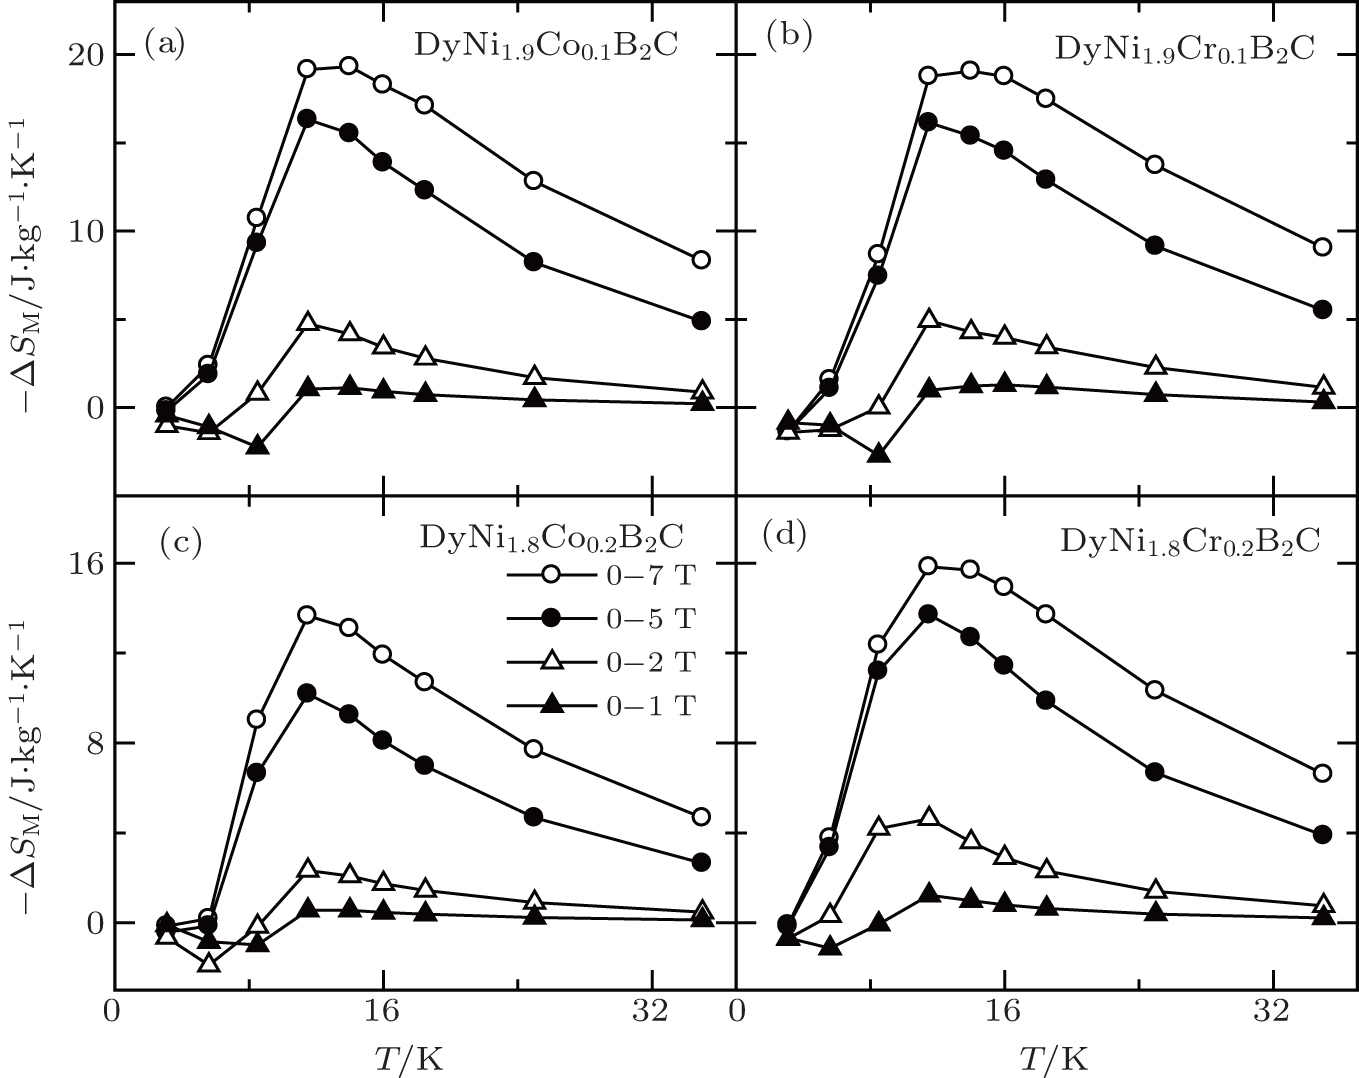
Fig. 23. Temperature dependence of magnetic entropy change −ΔSM for DyNi2−xAxB2C (A = Co and Cr, x = 0.1 and 0.2).[107]

Zhang and Yang[108] have investigated the magnetic properties and MCE in ErNi2−xFexB2C (x = 0, 0.1, and 0.2) compounds. Similar to those of DyNi2−xAxB2C (A = Co and Cr, x = 0.1 and 0.2), substitution of Fe for Ni lowers the magnetic transition temperature TM, and reduces the magnetic hysteresis of ErNi2B2C. The inverse MCE under low magnetic field at low temperatures is attributed to the nature of antiferromagnetic state for the present ErNi2−xFexB2C compounds. A normal MCE is observed under higher magnetic field changes, which is related to a field-induced first order metamagnetic transition from AFM to FM state. For the magnetic field change of 0–7 T, the maximum values of magnetic entropy change are 14.5 J/kg·K, 12.7 J/kg·K, and 10.6 J/kg·K for x = 0, 0.1 and 0.2 in ErNi2−xFexB2C, respectively.[108]

5. Summary

Investigations of MCE are of great interest for fundamental research and technological application. Our recent progress of the magnetic properties and MCE as well as its origin and potential application for magnetic refrigeration in some rare earth based intermetallic compounds are reviewed, and some of them possess excellent MCE properties. The main achievements are summarized as follows. 1) The TmZn compound exhibits a ferromagnetic state below the Curie temperature of TC = 8.4 K, and processes a field-induced metamagnetic phase transition around and above TC, resulting in a giant reversible MCE. Particularly, the values of reach 11.8 J/kg·K and 19.6 J/kg·K for low magnetic field changes of 0–1 T and 0–2 T, respectively, indicating that TmZn could be a promising candidate for low temperature and low field magnetic refrigeration. 2) A single-phase Eu4PdMg compound was synthesised by induction melting of the elements in a sealed tantalum tube in a water-cooled sample chamber. Eu4PdMg has a very magnetic field sensitive magnetic phase transition, resulting in a reversible, table-like MCE over a broad temperature range. Additionally, the RCP values are obviously larger than those of some potential magnetic refrigerant materials in the similar temperature region, making Eu4PdMg attractive for magnetic refrigeration from 20 K to 160 K. 3) The GdCd1−xRux solid solutions with x = 0.1, 0.15, and 0.2 have been successfully synthesized and the magnetism and MCE have been investigated. The samples undergo a second order magnetic phase transition from a paramagnetic state to a ferromagnetic state at Curie temperatures of TC ∼ 160 T, 108 T, and 73 K for x = 0.1, 0.15, and 0.2, respectively. A large reversible MCE with a wide temperature range in GdCd1−xRux solid solutions was observed, which makes the GdCd1−xRux solid solutions considerable for active magnetic refrigeration. 4) The Tm substitution effectively reduces the thermal hysteresis of DyNi2B2C, therefore, a giant reversible MCE has been observed in antiferromagnetic superconductor Dy0.9Tm0.1Ni2B2C, which is related to a field-induced first order metamagnetic transition from AFM to FM state. 5) The magnetic transition temperature TM as well as the temperature of in antiferromagnetic superconductors Dy1−xHoxNi2B2C gradually shifts to low temperature with increasing x, while the values of remain at almost the same high value, which make the Dy1−xHoxNi2B2C compounds attractive for active magnetic refrigeration at low temperature. The present results may provide some valuable information for searching proper magnetic materials for low temperature magnetic refrigeration.

Reference
1Warburg E1881 Ann. Phys. Leipzig 13 141
2Debye P1926Ann. Phys.811154
3Giauque W F 1927 J. Am. Chem. Soc. 49 1864
4Giauque W FMacDougall D P 1933 Phys. Rev. 43 768
5Li RNumazawa THashimoto TTomoyiko AGoto TTodo S 1986 Adv. Cryog. Eng. 32 287
6McMichael R DRitter J JShull R D J 1993 Appl. Phys. 73 6946
7Pecharsky V KGschneidner K AJr 1999 J. Magn. Magn. Mater. 200 44
8Tishin A M 1999 Handbook of Magnetic Materials 12 395
9Zimm CJastrab ASternberg APecharsky V KGschneidner KJrOsborne MAnderson I1998Adv. Cryog. Eng.431759
10Pecharsky V KGschneidner K AJr 1997 Phys. Rev. Lett. 78 4494
11Gschneidner K AJrPecharsky V KTsoko A O 2005 Rep. Prog. Phys. 68 1479
12Singh N KSuresh K GNigam A KMalik S KCoelho A AGama S 2007 J. Magn. Magn. Mater. 317 68
13Gratz ZMarkosyan A S2001J. Phys.: Condens. Matter3R385
14Bruck E 2005 J. Phys. D: Appl. Phys. 38 R381
15Tegus OBruck EBuschow K H JDe Boer F R 2002 Nature 415 150
16Wada HTanabe Y 2001 Appl. Phys. Lett. 79 3302
17Yue MZhang H GLiu D MZhang J X 2015 Chin. Phys. B 24 017505
18Zhong WAu C KDu Y W 2013 Chin. Phys. B 22 057501
19Phan M HYu S C 2007 J. Magn. Magn. Mater. 308 325
20Liu JGottschall TSkokov K PMoore J DGutfleisch O 2012 Nat. Mater. 11 620
21Li ZXu KZhang YTao CZheng DJing C 2015 Sci. Rep. 5 15413
22Liu J 2014 Chin. Phys. B 23 047503
23Hu F XShen B GSun J R 2013 Chin. Phys. B 22 037505
24Hu F XShen B GSun J RCheng Z HRao G HZhang X X 2001 Appl. Phys. Lett. 78 3675
25Hu F XShen B GSun J RWang G JCheng Z H 2002 Appl. Phys. Lett. 80 826
26Shen B GSun J RHu F XZhang H WCheng Z H 2009 Adv. Mate. 21 4545
27Shen B GHu F XDong Q YSun J R 2013 Chin. Phys. B 22 017502
28Fujita AFujieda SHasegawa YFukamichi K 2003 Phys. Rev. B 67 104416
29Zhang C LShi H FYe E JNie Y GHan Z DQian BWang D H 2015 Appl. Phys. Lett. 107 212403
30Liu E KWang W HFeng LZhu WLi G JChen J LZhang H WWu G HJiang C BXu H BBoer de F R 2012 Nat. Commun. 3 873
31Wei Z YLiu E KLi YXu G ZZhang X MLiu G DXi X KZhang H. WWang HWu G HZhang X X 2015 Adv. Electron. Mater. 1 1500076
32Wang D HHan Z DXuan H CMa S CChen S YZhang C LDu Y W 2013 Chin. Phys. B 22 077506
33Zhang HShen B G 2015 Chin. Phys. B 24 127504
34Franco VBlazquez J SIngale BConde A 2012 Ann. Rev. Mater. Res. 42 305
35Manosa LPlanes AAcet M 2013 J. Mater. Chem. A 1 4925
36Li L WNamiki THuo DQian ZNishimura K 2013 Appl. Phys. Lett. 103 222405
37Gschneidner K AJrPecharsky V K 2000 Annu. Rev. Mater. Sci. 30 387
38Kitanovski AEgolf P W 2010 Int. J. Refrig. 33 449
39Oliveira de N ARanke von P J 2010 Phys. Rep. 489 89
40Gutfleisch OWillard M ABruck EChen C HSankar S GLiu J Ping 2011 Adv. Mater. 23 821
41Inoue JShimizu M 1982 J. Phys. F: Met. Phys. 12 1811
42Liu X BAltounian Z 2005 J. Magn. Magn. Mater. 292 83
43Banerjee B K1964Phys. Lett.1216
44Taylor K N R 1971 Adv. Phys. 20 551
45Buschow K H J 1977 Rep. Prog. Phys. 40 1179
46Adroja D TMalik S K 1991 J. Magn. Magn. Mater. 100 126
47Kalychak Ya MZaremba V IPöttgen RLukachuk MHoffmann R D 2004 Handbook on the Physics and Chemistry of Rare Earths 34 1
48Gupta SSuresh K G 2015 J. Alloys Compd. 618 562
49Pöttgen RGulden ThSimon A1999GIT Labor-Fachzeitschrift43133
50Pöttgen RLang AHoffman R DKünnen BKotzyba GMüllmann RMosel B DRosenhahn C1999Z. Kristallogr.214143
51Morin PRouchy JLacheisserie E T 1977 Phys. Rev. B 16 3182
52Galéra R MJoly YRogalev ABinggeli N 2008 J. Phys.: Condens. Matter 20 395217
53Jeromen ATrontelj Z 2005 J. Appl. Phys. 98 033515
54Givord DMorin PSchmitt D 1982 J. Appl. Phys. 53 2445
55Sousa de V S RPlaza E J RRanke von P J 2010 J. Appl. Phys. 107 103928
56Sousa de V S RRanke von P JGandra F C G 2011 J. Appl. Phys. 109 063904
57Li L WYuan YZhang YNamiki TNishimura KPöttgen RZhou S 2015 Appl. Phys. Lett. 107 132401
58Li L WYuan YZhang YPöttgen RZhou S 2015 J. Alloys Compd. 643 147
59Hermes WHarmening TPöttgen R 2009 Chem. Mater. 21 3325
60Li L WNiehaus OGerke BPöttgen R 2014 IEEE Trans. Magn. 50 2503604
61Zhang Y KHou LRen Z MLi XWilde G 2016 J. Alloys Compd. 565 635
62Kersting MMatar S FSchwickert CPöttgen R2012Z. Naturforsch.67b61
63Couillaud Y SLinsinger SDuée CRougier AChevalier BPöttgen RBobet J L 2010 Intermetallics 18 1115
64Tappe FScheickert CLinsinger SPöttgen R 2011 Monatsh. Chem. 142 1087
65Mater S FChevalier B BPöttgen R 2012 Intermetallics 31 88
66Li L WNiehaus OKersting MPöttgen R 2014 Appl. Phys. Lett. 104 092416
67Li L WNiehaus OKersting MPöttgen R 2015 Intermetallics 62 17
68Li L WNiehaus OKersting MPöttgen R 2015 IEEE Trans. Magn. 51 2503804
69Linsinger SHermes WEul MPöttgen R 2010 J. Appl. Phys. 108 043903
70Gorsse SChevalier BTuncel SPöttgen R 2009 J. Solid State Chem. 182 948
71Tappe FPöttgen R2011Rev. Inorg. Chem.315
72Hermes WRodewals U CPöttgen R 2010 J. Appl. Phys. 108 113919
73Li L WNiehaus OJohnscher MPöttgen R 2015 Intermetallics 60 9
74Franco VBlázquez J SConde A 2006 Appl. Phys. Lett. 89 222512
75Franco VConde ARomero-Enrique J MBlázquez J S 2008 J. Phys.: Condens. Matter 20 285207
76Li L WHutchison W DHuo DNamiki TQian ZNishimura K 2012 Scripta Mater. 67 237
77Li L WHu GUmehara IHuo DHutchison W DNamiki TNishimura K 2013 J. Alloys Compd. 575 1
78Li L WKadonaga MHuo DQian ZNamiki TNishimura K 2012 Appl. Phys. Lett. 101 122401
79Zhang Y KWilde G 2015 Physica B 472 56
80Li L WSaensunon BHutchison W DHuo DNishimura K 2014 J. Alloys Compd. 582 670
81Li L WNishimura KHutchison W DQian ZHuo DNamiki T 2012 Appl. Phys. Lett. 100 152403
82Mo Z JShen JYan L QWu J FTang C CShen B G 2013 J. Alloys Compd. 572 1
83Li L WNishimura KUsui GHuo DQian Z 2012 Intermetallics 23 101
84Zhang Y KYang B JWilde G 2015 J. Alloys Compd. 619 12
85Zhang Y KWilde G 2015 IEEE Trans. Magn. 51 2503104
86Li L WIgawa HNishimura KHuo D 2011 J. Appl. Phys. 109 083901
87Li L WNamiki THuo DQian ZNishimura K 2013 Appl. Phys. Lett. 103 222405
88Li L WNishimura KYamane H 2009 Appl. Phys. Lett. 94 102509
89Li L WHuo DIgawa HNishimura K 2011 J. Alloys Compd. 509 1796
90Wang J LCampbell S JCadogan J MStuder AZeng RDou S X 2011 Appl. Phys. Lett. 98 232509
91Li L WNishimura KIgawa HHuo D 2011 J. Alloys Compd. 509 4198
92Zhang Y KWilde GLi XRen Z MLi L W 2015 Intermetallics 65 61
93Zhang HSun Y JNiu EYang L HShen JHu F XSun J RShen B G 2013 Appl. Phys. Lett. 103 202412
94Zhang QCho J HLi BHu W JZhang Z D 2009 Appl. Phys. Lett. 94 182501
95Bingham N SWang HQin FPeng H XSun J FFranco VSrikanth HPhan M H 2012 Appl. Phys. Lett. 101 102407
96Xia LTang M BChan K CDong Y D 2014 J. Appl. Phys. 115 223904
97Li L WHuo DQian ZNishimura K 2014 Intermetallics 46 231
98Schäfer KSchwickert CNiehaus OWinter FPöttgen R 2014 Solid. State Sci. 35 66
99Cava R JTakagi HZandbergen H WKrajewski J JPeck W FSiegrist TJrBatlogg BDover van R BFelder R JMizuhashi KLee J OEisaki HUchida S 1994 Nature 367 252
100Canfield P CGammel P LBishop D J 1998 Phys. Today 51 40
101Muller K HNarozhnyi V N 2001 Rep. Prog. Phys. 64 943
102Li L WNishimura KFujii MMatsuda KHuo D 2010 Phys. Rev. B 81 214517
103Wolowiec C TWhite B DMaple M B 2015 Physica C 514 113
104Li L WNishimura K 2009 Appl. Phys. Lett. 95 132505
105Li L WNishimura KHuo DKadonaga MNamiki TQian Z 2011 Appl. Phys. Express 4 093101
106Li L WNishimura KKadonaga MQian ZHuo D 2011 J. Appl. Phys. 110 043912
107Li L WFan HMatsui SHuo DNishimura K 2012 J. Alloys Compd. 529 25
108Zhang Y KYang B J 2014 J. Alloys Compd. 610 540