

High-pressure Raman study of solid hydrogen up to 300 GPa
[Huang Xiaoli, Li Fangfei, Huang Yanping, Wu Gang, Li Xin, Zhou Qiang, Liu Bingbing, Cui Tian†,  ]
]
]
|
|


† Corresponding author. E-mail:
Project supported by the National Basic Research Program of China (Grant No. 2011CB808200), the Program for Changjiang Scholars and Innovative Research Team in University, China (Grant No. IRT1132), the National Natural Science Foundation of China (Grant Nos. 51032001, 11074090, 10979001, 51025206, 11274137, 11474127, and 11504127), the National Found for Fostering Talents of Basic Science, China (Grant No. J1103202), and the China Postdoctoral Science Foundation (Grant No. 2015M570265).
The high-pressure behavior of solid hydrogen has been investigated by in situ Raman spectroscopy upon compression to 300 GPa at ambient temperature. The hydrogen vibron frequency begins to decrease after it initially increases with pressure up to 38 GPa. This softening behavior suggests the weakening of the intramolecular bond and the increased intermolecular interactions. Above 237 GPa, the vibron frequency softens very rapidly with pressure at a much higher rate than that of phase III, corresponding to transformation from phase III into phase IV. The phase transition sequence has been confirmed from phase I to phase III and then to phase IV at 208 and 237 GPa, respectively. Previous theoretical calculations lead to the proposal of an energetically favorable monoclinic C2/c structure for phase III and orthorhombic Pbcn structure for phase IV. Up to 304 GPa, solid hydrogen is not yet an alkali metal since the sample is still transparent.
As an electrical insulator at ambient conditions, solid hydrogen was predicted to become an alkali metal under extreme compression.[1] Since Ashcroft pointed out that the metal hydrogen would be a room temperature superconductor in 1968,[2] the quest for metallic hydrogen at high pressure represents a longstanding problem in condensed matter physics. Ceperley et al. reported that the metallic pressure of hydrogen was about 3.0±0.4 Mbar by the quantum Monte Carlo calculation.[3] The two earliest static pressure experiments were done by Narayana et al. and Loubeyre et al., and both of them reported that solid hydrogen did not become an alkali metal up to 342 GPa.[4,5] Besides, Loubeyre et al. further proposed that metal hydrogen should be observed at about 450 GPa when the direct gap closes.[5] Recently, Eremets et al. found that hydrogen became opaque and electrically conductive above 220 GPa by electrical measurement.[6] Subsequently, Howie et al. have proposed a new phase IV and measured its band gap which reaches 1.8 eV at 315 GPa by the optical transmission spectra.[7] The recent experimental result showed that the solid hydrogen remained transparent until 360 GPa.[8] Therefore, the quest for the metallization of solid hydrogen is still underway.
As an important thermodynamic variable, high pressure provides an effective means to probe the structures in a wide parameter space by modifying molecular distances of the crystals.[9–11] In recent decades, it has become possible to perform static experiments under pressure calibrated above 300 GPa with the diamond anvil cell as a vehicle. While multimegabar pressures had been achieved consistently with other samples, the study of hydrogen at ultrahigh pressures presented many experimental challenges.[12] Two difficulties have to be overcome: one is that hydrogen is difficult to load into the sample chamber physically and chemically, and another is that many of hydrogen’s high-pressure properties are hard to measure. In addition, hydrogen embrittlement causes failure in pressure confinement. Therefore, it is a challenging and tough thing to study solid hydrogen under megabar pressure.
The crystal structure is considered a key to understanding its intriguing physical properties especially for pressure-induced metallization. Up to now, three high-pressure phases of solid hydrogen exist to 200 GPa at or below room temperature. Phase I has a hexagonal close-packed structure with freely rotating molecules.[13,14] Phase II differs from the lattice symmetry of phase I, possesses some degree of orientation order, and exists at temperatures below 135 K and up to 160 GPa.[15,16] Phase III was identified by Raman and infrared absorption measurements, which currently are the most sensitive means for identifying phase transitions of these materials at multimegabar pressures.[13] Phase III is separated from phase II by an almost vertical phase line from 0 to 125 K at 155 GPa.[17] There are still many disputes between experimental results and theoretical calculations about the crystal structures of solid hydrogen. However, hydrogen has the smallest electron-scattering cross-section among all elements, resulting in extremely weak x-ray diffraction intensity for structural determination. Furthermore, the small sample volume at ultrahigh pressures provides an additional challenge for measurements of other various properties. Raman spectrum has become a vital tool to study the vibration properties and phase transitions of materials particularly for low atomic number element.[18–24]
In this work, we have performed in situ ultrahigh pressure Raman spectroscopy investigation to explore the phonon behaviors and phase transitions of solid hydrogen at room temperature. Our results revealed that the phase transition sequence is from phase I to phase III and then to phase IV at 208 GPa and 237 GPa, respectively. Up to 304 GPa, solid hydrogen is still not metal since the sample is still transparent.
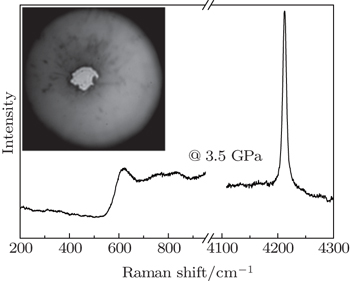
Ultrahigh-purity hydrogen gas was loaded into tungsten or rhenium gaskets of diamond anvil cells by a gas-loading system. The sealed pressure was about several GPa after hydrogen loading, and one of the loading Raman spectra and the sample chamber are shown in Fig.
The Raman spectra were collected as a function of pressure. Backscattering geometry was used, with both 532-nm and 646-nm laser lines as the Raman excitation wavelength. Prior to each measurement, the spectrometer was calibrated using an Si line. No dissolution of hydrogen into the gasket and no evidence of hydride formation were found during the experiment which achieved 304 GPa.
 | Fig. 1. The Raman spectra and sample chamber of the sample just after loading at 3.5 GPa. The used diamond culet is 100 μm and the sample chamber is about 20 μm. |
At lower pressures and room temperature, hydrogen crystallized into phase I with space group P63/mmc is a diatomic molecular solid with strong covalent molecular bonds, weak intermolecular interactions, and a filled valence band with a large band gap, which makes the material a good insulator.[13] The most prominent feature associated with the transition at these pressures is the change of the strong Raman vibron. As shown in Fig.
Besides the investigation of the hydrogen vibron below 200 GPa, we also did other experimental runs in order to obtain ultrahigh pressure above 300 GPa searching for the metallization of hydrogen. Recent improvements on the throughput and spatial resolution of our Raman set-up allowed us to collect signals from samples with 5 μm in diameter. We used 532-nm laser excitation wavelengths to measure the Raman spectra. We found that minimizing the exposure time significantly decreases the risk of diamond failure. The whole experimental measurement is investigated using a symmetric diamond anvil cell with 20-μm culet diamonds, and the sample diameter is about 10 μm after loading hydrogen into the cell with pressure 30 GPa. Figure
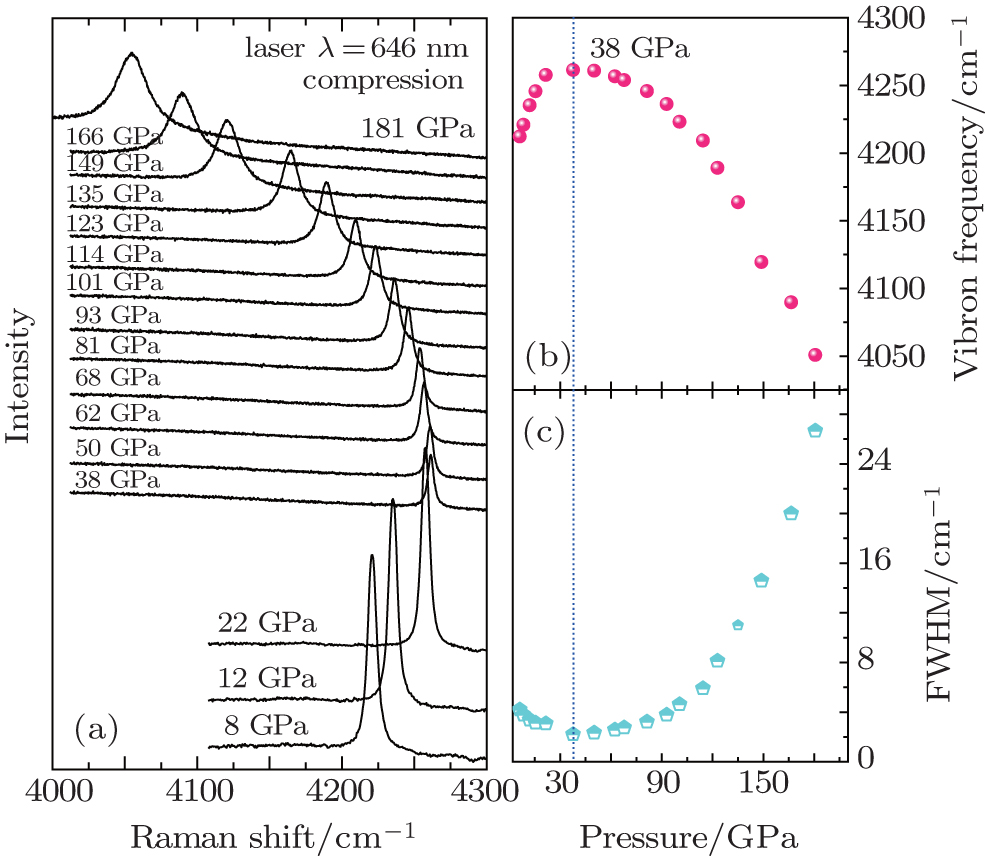 | Fig. 2. (a) Hydrogen vibron spectra under different pressures. (b) Pressure dependence of vibron frequency at 300 K. (c) Pressure dependence of the line width of the hydrogen vibron. |
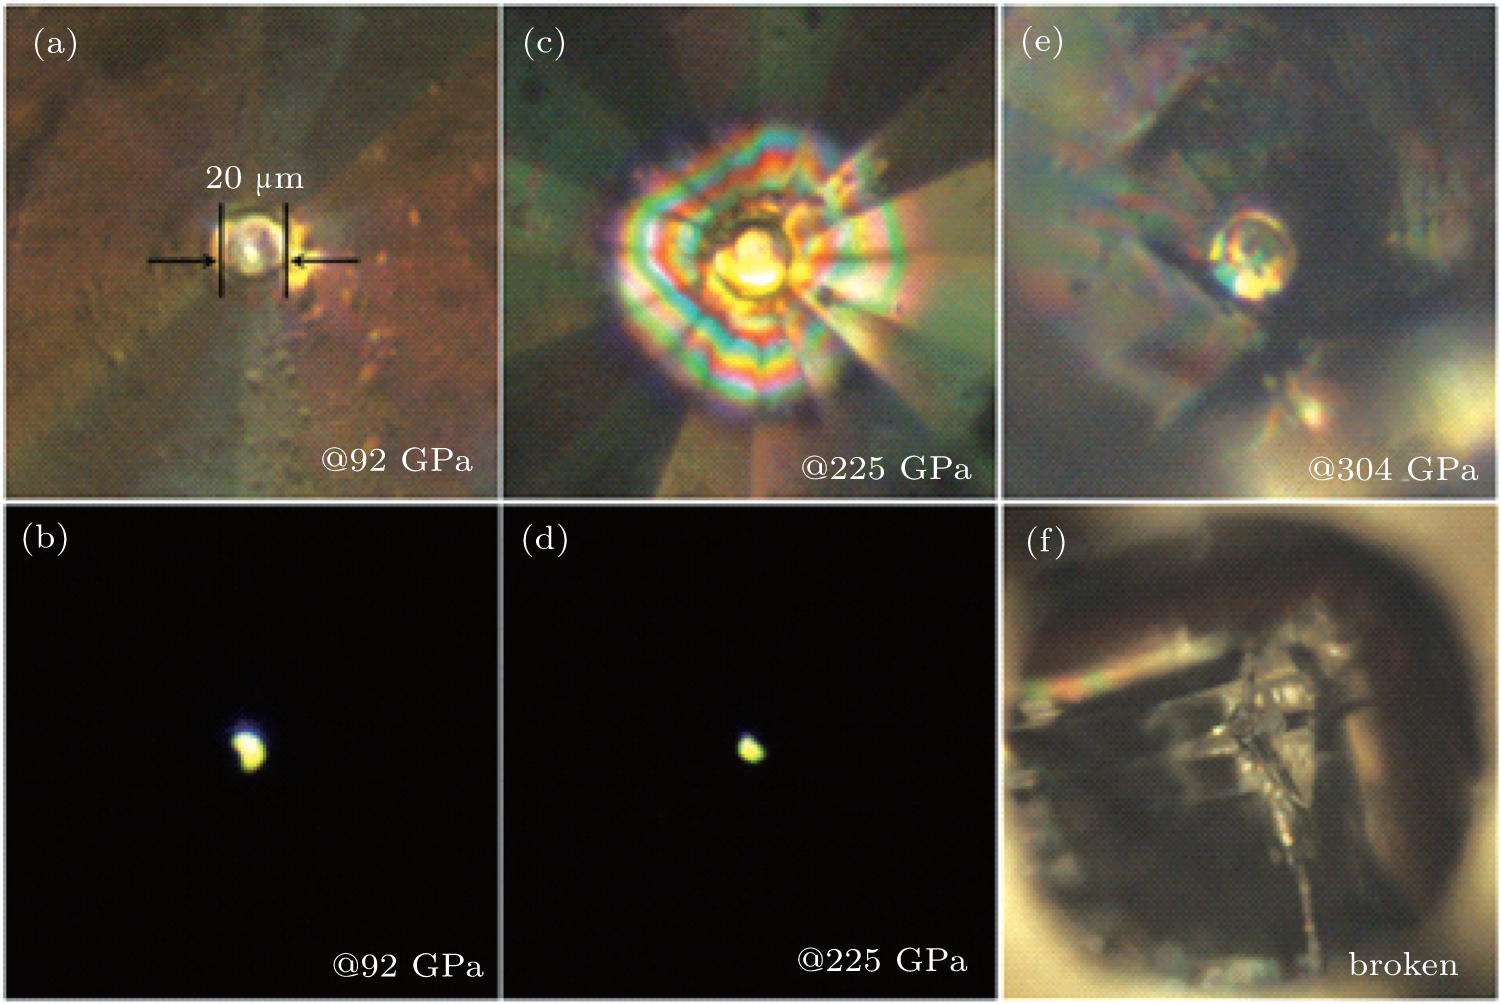 | Fig. 3. Optical microscopy images of solid hydrogen sample at (a) 92 GPa with transmitted and reflected white light and (b) 92 GPa with transmitted white light, at (c) 225 GPa with transmitted and reflected white light and (d) 225 GPa with transmitted white light, at (e) 304 GPa with transmitted and reflected white light. The diamond crushed at 304 GPa after measuring the Raman spectra, shown in panel (f). |
As shown in Fig. Selected diamond the first-order Raman spectra (left) and hydrogen vibron spectra (right) upon compression up to 304 GPa. The acquisition time of the hydrogen vibron spectra is increased to 20 s above 237 GPa.
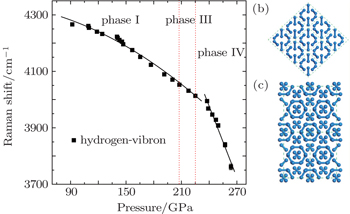
 | Fig. 5. (a) Pressure dependence of vibron frequency at 300 K, and the error bar is shorter than the size of the symbol. The labeled pressure range of phase III with dotted curves is about 208–225 GPa refereed to the previous literatures.[14,32](b) The candidate structure C2/c of phase III with 3 × 3 × 3 supercell and (c) the candidate structure Pbcn of phase IV with 2 × 2 × 1 supercell. These two structures are viewed along x–y plane. |
In summary, the high pressure behavior of solid hydrogen has been studied by in situ Raman spectra measurements under ultrahigh pressures at 300 K. It is found that the vibron frequencies decrease with the increase of pressure above 38 GPa. This softening behavior suggests the weakening of the intramolecular bond and the increased intermolecular interactions. Under ultrahigh pressures, the frequency of hydrogen vibron changes at pressures of 208 and 237 GPa, respectively, which corresponds to the phase transition sequence from phase I to phase III and then to phase IV. The previous ab initio random structural searches lead to the proposal of an energetically favorable monoclinic C2/c structure for phase III and orthorhombic Pbcn structure for phase IV. Up to 300 GPa, solid hydrogen is not yet an alkali metal since the sample is still transparent. Continued experiments and theoretical calculations are needed to provide more information of this fundamental system under extreme conditions.
| 1 | |
| 2 | |
| 3 | |
| 4 | |
| 5 | |
| 6 | |
| 7 | |
| 8 | |
| 9 | |
| 10 | |
| 11 | |
| 12 | |
| 13 | |
| 14 | |
| 15 | |
| 16 | |
| 17 | |
| 18 | |
| 19 | |
| 20 | |
| 21 | |
| 22 | |
| 23 | |
| 24 | |
| 25 | |
| 26 | |
| 27 | |
| 28 | |
| 29 | |
| 30 | |
| 31 | |
| 32 | |
| 33 | |
| 34 | |
| 35 |