

Electric and plasma characteristics of RF discharge plasma actuation under varying pressures
[Song Huimin†,  , Jia Min, Jin Di, Cui Wei, Wu Yun]
, Jia Min, Jin Di, Cui Wei, Wu Yun]
|
|


† Corresponding author. E-mail:
Project supported by the National Natural Science Foundation of China (Grant Nos. 11472306, 51336011, and 51407197).
The electric and plasma characteristics of RF discharge plasma actuation under varying pressure have been investigated experimentally. As the pressure increases, the shapes of charge–voltage Lissajous curves vary, and the discharge energy increases. The emission spectra show significant difference as the pressure varies. When the pressure is 1000 Pa, the electron temperature is estimated to be 4.139 eV, the electron density and the vibrational temperature of plasma are 4.71×1011 cm−3 and 1.27 eV, respectively. The ratio of spectral lines 
Plasma flow control based on plasma aerodynamic actuation, is an active flow control technique. It is very promising on lift enhancement and drag reduction of aircraft and stability expansion of aero-engine.[1–7]
The plasma aerodynamic actuation generated by dielectric barrier discharge (DBD) has been intensively investigated by researchers all over the world. Compared with DBD, RF discharge has advantages, such as stable volume discharge in high-speed airflow, and simple power tuning, which has drawn increasing attention for its potential application on both low and high speed flow control.[8–13]
Leonov et al. experimentally and theoretically investigated the dynamics of a single-electrode RF filament in supersonic airflow by means of optical emission spectrum and Schlieren visualization. It is revealed that the gas temperature in filamentary RF plasma can reach up to 4000 K at a static pressure of 120 Torr. RF discharge plasma filaments were proved effective on shock position and intensity control.[8] Klimov et al. experimentally investigated the surface RF plasma aerodynamic actuator in subsonic and supersonic airflow. Experimental results showed that surface RF discharge consists of many plasma filaments, which increase the surface pressure and decrease the stagnation pressure.[9,10] Bityurin et al. presented experimental and numerical results of the surface RF discharge at a conical body in airflow. Significant flow modification has been achieved between Mach number 0.5–2.0.[11] RF discharge was also adopted in their experiments for flow control around wing model and jet noise control.[8–13] Dedrick investigated the electrical and optical characteristics of RF asymmetric surface barrier discharge plasma in atmospheric pressure air.[14,15]
For practical purpose, the working altitude of plasma flow control is designed from 0 km to as high as 30 km, within which the static pressure changes influence RF discharge significantly. In this paper, the electric and plasma characteristics of RF discharge plasma actuation under varying pressure are investigated experimentally.
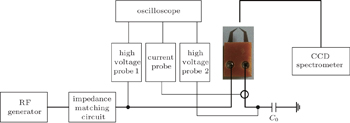
The schematic diagram of experimental setup is shown in Fig.
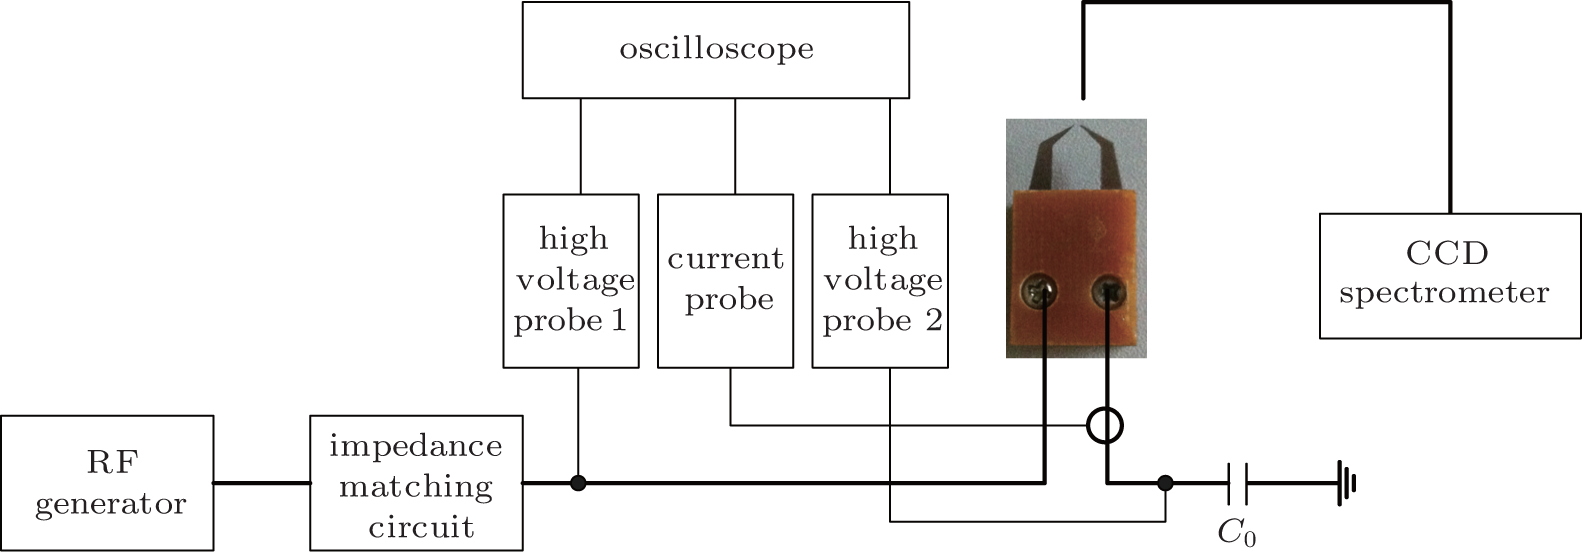 | Fig. 1. Schematic diagram of experiment setup. |
An RF generator/amplifier (AG 1017L, T&C) is adopted, which is a totally solid-state, air-cooled RF power source expressly designed for use in general ultrasonic and gas plasma applications. The maximum power output of AG 1017L is 500 W and the operating frequency varies from 10 kHz to 10 MHz. A pin–pin plasma actuator includes a pair of pin tungsten electrodes and a bakelite holding device. The pin–pin electrodes are aligned with a 0.5-mm gap between tips.[16] The pin–to–pin plasma actuator is fixed in the pressure chamber, located 5 cm away from the quartz observing window. An impedance matching circuit, which consists of inductors and capacitors, is designed to confirm impedance matching of RF generator and plasma actuator.
The voltage applied on the plasma actuator is measured with a high voltage probe 1 (P6015A, Tektronix), while the discharge current is measured with a current probe (TCP0030A, Tektronix). The capacitance C0 was connected in the circuit, so as to calculate the conduction charge. The voltage between the capacitance is measured by high voltage probe 2. These signals are displayed and recorded through an oscilloscope (DPO4104, Tektronix). The optical emission spectra are obtained with a charge coupled device spectrometer (Avantes USB2048) and the emission intensity is averaged temporally and spatially.
In order to acquire the influence of pressure, the images, voltages, and currents of RF discharge under different pressures are recorded and the effect of pressure on the charge–voltage Lissajous curves is also experimentally investigated.
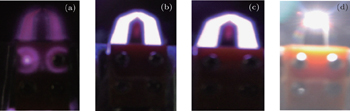
The images of RF discharge under different pressures are shown in Fig.
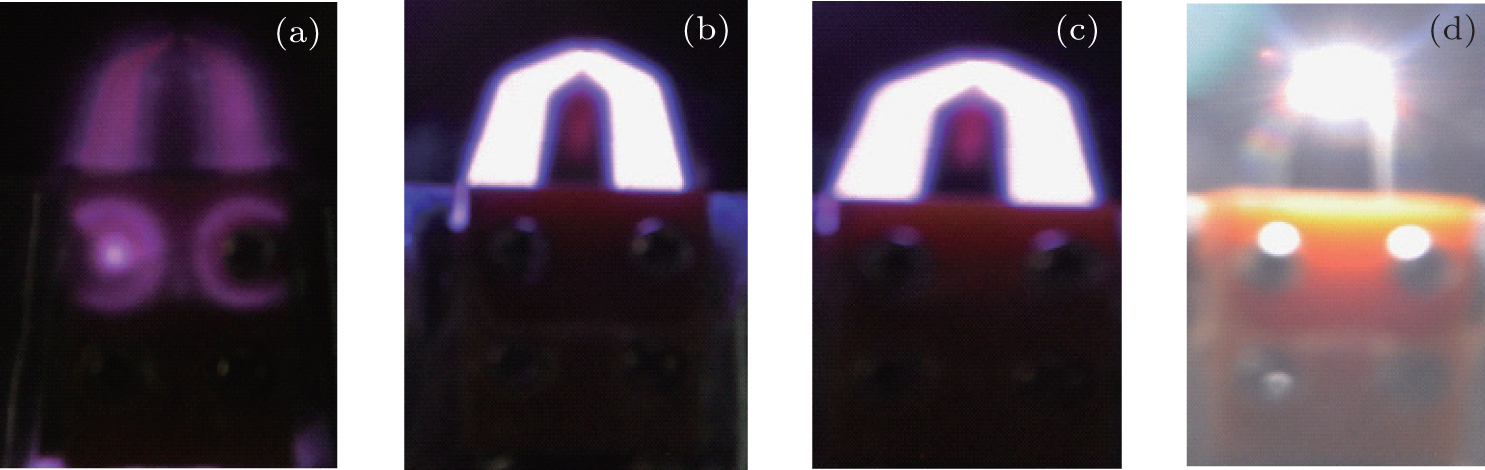 | Fig. 2. Images of RF discharge under different pressures. (a) 500 Pa, PL = 12 W, (b) 20000 Pa, PL =19 W, (c) 60000 Pa, PL = 47 W, (d) 96000 Pa, PL = 100 W. |
When the pressure is 500 Pa, the loading power (PL) is 12 W, and dim bluish violet light can be observed on the plasma actuator. With the increase of pressure and loading power, the luminous intensity increases. When the pressure is 96000 Pa, there is bright white light between the electrode tips. Figure
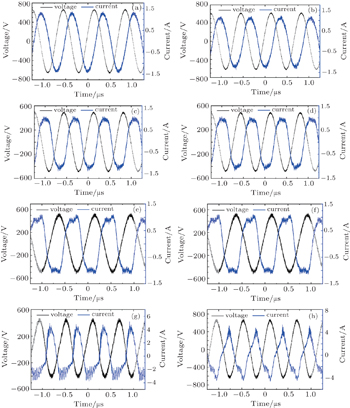
The voltage–current plots of RF discharge under different pressures are shown in Fig.
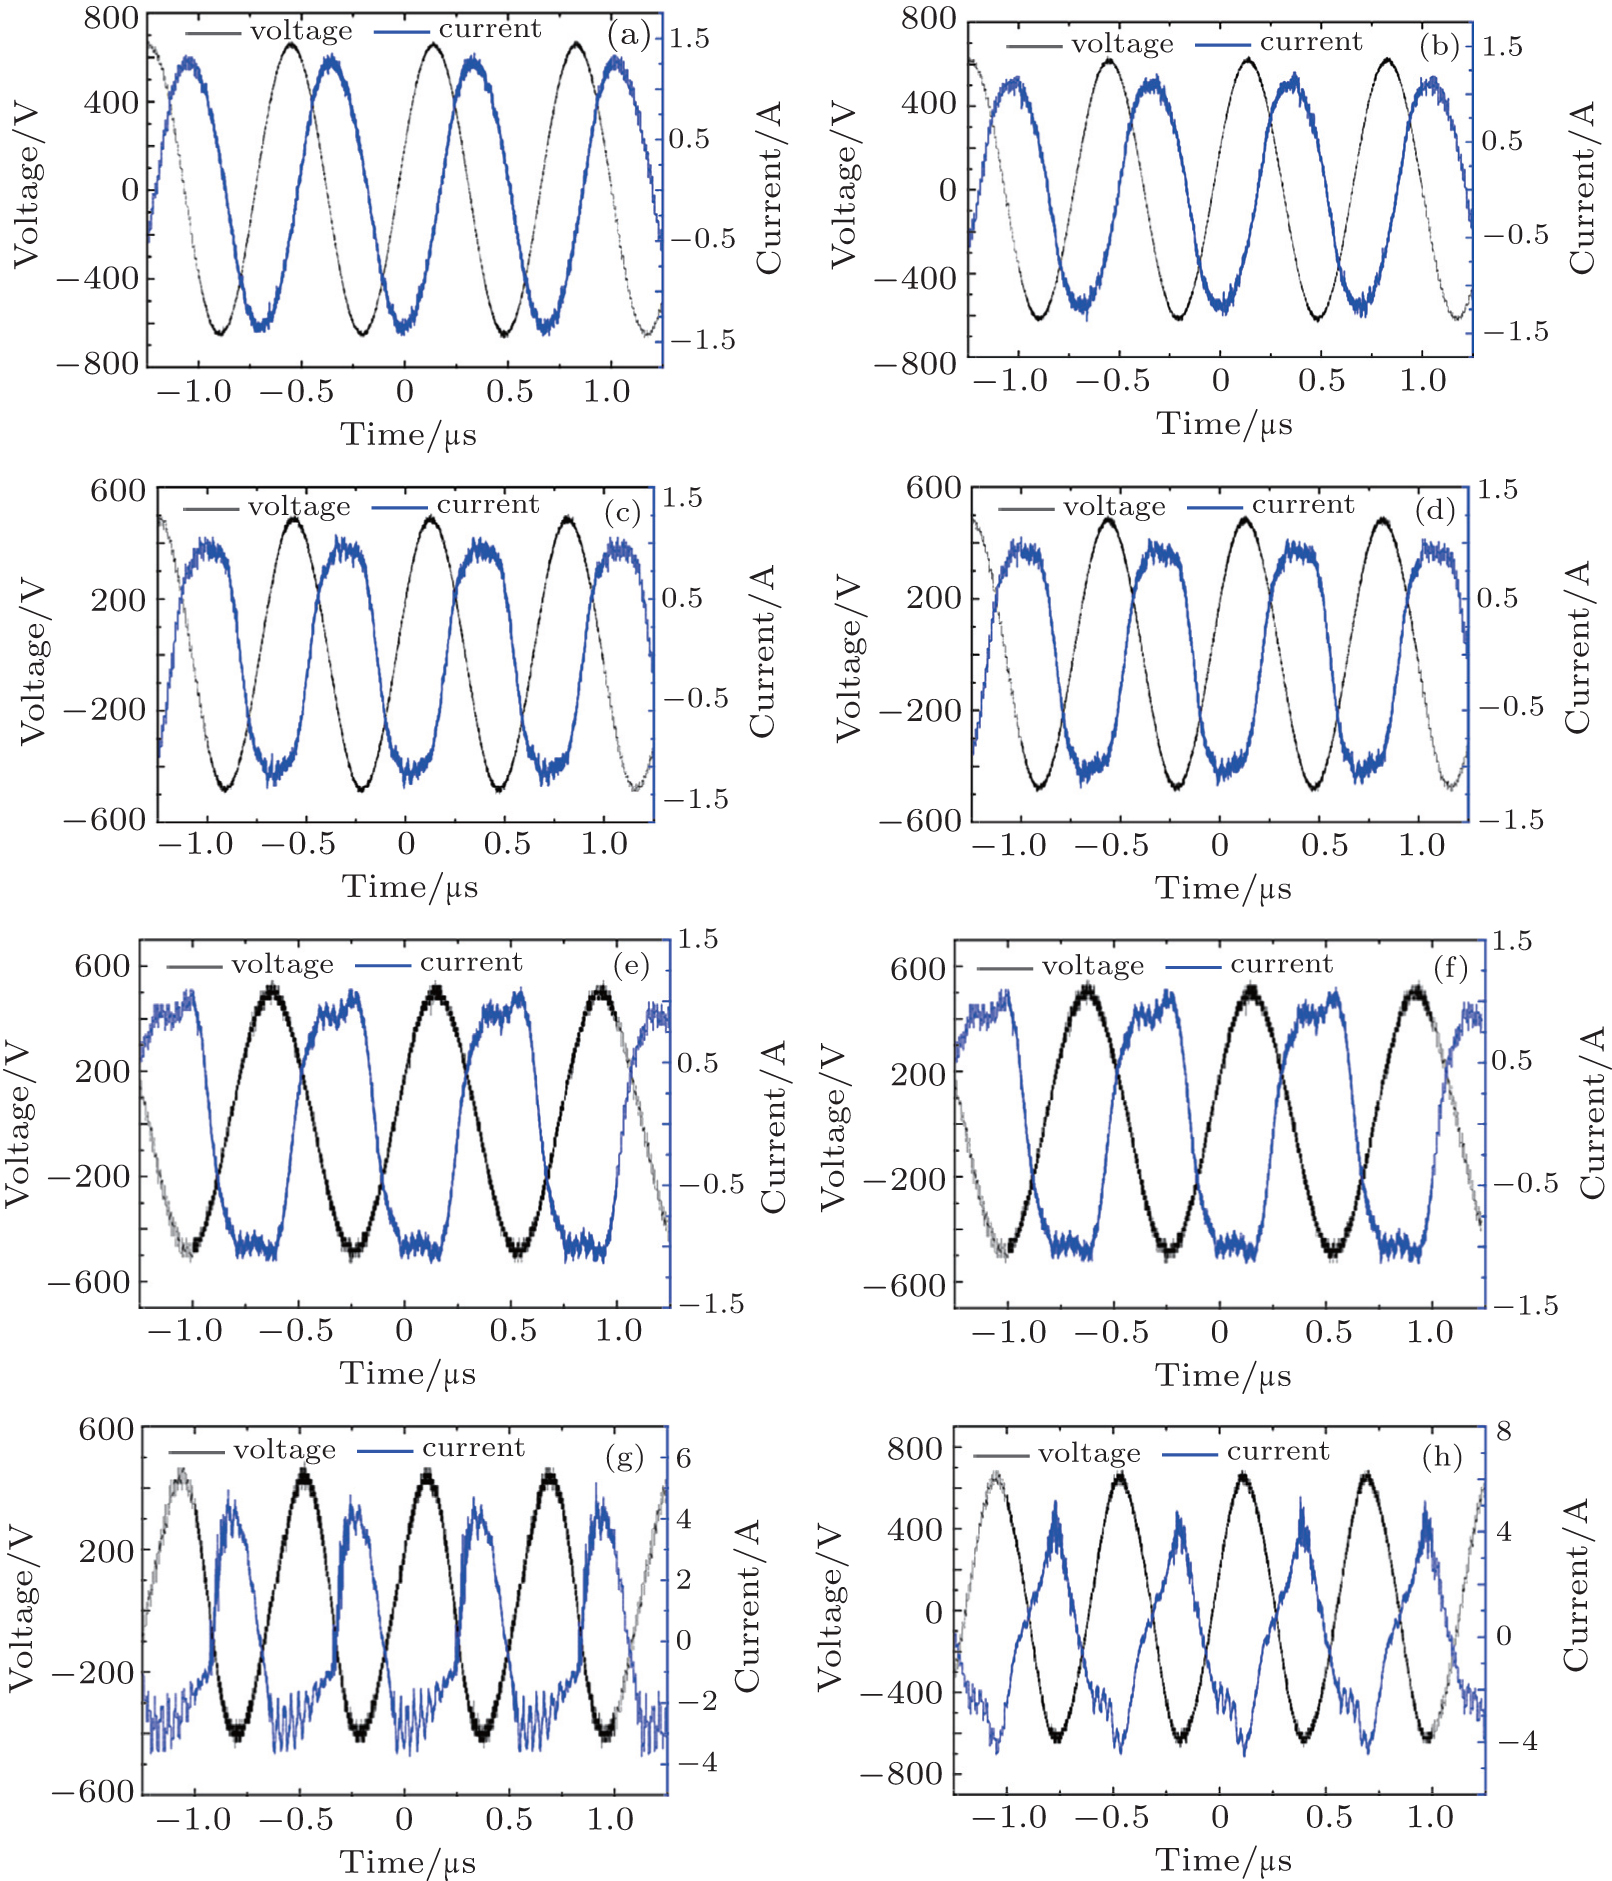 | Fig. 3. The V–I plots of RF discharge under different pressures. (a) 500 Pa, PL = 12 W; (b) 1000 Pa, PL = 15 W; (c) 5000 Pa, PL = 18 W; (d) 20000 Pa, PL = 19 W; (e) 40000 Pa, PL = 25 W; (f) 60000 Pa, PL = 47 W; (g) 70000 Pa, PL = 85 W; (h) 96000 Pa, PL = 100 W. |
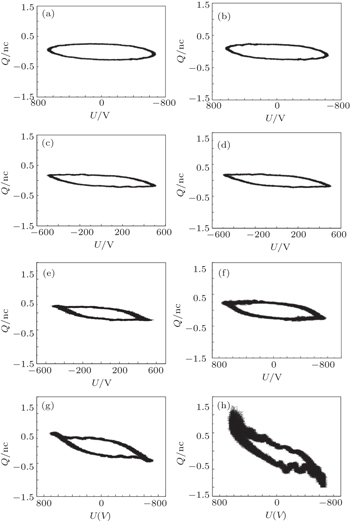
With charge–voltage Lissajous figures, discharge parameters such as electrode gap, dielectric equivalent capacitance, voltage between electrode gap, peak voltage, discharge power, discharge energy, and so on, can be calculated.[17] The Lissajous figures of pin–pin electrodes RF discharge under different pressures are shown in Fig.
 | Fig. 4. The Lissajous figures of RF discharge under different pressures. (a) 500 Pa, PI = 20 W, PL = 12 W; (b) 1000 Pa, PI = 20 W, PL = 15 W; (c) 5000 Pa, PI = 20 W, PL = 18 W; (d) 20000 Pa, PI = 20 W, PL = 19 W; (e) 40000 Pa, PI = 50 W, PL = 25 W; (f) 60000 Pa, PI = 70 W, PL = 65 W; (g) 70000 Pa, PI = 92 W, PL = 76 W; (h) 96000 Pa, PI = 140 W, PL = 100 W. |
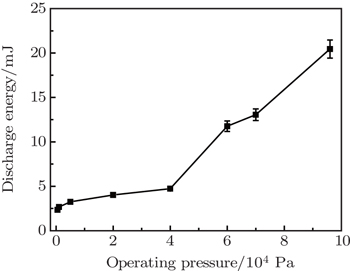
The relationship between Lissajous figures and discharge energy is linear. The discharge energy of one period (E(L)) can be written as

The discharge energy under varying pressures, which is calculated from the Lissajous curves in Fig.
 | Fig. 5. Discharge energy under different pressures. |
As an effective non-intrusive diagnostic method, optical emission spectroscopy is widely used to investigate air plasma.[18–21] In this paper, optical emission spectroscopy of RF discharge plasma was measured under varying operating pressures and loading powers.
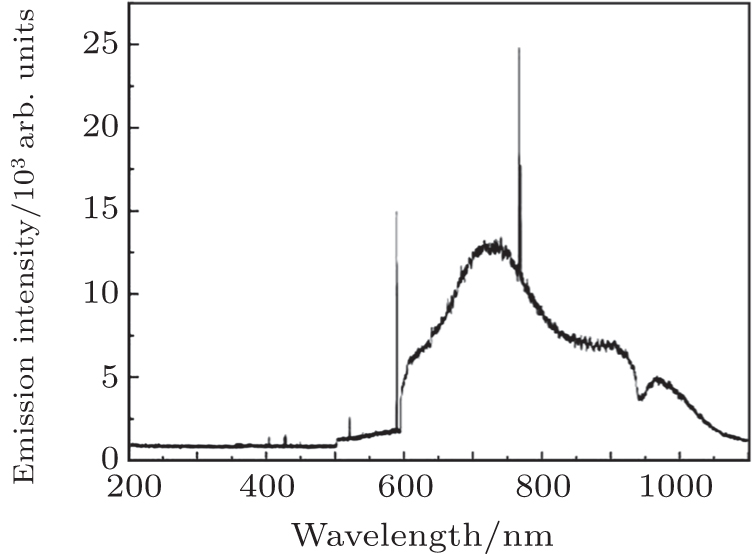
The emission spectral characteristics of RF discharge have been firstly investigated under low pressure. The emission spectrum of pin–pin electrodes RF discharge is shown in Fig.
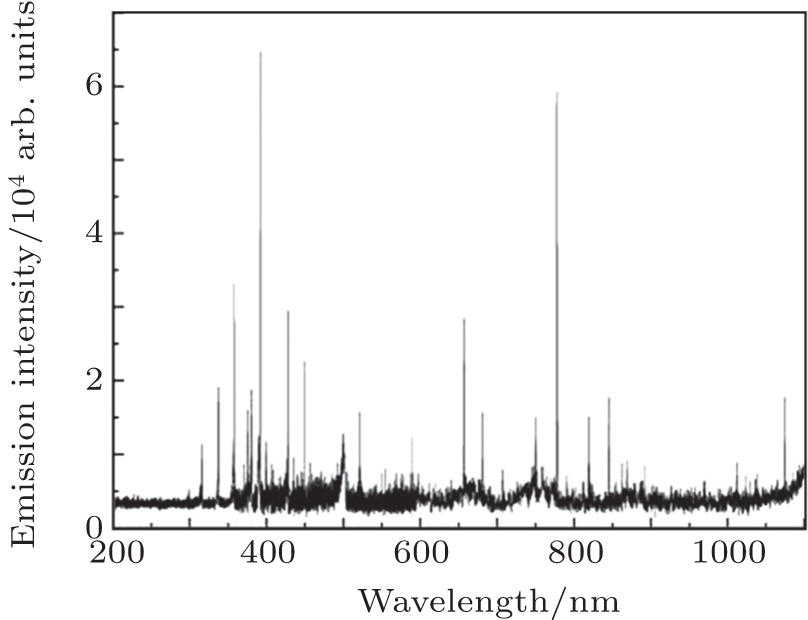 | Fig. 6. Emission spectrum of pin–pin electrode RF discharge at 1000 Pa. |
The emission spectrum between 300 nm and 450 nm is analyzed, as shown in Fig. 
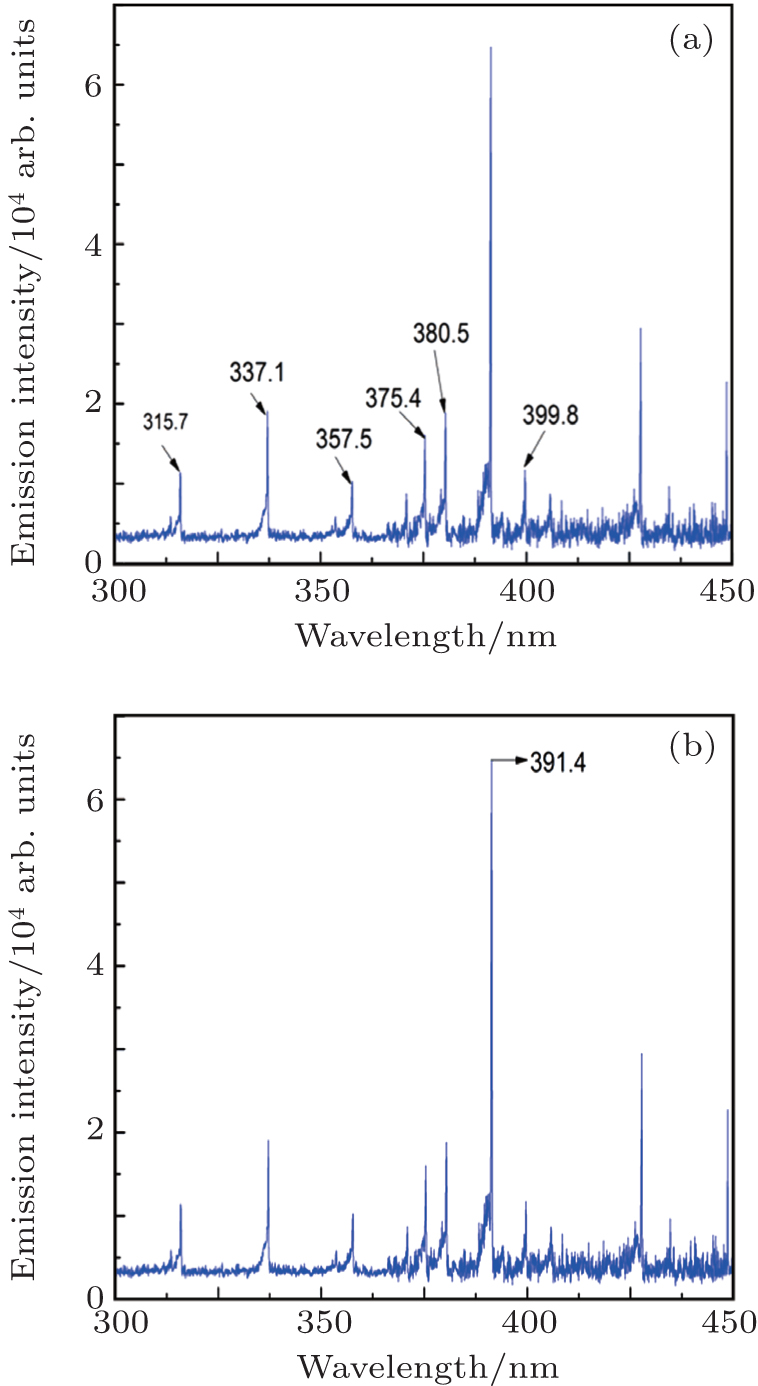 | Fig. 7. Emission spectrum of (a) N2(C3Πu) and (b)  |
Suppose that the electrons follow Maxwell distribution, the electron temperature can be adopted to feature the energy distribution of electrons (about two thirds of the average kinetic energy of electron).[22–24] Similarly, for Maxwell distribution, the equivalent electron temperature can also be defined with average energy. In plasma, the excited molecules, ions, and active particles are created by the collision of electrons at different energy levels, such as the increase of average molecular velocity, the vibrational and rotational excitation of molecule, the dissociation and ionization of molecule. Therefore, the emission spectrum generated during the return of molecules from excited state to the ground state must be closely related to electron temperature.
Because the rotational energy levels are closely spaced and allow for rapid energy transfer between the two energy modes, the gas temperature is estimated by the rotational temperature of a molecular. Through fitting the N2 second positive system band from 378 nm to 381 nm, the rotational temperature of N2 can be obtained.[24] Under a given rotational temperature (500 K), with the dipole radiation probability and response function of the monochrometer, the profile of a certain emission band is acquired. The actual rotational temperature (Tr) is determined through comparing the experimental measurement and theoretical calculation.[24] When the operating pressure is 1000 Pa, the rotational temperature is calculated to be 500 K.
As the gas temperature changes from 300–1000 K, and the electron temperature alters from 1 eV to 4 eV, through solving the equation and acquiring the stationary solution (dn/dt = 0), the relationship between electron temperature and intensity rate of two spectral lines can be fitted and written as an empirical equation,


When it comes to the spectrum in Fig.
Electron density (plasma density) is one of the important physical parameters which describes the characteristics of discharge plasma. To some degree, it could represent the ions which participate in the momentum transfer.[22–24]
According to the balance equation of N2(C) and 

The relative density of ground state N2 at different vibrational level is mainly depending on the electron density. Based on Frank–Condon principle, the distribution change of ground-state vibrational level can be reflected by the distribution of C state vibrational level.
As the temperature varies from 300 K to 1000 K, and the electron ionization rate temperature alters from 10−10 to 10−5, through solving the equation and acquiring the stationary solution (dn/dt = 0), the relationship between electron density and intensity rate of two spectral lines can be fitted and written as an empirical equation,


For the spectrum shown in Fig.
The intensity of molecule vibrational excitation is represented as vibrational temperature Tv, which is one of the important parameters of plasma[22–24]


It is believed that vibrational excitation is one of the important aspects of electron energy loss. For one thing, the collision cross section is big; for another, the electron is at lower energy state, and the excitation state is weaker.
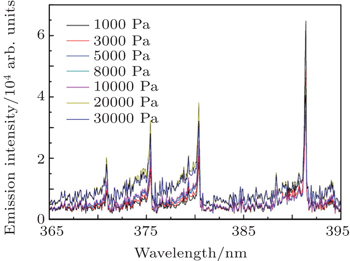
With the RF generator output power of 20 W, the influence of operating pressure (1000–30000 Pa) on RF discharge plasma is investigated. Optical emission spectrum under various pressures is shown in Fig.
 | Fig. 8. Optical emission spectrogram under varying pressures (365–395 nm). |
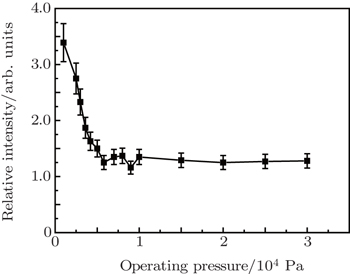
Relative intensity ratio from 391.4 nm to 380.5 nm 


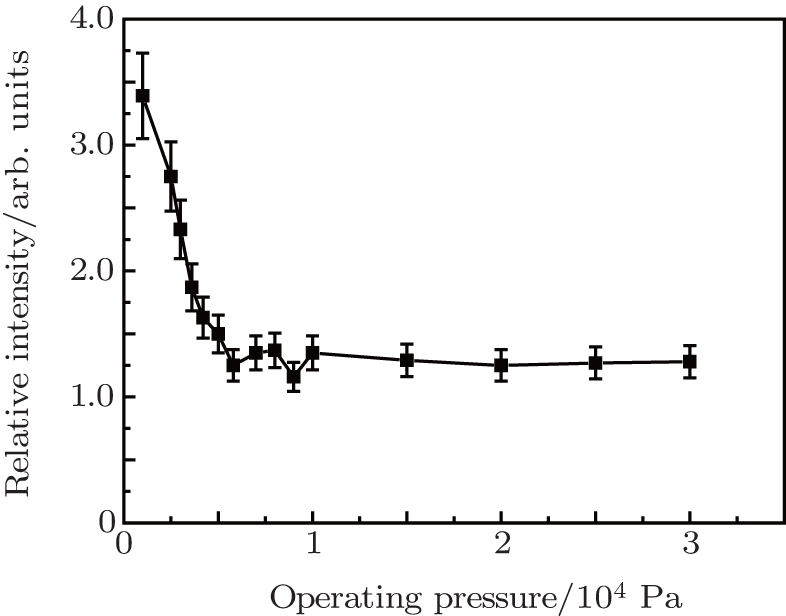 | Fig. 9. Relative intensity ratio from 391.4 nm to 380.5 nm  |
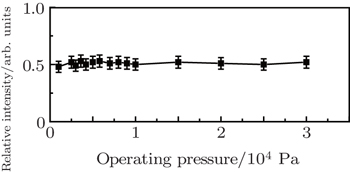
Relative intensity ratio of 371.1 nm to 380.5 nm 
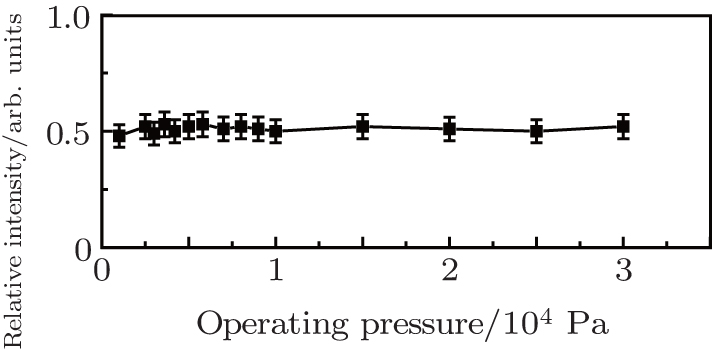 | Fig. 10. Relative intensity ratio from 371.1 nm to 380.5 nm  |
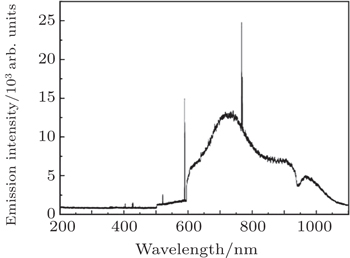
When the operating pressure is 96000 Pa and PL is 100 W, the optical emission spectrogram of RF discharge is shown in Fig.
 | Fig. 11. Optical emission spectrogram with the operating pressure of 96000 Pa. |
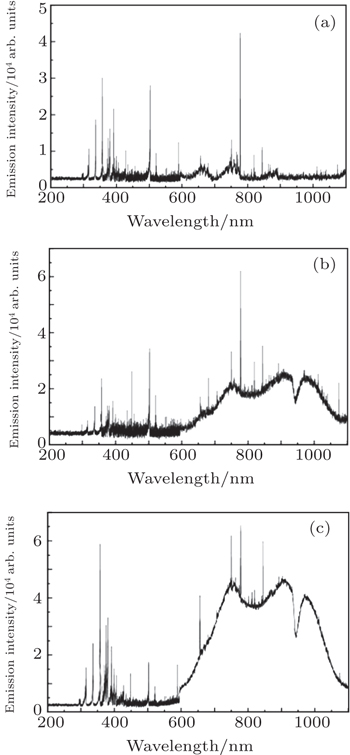
The influence of loaded power on RF discharge plasma was investigated when the operating pressure is fixed at 10000 Pa. Figure
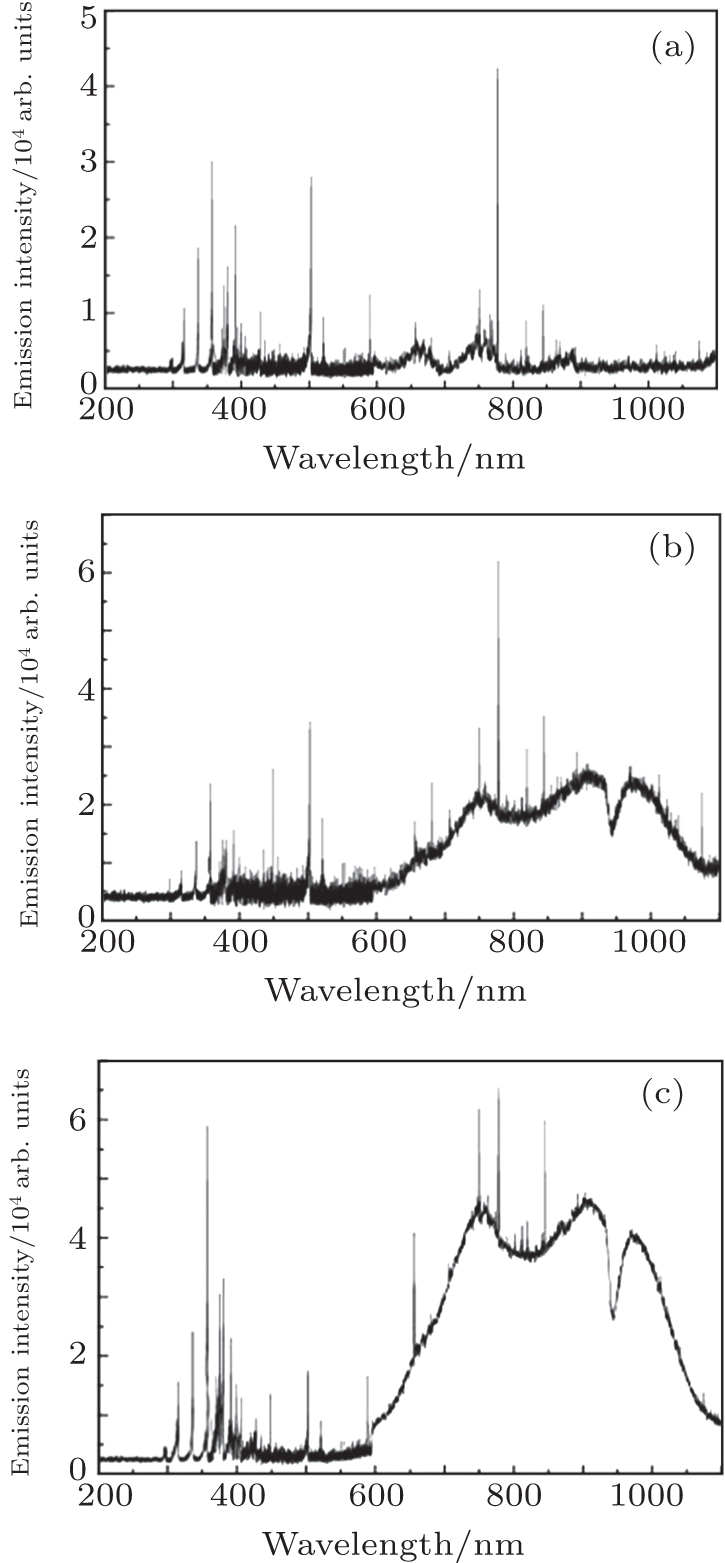 | Fig. 12. Optical emission spectrogram with the operating pressure of 10000 Pa. (a) PL = 14 W, exposure time is 1000 ms; (b) PL = 23 W, exposure time is 1000 ms; (c) PL = 33 W, exposure time is 500 ms. |
According to Planck’s law, the spectral radiant exitance of blackbody can be written as
It can be deduced from Eq. (
The discharge temperature between pin–pin electrodes is not uniform, but obeys certain temperature distribution, so the emission spectrum is not a standard Planck line. However, the increase of optical emission intensity still indicates a rise of both maximum temperature and average temperature. Furthermore, the optical emission spectrogram of RF discharge at higher loaded power is more similar to that of carbon arc (see Figs. 4–26 in Ref. [25]). It can be concluded that as loaded power increases, the discharge is more similar to arc discharge, and the gas temperature increases obviously.
The electric and plasma characteristics of RF discharge plasma actuation under varying pressure were investigated experimentally.
Future work should focus on the interaction between RF discharge plasma actuation and high speed flow. Small-scaled supersonic wind tunnel test should be conducted to verify the effectiveness of RF discharge plasma actuation on shock wave control.
| 1 | |
| 2 | |
| 3 | |
| 4 | |
| 5 | |
| 6 | |
| 7 | |
| 8 | |
| 9 | |
| 10 | |
| 11 | |
| 12 | |
| 13 | |
| 14 | |
| 15 | |
| 16 | |
| 17 | |
| 18 | |
| 19 | |
| 20 | |
| 21 | |
| 22 | |
| 23 | |
| 24 | |
| 25 |