Electromagnetically induced transparency in a Zeeman-sublevels Λ-system of cold 87Rb atoms in free space
Jiang Xiaojun1, 2, Zhang Haichao1, Wang Yuzhu1, †,
Key Laboratory for Quantum Optics and Center for Cold Atom Physics of Chinese Academy of Sciences, Shanghai Institute of Optics and Fine Mechanics, Chinese Academy of Sciences, Shanghai 201800, China
University of Chinese Academy of Sciences, Beijing 100049, China


† Corresponding author. E-mail: yzwang@mail.shcnc.ac.cn

Project supported by the National Basic Research Program of China (Grant No. 2011CB921504) and the National Natural Science Foundation of China (Grant No. 91536107).

Abstract
Abstract

We report the experimental investigation of electromagnetically induced transparency (EIT) in a Zeeman-sublevels Λ-type system of cold 87Rb atoms in free space. We use the Zeeman substates of the hyperfine energy states 52S1/2, F = 2 and 52P3/2, F′ = 2 of 87Rb D2 line to form a Λ-type EIT scheme. The EIT signal is obtained by scanning the probe light over 1 MHz in 4 ms with an 80 MHz arbitrary waveform generator. More than 97% transparency and 100 kHz EIT window are observed. This EIT scheme is suited for an application of pulsed coherent storage atom clock (Yan B, et al. 2009 Phys. Rev. A 79 063820).

1. Introduction

Electromagnetically induced transparency (EIT) is a quantum coherence and interference phenomenon, in which the optical properties of atomic and molecular gases can be dramatically modified including a great enhancement of nonlinear susceptibility and very steep dispersion in the transparency window.[1] EIT is obtained by employing two coherent optical fields coupling two ground states of an atomic system to a common excited state. Since it was first theoretically proposed by Kocharovskaya et al.[2] in 1986 and experimentally demonstrated in a strontium vapor by Boller et al.[3] in 1991, there has been widespread interest in studying EIT phenomenon due to its fundamental interest and potential applications in quantum optics and atomic physics, such as slow light and memory,[411] atomic magnetometry,[1214] atomic clocks.[15,16] There are three types of EIT schemes, known as Λ-type, Ladder-type,[17,18] and V-type,[19] which have been studied in various media including hot atoms in vapor cells, laser-cooled atoms,[20] Bose–Einstein condensate,[21] and plasma.[22] Experimental studies of EIT are mainly carried out in the Λ-system due to the long-lived coherence between two ground states. Compared with the hot atoms in vapor cells, the cold atoms are an attractive medium to study the EIT effect as the Doppler broadening effect is eliminated and the collisional dephasing rate is effectively reduced.[23,24]

Most EIT experiments have been investigated in hyperfine energy states of alkali atoms, and a few of the experiments have been carried out in Zeeman-sublevels system.[23,25,26] EIT in a certain Zeeman-sublevel system is especially useful for the application of frequency standards. Recently, a new theoretical scheme of obtaining Ramsey fringes based on EIT in Zeeman-sublevels has been proposed[27] by our team, which could eliminate the light shift and be immune to the laser noise. The scheme employs the Zeeman substates |F = 2, mF = 2〉 and |F = 2, mF = 0〉 of the ground state 52S1/2 of 87Rb D2 line serve as two ground states and |F′ = 2, mF = 1〉 of 52P3/2 serve as the excited state to form a Λ-type EIT scheme. The Ramsey fringes can be obtained by detecting the coherence of |F = 2, mF = 2〉 and |F = 2, mF = 0〉. In this paper, we report an experimental investigation of EIT in such a Zeeman-sublevels Λ-type system of cold 87Rb atoms in free space.

In Section 2, we briefly show the theoretical model used. In Section 3, our experimental setup and procedure are described. The experimental results are presented and discussed in Section 4.

2. Theory

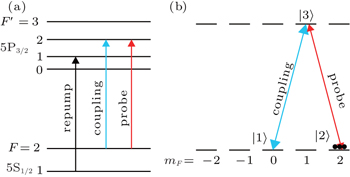
The schematic energy diagram of our experiment is shown in Fig. 1. When a small external magnetic field is applied, each of the hyperfine levels F are split into a series of 2F + 1 Zeeman substates. Both coupling and probe lights drive the |F = 2〉 → |F′ = 2〉 transition (see Fig. 1(a)). If the coupling and probe lights are strong σ+ and weak σ light, respectively, the population will be pumped into the Zeeman substate |F = 2, mF = 2〉 of the ground state 52S1/2. The multilevel system can be treated as an ideal closed three-level Λ-type system (see Fig. 1(b)). The Zeeman substates |F = 2, mF = 0〉 and |F = 2, mF = 2〉 of the ground state 52S1/2 serve as two ground states |1〉 and |2〉 of the Λ-type EIT system, respectively, while Zeeman substate |F′ = 2, mF = 1〉 of 52P3/2 serve as excited state |3〉. The strong coupling light drives |1〉 → |3〉 transition with a Rabi frequency Ωc and the weak probe light drives |2〉 → |3〉 transition with a Rabi frequency Ωp. To minimize the perturbation caused by repump light, it is locked on resonance with the transition from F = 1 → F′ = 1, which is far detuned from the frequency of coupling and probe lights (see Fig. 1(a)).

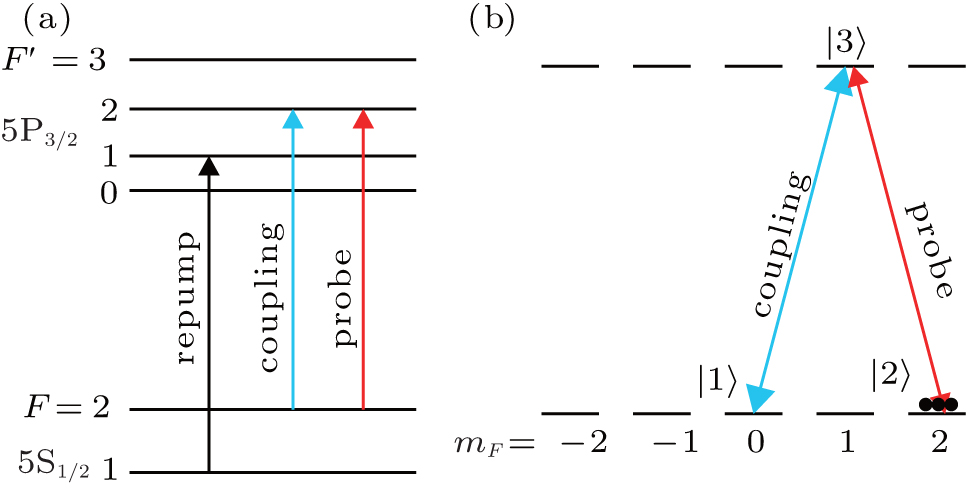
Fig. 1. The Zeeman states EIT scheme. (a) Relevant energy levels of the D2 line of 87Rb. Both the coupling and probe lights drive the |F = 2〉 → |F′ = 2〉 transition. The repumping light drives the |F = 1〉 → |F′ = 1〉 transition to minimize the perturbation to the EIT system. (b) When the coupling and probe lights are σ+ and σ lights, respectively, the multilevel system is reduced to an ideal closed three-level Λ-type system.

To understand the EIT phenomenon, one can solve the optical Bloch equation in the steady regime. With the rotating wave approximation, the time evolution of the density matrix elements are described as follows:[1,29]

where δ1, δ2 are the detunings of the coupling and probe lights, respectively; δR = δ2δ1 is the two-photon detuning; Γ0 is the spontaneous decay rate of excited states; γ12 is the relaxation rate of coherence between the two ground states |1〉 and |2〉, which is very small compared with Γ0; to simplify, we assume that the coupling light is on resonant (δ1 = 0, δR = δ2). The off-diagonal density-matrix element, σ23, can be acquired by solving Eqs. (1)–(3) in the steady regime, which is

where

The linear susceptibility can be written as

where n is the number density of cold atoms and μ23 is the transition electric dipole moment of the probe light. The probe absorption coefficient is proportional to the imaginary part of the linear susceptibility. From Eqs. (4)–(6), the imaginary part of the linear susceptibility is given by

From Eq. (7), it is seen that when the probe light is on resonant (δ2 = 0) and the decoherence rate can be ignored (γ12 = 0), Im[χ] is reduced to zero, which means the atom cloud becomes transparent to the probe light.

3. Experimental setup

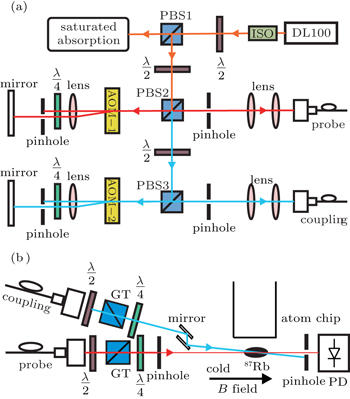
The setup of our experiment is shown in Fig. 2. The cold 87Rb atoms are collected by a mirror-MOT[30] in a vapor cell. The background pressure of the vapor cell is about 1 × 10⁻⁸ Pa. The magnetic fields are turned off after 8 s, and the cold atoms are further cooled through polarization gradient cooling for a time of 11 ms. Typically more than 2 × 10⁷ atoms with a temperature of about 20 μK and a Gaussian diameter of about 2 mm are captured. Once the polarization gradient cooling is completed, the trapping light is rapidly switched off by an acousto–optic modulator (AOM) and the repumping light is kept turn on. In the meantime, a bias magnetic field in the direction of the probe light is applied to generate Zeeman shifts.

Fig. 2. (a) The scheme to generate coupling and probe lights. DL100, diode laser; ISO, optical isolator; PBS, polarizing beam splitter; AOM, acousto–optic modulator. (b) The scheme of the experiment. The coupling and probe lights are converted into right-handed and left-handed circularly polarized lights, respectively, by two GlanTaylor polarizer (GT) and quarter-wave plates. A pinhole is used to reduce the diameter of the probe light. PD, photodiode.

Figure 2(a) shows the scheme of generating coupling and probe lights. Both the coupling and probe lights are generated by the same diode laser DL100 whose linewidth is about 1 MHz. The laser is locked to the 52S1/2, F = 2 → 52P3/2, F′ = 2,3 crossover transition of 87Rb D2 line using saturation spectroscopy technique and split into two lights by a PBS. Both of the lights are frequency shifted and gated using a double pass AOM setup. We use two arbitrary waveform generators (33250A 80 MHz, Agilent) to drive the AOM and control the frequency shift of the two lights. In a given magnetic field B, the frequencies of the AOM RF driver signals correspond to the resonance frequencies of the coupling and probe lights and can be given by[31]

where the unit for fc and fp is MHz and magnetic field B is Gauss. In order to ensure the coherence of the two lights, we connect the reference clock of the two arbitrary waveform generators to share a common clock signal to lock the phase of the two RF driver signals. Both of the lights are coupled into a single-mode fiber used as coupling and probe lights. With two GlanTaylor prisms employed as the polarizer and quarter-wave plates as shown in Fig. 2(b), both of the lights are converted into circularly polarized light but with different helicities. To facilitate the detection and improve the signal-to-noise (SNR) ratio of the EIT signal, the propagation directions of the two lights is not parallel but has a little angle. The angle is minimized to less than 2° with a pair of mirrors. The coupling light is in an elliptical shape with a 1/e diameter of 2 mm and a Rabi frequency of 3.67 MHz. The diameter of the probe light is reduced to 1 mm with a pinhole corresponding to a Rabi frequency of 0.26 MHz. The EIT signal is received by a photodiode. With a Keithley current amplifier, the photocurrent is converted into a voltage signal and then recorded by an oscilloscope.

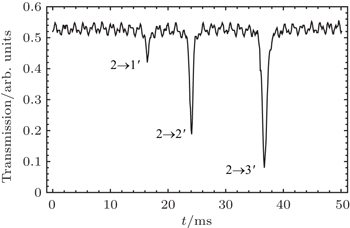
The diameters of the cold atom cloud and the probe light are very small. The direction of the probe light should be adjusted carefully to align with the center of the cold atoms. During the alignment process, we open the mirror-MOT and block the coupling light. The preliminary alignment is performed by a CMOS camera to adjust the direction of the probe light. Then the probe laser is scanned across the transition 52S1/2, F = 2 → 52P3/2, F′ = 1, 2, 3 using PZT of the DL100 to observe the transmission signal of the probe light for fine alignment. Figure 3 shows the transmission signal of the probe light. There are three absorption peaks corresponding to the transition |F = 2〉 → |F′ = 1〉, |F = 2〉 → |F′ = 2〉, and |F = 2〉 → |F′ = 3〉. The position of the MOT is adjusted by adjusting the current of the anti-Helmholtz coils to maximize the absorption peak of the transition |F = 2〉 → |F′ = 2〉. The coupling light is simply aligned by CMOS camera.

Fig. 3. The probe transmission signal in the MOT used for fine alignment of probe light. The coupling light is blocked and the laser is scanned across the transition 52S1/2, F = 2 → 52P3/2, F′ = 1, 2, 3 using PZT. The three absorption peaks correspond to the transition |F = 2〉 → |F′ = 1〉, |F = 2〉 → |F′ = 2〉, and |F = 2〉 → |F′ = 3〉. The absorption of the transition |F = 2〉 → |F′ = 2〉 used for EIT experiment is about 60%.
4. Results and discussion

The frequency of the coupling light is tuned to the fixed resonance frequency of the |52S1/2, F = 2, mF = 0〉 → |52P3/2, F′ = 2, mF = 1〉 transition. When the trapping light is shut down, the coupling light is first turned on to pump the cold atoms to the state |F = 2, mF = 2〉 for a time of 500 μs. Then the probe light is turned on and linearly scanned over 1 MHz for a time of 4 ms by scanning the frequency of the AOM RF driver signals using arbitrary waveform generator 33250A. The experimental results are shown in Figs. 4(a)4(d) for different magnetic fields. When the frequency of the probe light is near the resonance, there is a transparency window shown up in the probe transmission signal, known as EIT signal. It shows that the linewidth of the EIT signal decreases as the magnetic field increases. We observe that the absorption of the probe light is about 50% in the beginning of the scanning, and it is reduced over scanning time. The reason is that the optical depth of the cold atoms is reduced rapidly for the thermal expansion of the atom cloud in free space. Figure 4(e) shows the normalized probe absorption as the function of the probe detuning and the theoretical fit, where the magnetic field is 4 G. It shows that the linewidth of the EIT dip is about 100 kHz and there is more than 97% transparency of the probe light at the EIT center. The transparency depth is less than 100% because the relaxation rate of coherence between the two ground states γ12 is not zero. We can estimate the value of γ12 from the fit data in Fig. 4(e), which is about 1 kHz.

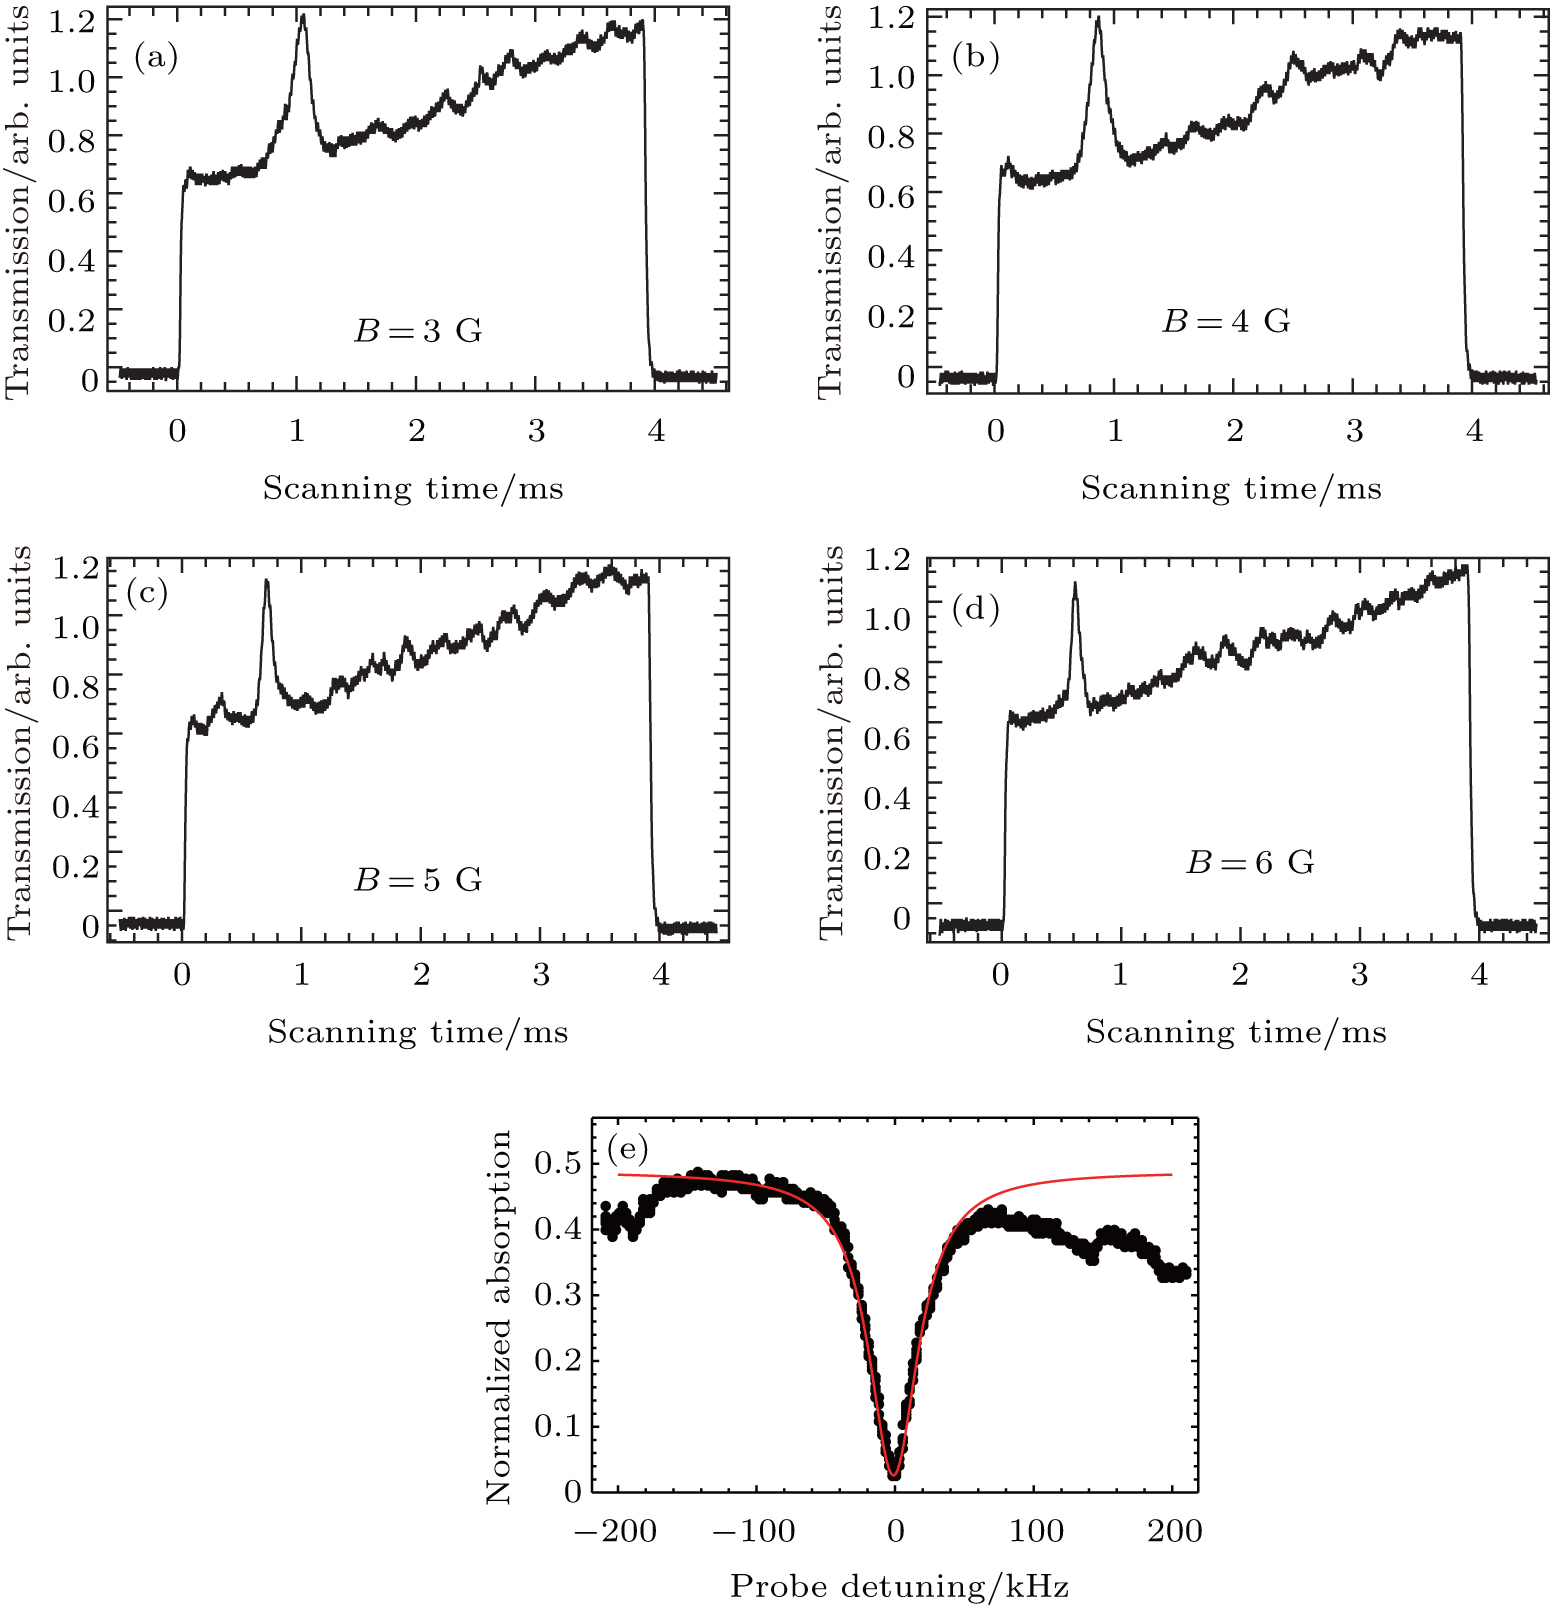
Fig. 4. (a)–(d) The EIT signals for different magnetic fields. In a given magnetic field, the coupling light is tuned to exact resonance with |F = 2, mF = 0〉 → |F′ = 2, mF = 1〉 transition. The probe light is scanned over 1 MHz for a time of 4 ms. (e) The normalized probe absorption as a function of the probe detuning. The black dots are the experimental data, and the red line is the theoretical fit. The linewidth is about 100 kHz, and the transparency depth is more than 97% and the γ12 is about 1 kHz.
5. Conclusion

In conclusion, we have reported an EIT experiment in the Zeeman-sublevels system of cold 87Rb atoms. The cold atoms are collected by a mirror-MOT. We use the same diode laser to generate coupling and probe lights and perform the EIT experiment under different external magnetic fields. The EIT signal is obtained by directly scanning the probe light over 1 MHz in 4 ms with an arbitrary waveform generator. The linewidth of the EIT signal is about 100 kHz and more than 97% transparency at the EIT center. The EIT signal can be used to measure the magnetic field and the relaxation rate of coherence between the Zeeman-sublevels. This EIT scheme offers the prospect of developing a pulsed coherent storage atom clock.

Reference
1Fleischhauer MImamoglu AMarangos J P 2005 Rev. Mod. Phys. 77 633
2Kocharovskaya O AKhanin Y I1986Sov. Phys. JETP63945
3Boller K JImamoglu AHarris S E 1991 Phys. Rev. Lett. 66 2593
4Hau L VHarris S EDutton ZBehroozi C H 1999 Nature 397 594
5Budker DKimball D FRochester S MYashchuk V V 1999 Phys. Rev. Lett. 83 1767
6Fleischhauer MLukin M D 2000 Phys. Rev. Lett. 84 5094
7Phillips D FFleischhauer AMair AWalsworth R LLukin M D 2001 Phys. Rev. Lett. 86 783
8Fleischhauer MLukin M D 2002 Phys. Rev. A 65 022314
9Gorshkov A VAndré AFleischhauer MSørensen A SLukin M D 2007 Phys. Rev. Lett. 98 123601
10Phillips N BGorshkov A VNovikova I 2008 Phys. Rev. A 78 023801
11Liu CDutton ZBehroozi C HHau L V 2001 Nature 409 490
12Fleischhauer MMatsko A BScully M O 2000 Phys. Rev. A 62 013808
13Katsoprinakis GPetrosyan D Kominis I K 2006 Phys. Rev. Lett. 97 230801
14Belfi JBevilacqua GBiancalana VCartaleva SDancheva YMoi L 2007 J Opt. Soc. Am. B 24 2357
15Knappe SShah VSchwindt P DHolberg LKitching JLiew L AMoreland J 2004 Appl. Phys. Lett. 85 1460
16Affolderbach CAndreeva CCartaleva SKaraulanov TMileti GSlavov D 2005 Appl. Phys. B 80 841
17Gea-Banacloche JLi Y QJin S ZXiao M 1995 Phys. Rev. A 51 576
18Chang R YFang W CHe Z SKe B CChen P NTsai C C 2007 Phys. Rev. A 76 053420
19Welch G RPadmabandu G GFry E SLukin M DNikonov D ESander FScully M OWeis ATittel F K 1998 Found. Phys. 28 621
20Yan MRickey E GZhu Y 2001 J. Opt. Soc. Am. B 18 1057
21Ahufinger VCorbaln RCataliotti FBurger SMinardi FFort C 2002 Opt. Commun. 211 159
22Ersfeld BJaroszynski D A 2001 Laser and Particle Beams 19 175
23Chen Y CLin C WYu I A 2000 Phys. Rev. A 61 053805
24Tiwari V BSingh SRawat H SManoranjan P SMehendale S C 2010 J. Phys. B: At. Mol. Opt. Phys. 43 095503
25Xiao FGuo R MChen SZhang YLi L MChen X Z 2003 Chin. Phys. Lett. 20 1257
26Nikolic S NDjokic VLucic N MKrmpot A JCuk S MRadonjic MJelenkovic B M 2012 Phys. Scr. 2012 T149
27Yan BMa Y SWang Y Z 2009 Phys. Rev. A 79 063820
28Fortágh JZimmermann C 2007 Rev. Mod. Phys. 79 235
29Li Y QXiao M 1995 Phys. Rev. A 51 R2703
30Reichel JHänsel WHänsch T W 1999 Phys. Rev. Lett. 83 3398
31Steck D A2003Rubidium 87 D Line Datahttp://steck.us/alkalidata