Theoretical studies on particle shape classification based on simultaneous small forward angle light scattering and aerodynamic sizing
Zhang Jin-Bi1, 2, †, , Ding Lei1, Wang Ying-Ping1, Zhang Li1, 2, Wu Jin-Lei1, 2, Zheng Hai-Yang1, Fang Li1
Laboratory of Environmental Spectroscopy, Anhui Institute of Optics and Fine Mechanics, Chinese Academy of Sciences, Hefei 230031, China
University of Chinese Academy of Sciences, Beijing 100049, China


† Corresponding author. E-mail: postgraduatezjb@126.com

Project supported by the National Natural Science Foundation of China (Grant No. 41275132).

Abstract
Abstract

Particle shape contributes to understanding the physical and chemical processes of the atmosphere and better ascertaining the origins and chemical compositions of the particles. The particle shape can be classified by the aspect ratio, which can be estimated through the asymmetry factor measured with angularly resolved light scattering. An experimental method of obtaining the asymmetry factor based on simultaneous small forward angle light scattering and aerodynamic size measurements is described briefly. The near forward scattering intensity signals of three detectors in the azimuthal angles at 120° offset are calculated using the methods of T-matrix and discrete dipole approximation. Prolate spheroid particles with different aspect ratios are used as the shape models with the assumption that the symmetry axis is parallel to the flow axis and perpendicular to the incident light. The relations between the asymmetry factor and the optical size and aerodynamic size at various equivalent sizes, refractive indices, and mass densities are discussed in this paper. The numerically calculated results indicate that an elongated particle may be classified at diameter larger than 1.0 μm, and may not be distinguished from a sphere at diameter less than 0.5 μm. It is estimated that the lowest detected aspect ratio is around 1.5:1 in consideration of the experimental errors.

1. Introduction

Airborne particles, either naturally occurring or man-made, play important roles in the climate effects, atmospheric physical and chemical processes, and human health.[13] When investigating the morphologies, concentrations, sources, and chemical compositions of airborne particles in order to estimate their health risks and climatic impacts, the particle shape and size are important parameters by which it is possible to differentiate or even identify some kinds of particles.

Optical scattering techniques,[4] which provide the ideal means of rapid, nondestructive, and in situ particle detection, are popular methods for classifying and possibly identifying airborne particle categories by the shape and size information that can be retrieved from the angular-resolved spatial scattering intensity or the two-dimensional angular optical scattering (TAOS) patterns of aerosol particles. For example, two-dimensional angular optical scattering patterns of nearly 6000 atmospheric aerosol particles were measured by Aptowicz et al. using a TAOS setup which collected polar scattering angles varying from approximately 75° to 135° and azimuthal angles varying from 0° to 360°.[5] Their experimental results demonstrated that single-particle measurements collected from an urban aerosol can be qualitatively classified into general shape categories.[6] Compared with the two-dimensional angular optical scattering system, a real-time high-speed monitoring system, which measured the scattering intensity signals from three miniature photomultiplier tubes placed at equally spaced intervals around the optical axis and a single forward photomultiplier tube, was developed by Kaye et al. earlier for detecting the shape and size characteristics of airborne particles.[7] The particle size characteristic was obtained through the summation of the scattering intensities of the four detector channels and the particle shape was related to the particle asymmetry derived from the response signals of three detector arrangements. 10000 particles were analyzed by Kaye’s instrument per second. Following the extraordinary speed advancement, a novel setup named WIBS-4[8] was designed for the biological aerosol detection by University of Hertfordshire in the United Kingdom, which combined spatial scattering light measuring with UV light-induced fluorescence. Although the development and testing of the WIBS-4 are continuous, its early measuring results[810] substantiate that the probable advantages of combining the measurements of shape, size, and intrinsic fluorescence in enhancing particle discrimination ability will be achieved.

Particle size information provided by the experimental apparatus mentioned above is the optical particle size. However, the optical diameter, which retrieves from the theoretical response of the detector channels to scattering from perfect homogeneous spheres of known refractive index, is dependent on the particle size, the refractive index, as well as the experimental system. What is worse, the optical diameter is obtained without considering the influence of the absolute intensity of the incident light so that the optical diameter has a strong uncertainty and poor comparability. It is a common phenomenon that the response curve has a multivalued characteristic, as the particle diameter and the refractive index increase.[11] The multivalued characteristic is scarcely eliminated exactly in elastic light scattering. Besides, the dispersion of scattering intensity belonging to the change of refractive index may result in a harmful effect on classifying particles according to the scattering intensity analysis.

In order to discriminate the morphological characteristics of particles better, an experimental device is proposed, which has the ability of measuring the angular-resolved scattering intensity and the aerodynamic size of a single airborne particle simultaneously. To my knowledge, such an instrument has not been developed so far. For the purpose of classifying airborne particles, the performance of combining spatial azimuthal scattering intensity with aerodynamic size is estimated theoretically in this study.

2. Calculation and analysis of simulated data
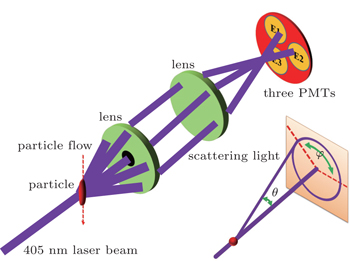
2.1. Calculation of scattering intensity

Many optical systems for measuring azimuthal scattering at a single polar angle have been developed at the University of Hertfordshire in the last twenty years.[1214] There are some optical designs to collect wide spatial angles’ scattering as well as low forward angles’ scattering. Comparing with the two kinds of designs, it is easier to detect the small forward scattering light intensity. For the purpose of application, we prefer collecting forward elastic scattering light. A part of the experimental instrument is shown in Fig. 1. When a single particle is delivered to the focus of the 405 nm laser, elastic scattering light from the particle can be detected in three photomultiplier tubes (PMTs) in a forward symmetric arrangement. The main receiving angle range is 5°–20°.

Fig. 1. Schematic structure of measuring forward scattering light.

When the light scattered through the aperture is collected by a photomultiplier tube, the magnitude E of the electrical signal is proportional to the partial light scattering cross section of the particle

where θ1 and θ2 represent the minimum and the maximum collected polar angles of light scattered in the spherical polar coordinate system (θ1 = 5°, θ2 = 20° in this case). The center of the PMT is located at the azimuthal angle φ0. For the three PMTs labeled as E2, E1, E3, we set φ0 as 0°, 120°, 240° respectively in the symmetric arrangement. Δφ is a function of the scattering polar angle θ[15]

S11(θ, φ) is an element of the scattering Mueller matrix,[16] which is given by

where I, Q,U, and V are the Stokes parameters, k is the wave number, k = 2π/λ, with λ being the wavelength 405 nm, r is the distance from the particle to the observer, and subscripts s and i refer to the scattered and the incident radiations, respectively. S11(θ, φ) will be computed by the T-matrix code[17] and the open-source ADDA code[18] in this paper. The Gauss–Legendre double quadrature is used for the numerical evaluation of Eq. (1) when S11 is computed by the T-matrix code. When S11 is computed by the ADDA code, the two-dimensional Romberg integration is used for the numerical evaluation of Eq. (1).

The Mueller matrix of a single nonspherical particle is principally a complex function of size, refractive index, shape, and orientation. However, Hirst et al. concluded that the sample airflow delivery system can aid alignment of elongated particles parallel to the flow direction.[19] In this way, all the scattering intensity data are calculated in the vertical orientation with respect to the axis of illumination for elongated particles.
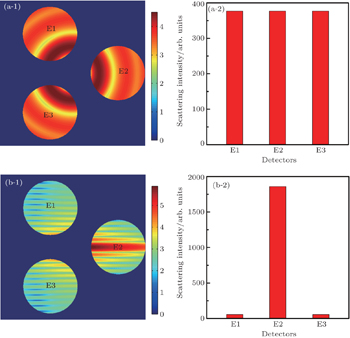
2.2. Particle shape analysis

We utilize an asymmetry factor (fa)[7] to retrieve the particle shape. It is one of the simplest methods of obtaining particle shape through light scattering pattern data. The principle of the calculation of fa is illustrated in Fig. 2. For spherical particles, such as an oleic acid particle, all the three azimuthal detectors should obtain equal scattering light intensities as indicated in Fig. 2(a). Instead, for high aspect ratio cylindrical particles, which incline to move parallel to the direction of the simple airflow, the responses of the three detectors are not quite the same. The horizontal detector E2 can receive predominant scattering light intensity specially as indicated in Fig. 2(b). For other nonspherical particles, the inequality degrees are between these two extremes in general. The simple expression for the calculation of fa is

where Ē is the mean of E1, E2, and E3, and k1 equals 40.8248 to render the maximum possible value of fa to be 100.

Fig. 2. Principle of the asymmetry factor calculation for (a) spherical and (b) long cylindrical particles.
2.3. The optical particle size inversion

The optical size (Dp) is an ascribed spherical equivalent size. For particle optical size determination, the instrument uses a calibration approach based on a curve which assumes that the particles are spherical and of a specific refractive index (Mie theory).[20] The scattering intensity data of polystyrene latex (PSL) microspheres with a refractive index 1.58 are used to obtain the calibration curve. A total of one hundred different sizes of PSL within the size range from 0.1 μm to 10 μm are introduced to the instrument for calibration. Figure 3 shows the relationship between the optical size and the theoretical response of a summation of the detector outputs E1 + E2 + E3. The fitted curve is used to retrieve the optical diameters of spherical and nonspherical particles based on the simulated scattering intensity in this paper.

Fig. 3. Optical size Dp against theoretical instrument response of a summation of the detector outputs E1 + E2 + E3.
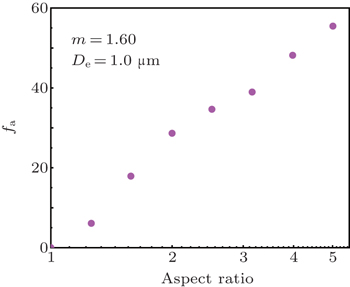
2.4. Conversion from volume-equivalent size to aerodynamic size

In order to obtain the aerodynamic sizes of airborne particles, the flight time of a single particle flowing between dual beams of the light of 650 nm wavelength is measured. This process is calibrated by the TSI APS 3321.[21] The aerodynamic diameter Da is related to the volume equivalent diameter De by the following equation:[22]

where ρp is the density of the aerosol particle, ρ0 is the unit density (ρ0 = 1.0 g/cm3), and χ is the dynamic shape factor. Other corrections such as the Cunningham slip factor are omitted in Eq. (5). The nonspherical dynamic shape factors can be computed by some theoretical equations or empirical equations. For instance, the dynamic shape factor of the prolate spheroid particle moving parallel to its axis of revolution can be calculated according to the following theoretical equation:[22,23]

where ψ is defined as the ratio of major to minor semi-axes of the prolate spheroid, also called the aspect ratio. The calculated results are shown in Fig. 4.

Fig. 4. Dynamic shape factor (fixed orientation) as a function of aspect ratio for the prolate spheroid.
3. Results
3.1. The relationship between aspect ratio and fa

The spheroidal models have a wide application of simulating the light scattering characteristics of mineral dust[24] and biological spores.[25] In order to study the relationship between the particle shape and fa, prolate spheroids with different aspect ratios are considered. Figure 5 shows the fa versus aspect ratio plot for a single prolate spheroid particle with refractive index 1.60 and spherical volume equivalent diameter 1.0 μm. With increasing aspect ratio, fa increases and has a linear relationship with the aspect ratio under the current calculation condition. The result shows that the fa data which can be retrieved with the scattering intensity in the small forward angle range from 5° to 20° provide some shape information of the particles.

Fig. 5. The fa versus aspect ratio for a prolate spheroid. The logarithmic range of aspect ratio from 0 to 0.7 with 7 intervals is considered. Refractive index 1.60 and spherical volume equivalent diameter 1.0 μm are used to calculate the scattering intensity.
3.2. The relation between fa and optical and aerodynamic sizes at certain aspect ratio

For a particle with known shape and aspect ratio, the measured fa could be quite different at different optical or aerodynamic size, since the physical size, the refractive index, and the mass density may vary among the particles. Here we present calculated results of a spheroidal particle with aspect ratio 2:1 at various physical parameters under current experimental configuration.

Figure 6 gives the relation between fa and optical size Dp at various refractive indices (1.3–2.6, spacing 0.1) and spherical volume equivalent sizes (0.5–3.0 μm, spacing 0.5). It can be seen that the fa of smaller particles (small red plus symbol) are smaller than those of larger particles. It is most likely that the particle shape cannot be identified when the diameter is less than 0.5 μm with a moderate aspect ratio. Because of the signal fluctuations and experimental errors, the measured fa of a perfect spherical particle is in the range of 0–10 (preliminary experimental results in preparation for publishing). The change of the refractive index leads to a wide spread of both fa and optical size at a given equivalent size. There is no obvious relation between fa and the optical size.

Fig. 6. Optical size Dp versus fa for a prolate spheroid with an aspect ratio 2:1 at different refractive indices and equivalent sizes. The T-matrix method is used to calculate the scattering intensity of particles.

Under the same circumstances, by considering different mass densities, the relation between fa and the aerodynamic size is shown in Fig. 7. Most of the fa values are larger than 20 while the aerodynamic diameters are greater than 1.0 μm except for some small refractive indices (hollow circle symbol) and large mass densities (small equivalent size). For middle-ranged refractive indices (1.73–2.17), the fa values are relatively large and concentrated, which means that the shape of particles with refractive index around 2 is more likely to be measured through fa.

Fig. 7. Aerodynamic size Da versus fa for a prolate spheroid with an aspect ratio 2:1 at different refractive indices, equivalent sizes, and mass densities. The calculation condition is the same as that in Fig. 6 except the mass density. The mass density is in units of g/cm3.

Since the aerodynamic size is close to the real physical size of a particle (proportional to the square root of mass density), the particle shape should be close to a sphere if a small fa is measured with an aerodynamic diameter greater than 1.0 μm and maybe nonsphere with an aerodynamic diameter less than 0.5 μm. On the other hand, the aerodynamic size may indicate the type of particle, which restricts the refractive index or mass density to some extent, and help identify its shape. For better classification of the particle shape with fa, the angularly resolved scattering system may be optimized focusing on small particles, e.g., particles of 0.5 μm diameter.

3.3. The effects of refractive index and size on particle shape classification

The effects of refractive index, equivalent diameter, and mass density on the shape classification of particles are discussed in this part. As shown in Fig.8, we compute four prolate spheroidal particles with aspect ratios of 1.26:1, 1.58:1, 2.0:1, and 2.51:1 by using the T-matrix method. For each shape, the equivalent diameter varies from 0.5 μm to 3.0 μm in steps of 0.5 μm, the refractive index changes from 1.3 to 2.6 with 13 intervals, and the mass density has values of 1.0 g/cm3, 2.0 g/cm3, and 3.0 g/cm3.

The results in Figs. 8(a) and 8(b) show that even with the help of the optical size or aerodynamic size, the wide distribution of fa affected by the different refractive indices, equivalent sizes, and densities makes a state of confusion so that obvious discrimination of various shape particles cannot be made. Generally speaking, larger aspect ratio is corresponding to larger fa, but with broader spread width. The particle shape may not be recognized with an aspect ratio less than around 1.2:1, since the fa values are around 10 even though the diameter is larger than 5 μm. Considering signal fluctuations and experimental errors, it is estimated that the smallest detectable aspect ratio is around 1.5:1 with fa being about 20 in actual measurements.

Fig. 8. The classification of prolate spheroids with four different aspect ratios under the condition that the particles of every shape have many different refractive indices, equivalent sizes, and mass densities. (a) Optical size Dp versus fa plot for the particle shape classification. (b) Aerodynamic size Da versus fa plot for the particle shape classification.
3.4. Simulated classification of some particle species

Generally, many aerosol types have some specific size and shape characteristics in the atmospheric environment. For example, the crystallized riboflavin has a fiber-like morphology with a typical aspect ratio of 8:1,[26] sodium chloride (NaCl) has a cubic shape, the shapes of mineral hematite particles are approximately prolate spheroid with a typical aspect ratio of 3:1,[27] and some bacterial aerosols[28] are prolate ellipsoidal in shape as well. Table 1 lists the parameters of these substances. Biological aerosols containing Bacillus subtil spores[2830] (B.subtilis) and Burkholderia pseudomallei[31] (B.pseudomallei) are considered in this paper. However, because sodium chloride does not have a fixed size distribution, the aerodynamic sizes of the sodium chloride particles from 1.5 μm to 2.5 μm are used to compute the scattering intensity. The scattering intensity of both B.subtilis and hematite is calculated by the T-matrix method. ADDA is utilized for another three particle types. The orientation of sodium chloride is arbitrary, but the orientation of the prolate spheroidal particle has a vertical orientation with respect to the axis of illumination. For each type particle, we choose randomly 20 values in the respective size range to plot Fig. 9.

Table 1.

Summary of the five aerosol types.

.
Fig. 9. The classification of five different aerosol types based on fa data and size information. (a) Optical size Dp versus fa plot for the particle type classification. (b) Aerodynamic size Da versus fa plot for the particle type classification.

Figure 9 shows the simulated result based on the data in Table 1. It is the classification of the five type particles using the optical size versus fa plot and the aerodynamic size versus fa plot. As shown in Fig. 9, the fa data of sodium chloride and B.subtilis are smaller than 30, the fa data of hematite are between 40 and 60, those of crystallized riboflavin are between 80 and 90, and they vary from 30 to 90 for the B.pseudomallei particles. The result suggests that it is better to distinguish nearly spherical particles and elongated particles using the fa information, such as the classification of B.subtilis and riboflavin. By combining with the particle size information, the shape discrimination capacity of fa can be enhanced for classifying different type particles with the same fa range, such as sodium chloride and B.subtilis. In addition, comparing Figs. 9(a) and 9(b), we find an advantage for the differentiation of hematite and B.pseudomallei particles in terms of aerodynamic size and fa data since the aerodynamic size has nothing to do with the refractive index. The results in Fig. 9 suggest that our experimental device simultaneously measuring the particle aerodynamic size and the spatial scattering intensity at small forward angles from 5° to 20° has a potential capability of classifying or identifying some types of particles rapidly.

4. Conclusion

A method of measuring shape and size of individual particles by three detectors in the forward scattering polar angle range of 5°–20° and azimuthal angles at 120° offset is described. The responding characteristics of the detectors are calculated using methods of T-matrix and DDA at various physical parameters of a particle, such as optical size, aerodynamic size, equivalent size, refractive index, and mass density. Given some degree of control over the particle orientation in the sample airflow delivery system, just an ideal fixed orientation of the elongated particle is considered. The aspect ratio of an elongated particle can be estimated through three signal intensities, which are used to calculate the asymmetry factor. The relation between the aspect ratio and the asymmetry factor is determined by many parameters.

The calculation results indicate that elongated particles may be distinguished from spherical ones at diameter larger than 1.0 μm, and may not be distinguished from a sphere at diameter less than 0.5 μm. It is estimated that the lowest detected aspect ratio is around 1.5:1 in consideration of the experimental errors.

The aerodynamic size may help identifying the shape since a larger particle presents a fairly larger asymmetry factor related to the aspect ratio. For better classifying particle shape with fa, the angularly resolved scattering system may be optimized focusing on small particles, e.g., particles of 0.5 μm diameter.

Shape and size measurements at single particle level are useful for discriminating biological aerosols in ambient environment.[810] It is feasible to combine fluorescence signatures with spatial scattering intensity using one 405 nm laser and to develop a new biological aerosol monitoring apparatus.

Reference
1Valavanidis AFlotakis KVlachogianni T 2008 J. Environ. Sci. Health Pt. C-Environ. Carcinog. Ecotoxicol. Rev. 26 339
2Durant A JHarrison S PWatson I MBalkanski Y 2009 Prog. Phys. Geogr. 33 80
3Després V RHuffman J ABurrows S MHoose CSafatov A SBuryak GFröhlich-nowoisky JElbert WAndreae M OPöschl UJaenicke R 2012 Tellus Ser. B-Chem. Phys. Meteorol. 64 15598
4Hoekstra AMaltsev VVideen G2007Optics of Biological ParticlesDordrechtSpringerpp. 31–61
5Aptowicz K BPinnick R GHill S CPan Y LChang R K 2006 J. Geophys. Res. 111 D12212
6Berg M JHill S CPan Y LVideen G 2010 Opt. Express 18 23343
7Kaye P HAlexander-Buckley KHirst ESaunders SClark J M 1996 J. Geophys. Res. 101 19215
8Healy D AO’Connor D JBurke A MSodeau J R 2012 Atmos. Environ. 60 534
9O’Connor D JHealy D AHellebust SButers J T MSodeau J R 2014 Aerosol Sci. Technol. 48 341
10Toprak ESchnaiter M 2013 Atmos. Chem. Phys. 13 225
11Szymanski W WNagy ACzitrovszky A 2009 J. Quant. Spectrosc. Radiat. Transf. 110 918
12Hirst EKaye P H 1996 J. Geophys. Res. 101 19231
13Kaye PHirst EWang-Thomas Z 1997 Appl. Opt. 36 6149
14Hirst EKaye P HGreenaway R SField PJohnson D W 2001 Atmos. Environ. 35 33
15Zhang J BDing LWang Y PZheng H YFang L 2015 Acta Phys. Sin. 64 054202 (in Chinese)
16Bohren C FHuffman D R1983Absorption and Scattering of Light by Small ParticlesNew YorkWileyp. 65
17www.giss.nasa.gov/staff/mmishchenko/t_matrix.html [2015-06-19]
18Yurkin M AHoekstra A Ghttp://a-dda.googlecode.com/svn/tags/rel_1.2/doc/maual.pdf
19Hirst EKaye P HBuckley K MSaunders S J 1995 Part. Part. Syst. Charact. 12 3
20Healy D AO’Connor D JSodeau J R 2012 J. Aerosol. Sci. 47 94
21http://www.tsi.com/aerodynamic-particle-sizer-spectrometer-3321 [2015-06-19]
22DeCarlo P FSlowik J GWorsnop D RDavidovits PJimenez J L 2004 Aerosol Sci. Technol. 38 1185
23Dahneke B E 1973 J. Aerosol. Sci. 4 139
24Merikallio SLindqvist HNousiainen TKahnert M 2011 Atmos. Chem. Phys. 11 5347
25Hahn D VLimsui DJoseph R IBaldwin K CBoggs N TCarr A KCarter C CHan T SThomas M E 2008 Proc. SPIE 6954 69540W-1
26Pan Y LAptowicz K BChang R K 2003 Opt. Lett. 28 589
27Kaye P HBarton J EHirst EClark J M 2000 Appl. Opt. 39 3738
28Carrera MZandomeni R OFitzgibbon JSagripanti J L2007J. Appl. Microbiol.102303
29Carrera MZandomeni R OSagripanti J L 2008 J. Appl. Microbiol. 105 68
30Tuminello P SArakawa E TKhare B NWrobel J MQuerry M RMilham M E 1997 Appl. Opt. 36 2818
31Sagripanti J LCarrera MRobertson JLevy AInglis T J J 2011 Arch. Microbiol. 193 69