


Accurate prediction of interference minima in linear molecular harmonic spectra by a modified two-center model
[Cui Xin1, 2, Zhang Di-Yu1, 2, Chen Gao3, Chen Ji-Gen4, Zeng Si-Liang5, Guo Fu-Ming1, 2, †,  , Yang Yu-Jun1, 2]
, Yang Yu-Jun1, 2]
|
|

 , Yang Yu-Jun1, 2
† Corresponding author. E-mail:
Project supported by the National Basic Research Program of China (Grant No. 2013CB922200) and the National Natural Science Foundation of China (Grant Nos. 11274001, 11274141, 11304116, 11247024, and 11034003), and the Jilin Provincial Research Foundation for Basic Research, China (Grant Nos. 20130101012JC and 20140101168JC).
We demonstrate that the interference minima in the linear molecular harmonic spectra can be accurately predicted by a modified two-center model. Based on systematically investigating the interference minima in the linear molecular harmonic spectra by the strong-field approximation (SFA), it is found that the locations of the harmonic minima are related not only to the nuclear distance between the two main atoms contributing to the harmonic generation, but also to the symmetry of the molecular orbital. Therefore, we modify the initial phase difference between the double wave sources in the two-center model, and predict the harmonic minimum positions consistent with those simulated by SFA.
Atoms, molecules, and clusters irradiated by a strong laser pulse of long wavelength can emit a coherent radiation at the frequency of integer multiples of that of the incident laser pulse.[1–3] Such radiation is called high-order harmonic generation (HHG), and the mechanism of the atomic HHG can be well explained by a semi-classical three-step model,[4] i.e., the bound electron firstly tunnels out through the barrier formed by the Coulomb potential and the laser field, then the ionized electron oscillates in the external field, and it has the possibility to recombine with its parent ion and finally emits a high-energy photon.
The high-order harmonic from molecules carries information about the molecular structure, so it can be used to realize the tomography of molecular orbitals,[5] and this offers an opportunity to achieve ultrafast real-time imaging of the electron orbitals in a molecule. In order to reach this goal, the study on structural features of molecular harmonics and their relation with molecular electron orbitals becomes the current central issue. For the molecular system, the ionized electron may recombine with different ions, the harmonics from which may interfere with each other, thus leading to the minimum or maximum in the molecular harmonic spectra. Lein et al. firstly theoretically investigated this interference phenomenon, and found that the harmonic efficiencies in H2 and 
As for the experimentally measured harmonic spectra, the position of the harmonic interference minimum is mainly decided by the geometry structure of the molecule and the most contributive molecule orbital occupied with harmonic emission. Meanwhile, the orientation degree of molecules[10,11] and the multi-path interference[12] also have effects on the harmonic interference minimum during harmonic emission. In the theoretical study of this paper, we just consider the influence on the harmonic interference minimum for the ideally orientated molecule with specially occupied orbital selected. Certainly, for the correspondence with the experimental results, the hexapole method could be adopted to perform the state selection and improve the orientation degree of the molecules. As for theory, considering the condition of the specific molecule orientation degree and performing coherent superposition of harmonics from molecules with different orientations can also get results corresponding to experiments. In addition, we choose driven laser pulses with a relatively long wavelength and low intensity to make sure that a certain molecular orbital has obvious ionization and contributes the most to the harmonic emission, so the influences of low molecule orientation degree and multi-path interference on the harmonic interference minimum are reduced. However, for some molecules such as nitrogen, the harmonic spectrum minima predicted by the two-center model are different from those of the quantum results.[13–15] In addition, this model cannot explain the multi-orbital contribution to the molecular HHG observed in the experiment.[12] Despite the recent significant progress in HHG from molecules, the harmonic interference from different molecular orbitals remains an open question. Recently, Zhu et al. explained the interference minimum in the harmonic spectrum of the heteronuclear diatomic molecule by performing a phase analysis.[16] In this paper, we develop the two-center model by modifying the initial phase difference between the double wave sources, and predict the interference minima in the HHG spectra of the linear molecules, which are well consistent with those from the strong-field approximation (SFA) calculation.[17–19]
Considering each electron’s contribution to the harmonic generation from the multi-electron molecules, we investigate the molecular HHG by SFA. In the length gauge and the electric dipole approximation, the time-dependent dipole moment of the system is (the atomic units are used throughout the text unless otherwise specified)


Firstly, we study the HHG from linear molecules nitrogen (N2), acetylene (C2H2), and carbon monoxide (CO) irradiated by a linear polarized laser pulse. Here, the laser electric field is
 | Fig. 1. Harmonic emission spectra from different initial molecular orbitals: (a) HOMO of N2, (b) HOMO-1 of N2, (c) HOMO of C2H2, (d) HOMO-1 of C2H2, (e) HOMO of CO, and (f) HOMO-1 of CO. The white solid lines are the minimum positions from the two-center model. |
According to the two-center model, the position of the interference minimum only depends on the nuclear distance and is not related to the initial shape of the molecular orbital. However, for the harmonic spectra from different initial orbitals of the same molecule, it is found that the minimal value distributions are not the same, as depicted by Fig.
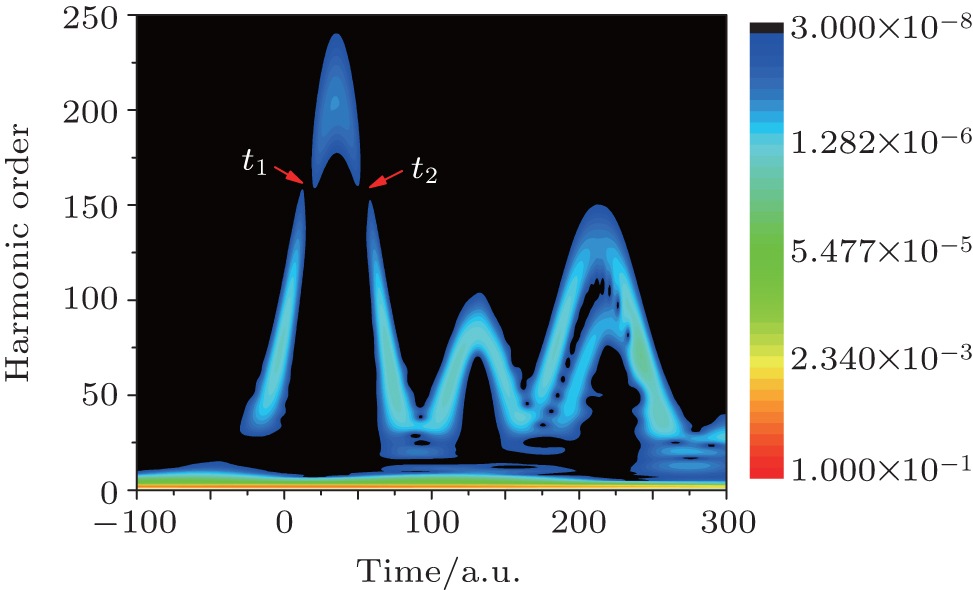 | Fig. 2. The frequency analysis of the total dipole moment of the HOMO orbital of N2. The red arrows indicate the positions of the destructive interference. |
In order to clarify the disagreement in the dip structures between the two-center model and the SFA, we further investigate the harmonic emission from different atoms in the diatomic molecule. According to the SFA, the high-order harmonic structure depends on the transition dipole moments between the continuous state and the initial state. One can express the molecular orbital as the linear combination of atomic orbitals ψ0 (


Then, we can calculate the dipole moment D22(t) originated from the ionized electron from core (center) 2 recombining with core 2, and D21(t) originated from the ionized electron from core 2 recombining with core 1. The time-dependent dipole moment Dall(t) can be obtained from the coherent superposition of D21(t) and D22(t). In the period t1 ≈ 14–17, the amplitude of the electric field is positive, thus the potential that locates near core 2 is suppressed. The ionization from core 1 is difficult because it needs to overcome an additional potential barrier in the middle of the two cores. Thus the ionization from core 2 is dominant. Therefore, the time-dependent dipole moment Dall(t) can be taken as the whole dipole moment from N2. Figures
 | Fig. 3. The variation of the dipole moments D22(t), D21(t), and Dall(t) with time in the durations of (a) 0–24 and (b) 42–60. The periods of the destructive interference are shown in the pink shadow boxes. |
What causes the π phase difference between the two dipole moments D22(t) and D21(t)? To figure it out, we further consider the case of the electronic wave packet with the harmonic frequency 154 returning to the two N atoms, and find that the corresponding phase difference equals to 2π. It means that the phase difference π between D22(t) and D21(t) only originates from the two atoms as the interference centers, i.e., the initial two atomic wave functions of the N2 HOMO orbitals exist in the phase difference π. It can also be seen from the HOMO orbital and two N atomic wave functions, as depicted in Fig.
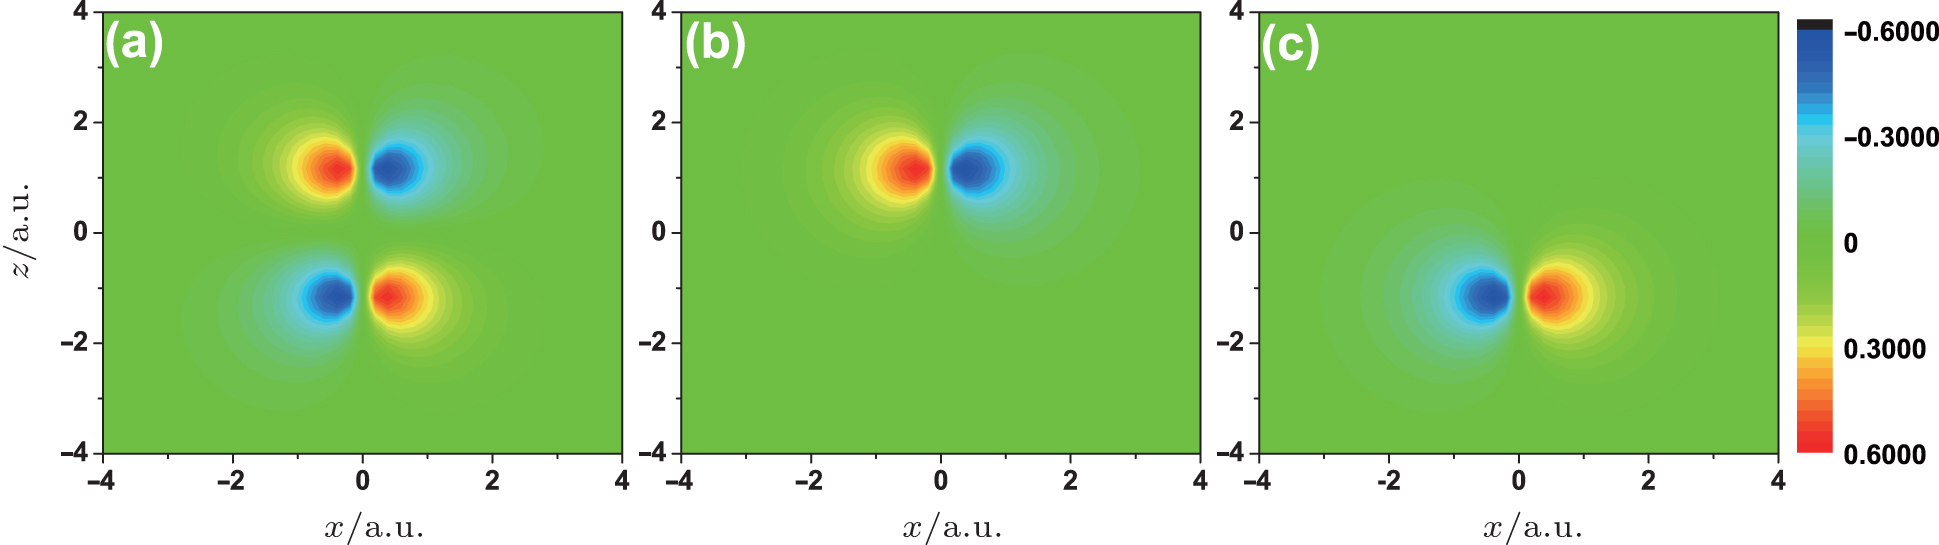
 | Fig. 4. The orbital wave functions of (a) ψN2, (b) ψ1N, and (c) ψ2N. |
In order to confirm this conclusion, we analyze the interference minima in the HHG spectra from other linear molecular orbitals. Figure
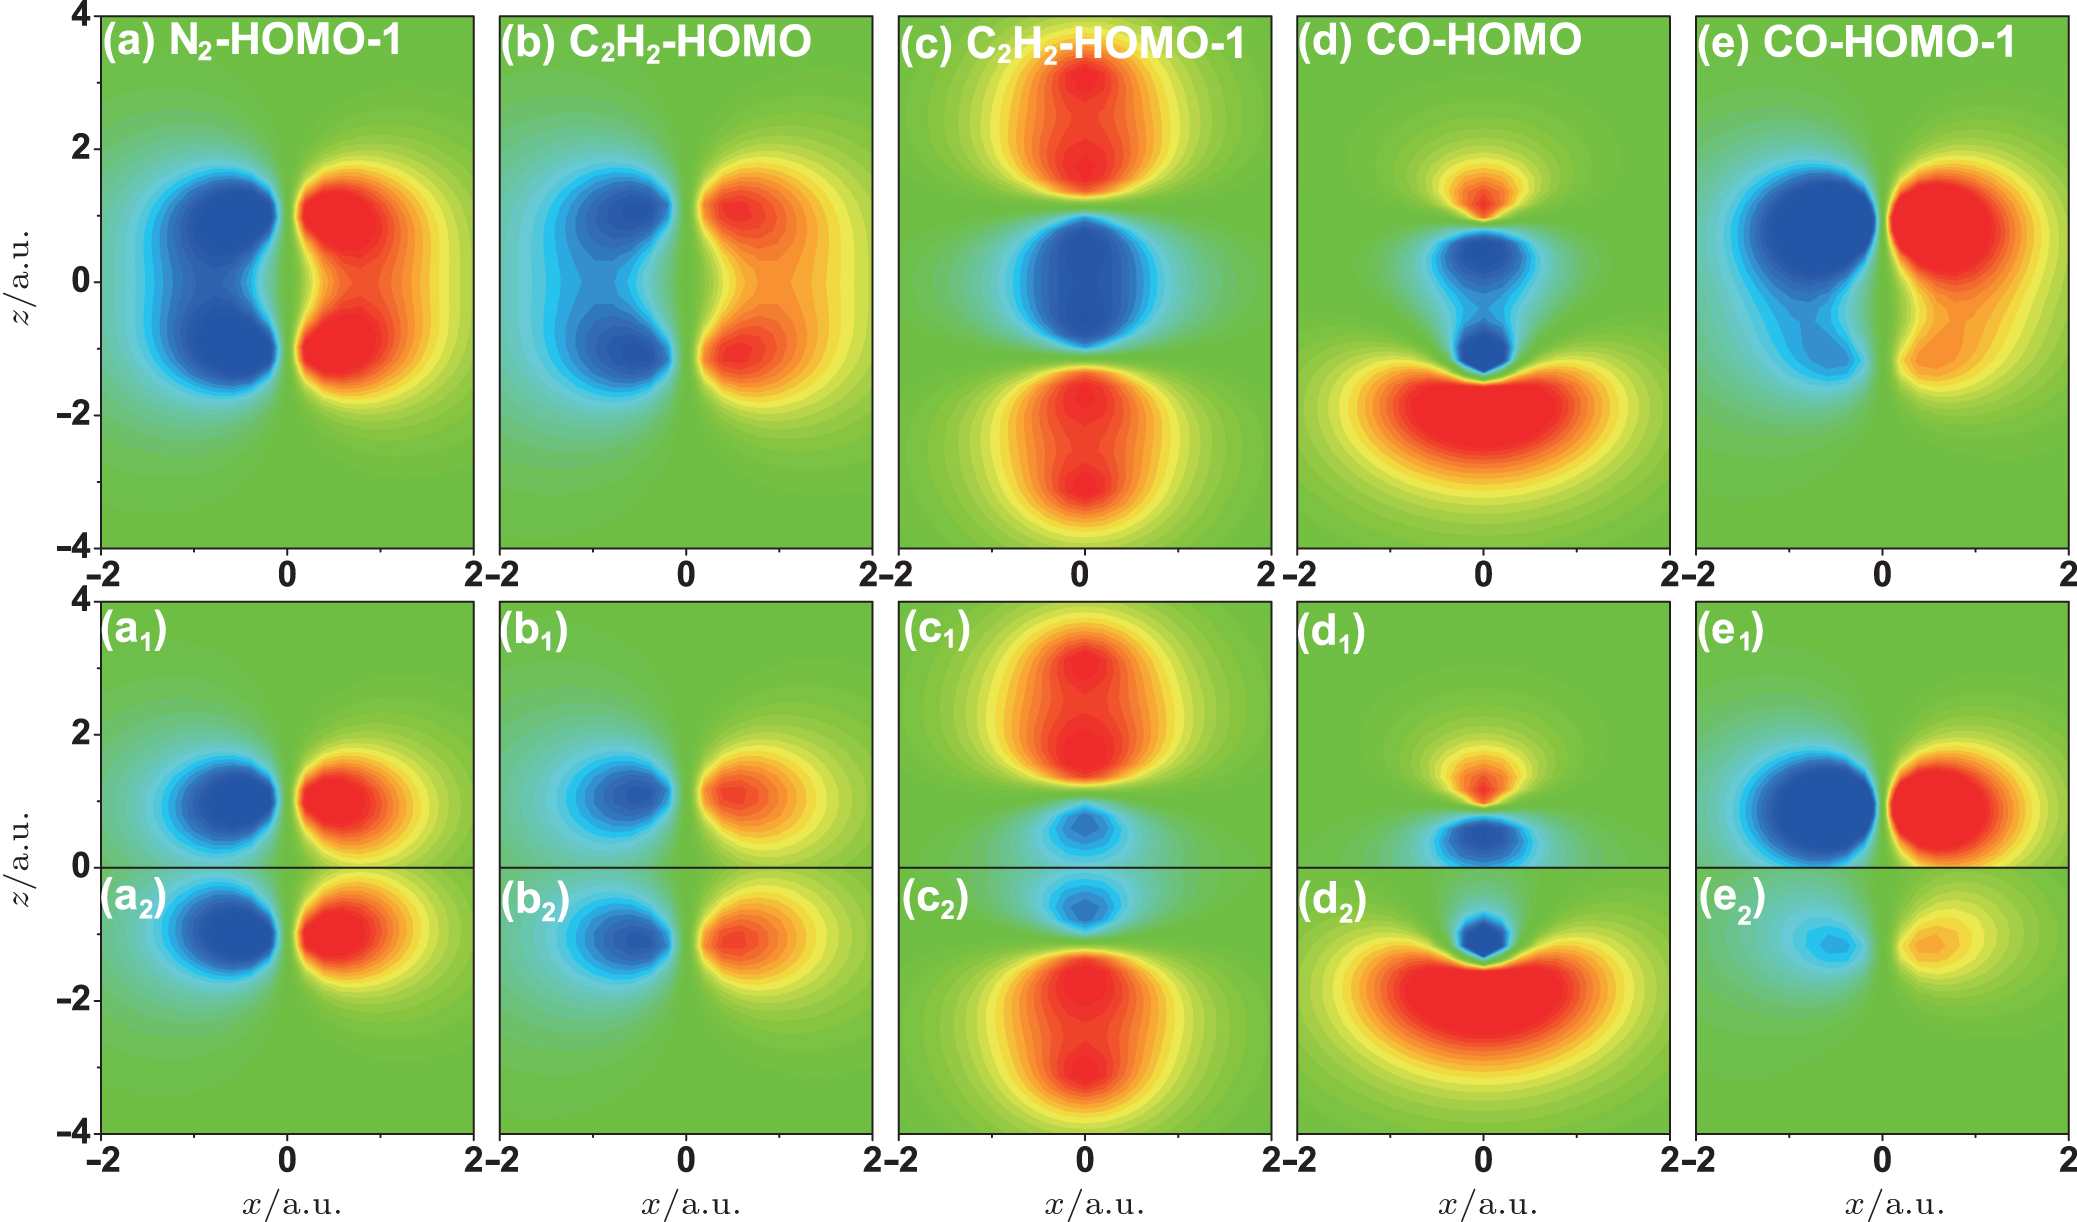 | Fig. 5. The wave functions of (a) N2 HOMO-1, (b) C2H2 HOMO, (c) C2H2 HOMO-1, (d) CO HOMO, and (e) CO HOMO-1 orbitals. The low panels show the wave functions of the corresponding two-center orbitals. |
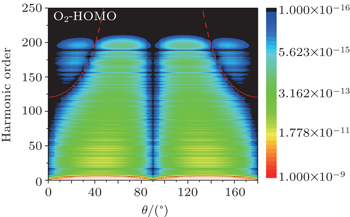
The improved two-center model also works well for the anti-bonding orbitals of the linear molecules. Here, we take the O2 HOMO orbital as an example. Figure
 | Fig. 6. Wave functions of (a) ψO2, (b) ψ1O, and (c) ψ2O. |
 | Fig. 7. The variation of harmonic emission spectra from the HOMO orbital of O2 molecule as a function of θ. The red dotted line is the interference minimum obtained by using the improved two-center model. |
We investigated the interference minima in the HHG spectra from linear molecules. It is found that the position of the interference minimum is related not only to the nuclear distance between the two main atoms contributing to HHG, but also to the symmetry of the molecular orbital. Hence, the two-center model is reasonably modified by considering the initial phase difference between the double wave sources. The phase differences for the σ and π orbitals can be set as π and zero, respectively. For the anti-bonding orbital, the initial phase difference should be added π compared to that of the bonding orbital. After amending the initial phase difference, the interference minima predicted by the two-center model are in agreement with the results from SFA. Therefore, the modified two-center model can be applied to examine the linear molecular HHG in experiments.
| 1 | |
| 2 | |
| 3 | |
| 4 | |
| 5 | |
| 6 | |
| 7 | |
| 8 | |
| 9 | |
| 10 | |
| 11 | |
| 12 | |
| 13 | |
| 14 | |
| 15 | |
| 16 | |
| 17 | |
| 18 | |
| 19 | |
| 20 | |
| 21 | |
| 22 | |
| 23 |