Empirical investigation of topological and weighted properties of a bus transport network from China
[Feng Shu-Min, Hu Bao-Yu†,  , Nie Cen, Shen Xiang-Hao, Ci Yu-Sheng]
, Nie Cen, Shen Xiang-Hao, Ci Yu-Sheng]
|
|


† Corresponding author. E-mail:
Project supported by the National High Technology Research and Development Program of China (Grant No. 2014AA110304).
Many bus transport networks (BTNs) have evolved into directed networks. A new representation model for BTNs is proposed, called directed-space P. The bus transport network of Harbin (BTN-H) is described as a directed and weighted complex network by the proposed representation model and by giving each node weights. The topological and weighted properties are revealed in detail. In-degree and out-degree distributions, in-weight and out-weight distributions are presented as an exponential law, respectively. There is a strong relation between in-weight and in-degree (also between out-weight and out-degree), which can be fitted by a power function. Degree–degree and weight–weight correlations are investigated to reveal that BTN-H has a disassortative behavior as the nodes have relatively high degree (or weight). The disparity distributions of out-degree and in-degree follow an approximate power-law. Besides, the node degree shows a near linear increase with the number of routes that connect to the corresponding station. These properties revealed in this paper can help public transport planners to analyze the status quo of the BTN in nature.
There is a great interest in public transport networks as complex networks, involving the bus transport network and subway (or railway) network. Specifically, more and more public transport networks have been investigated in recent years: Sienkiewicz and Hołyst made a statistical analysis on public transport systems in 22 Polish cities.[1] Angeloudis and Fisk analyzed the world’s twenty largest subway systems as complex networks.[2] von Ferber et al. presented a systematic survey of public transport networks of fourteen major cities in the world.[3,4] Xu et al. empirically studied complex features of public transport networks of 330 cities from China.[5] Statistical results showed that the public transport networks have some common features, such as exponential or power-law degree distribution, and typical small-world behaviors.
In previous studies, public transport networks were represented by three topological spaces:[1,6,7] space P, space L, and space R, which can be regarded as projections of a bipartite graph.[4,8,9] Some improved spaces were also proposed for actual public transport networks. Bi et al. proposed an improved space L (space S) to analyze urban rapid transit networks.[10] Yang et al. proposed an extended-space (ES) representation for bus transport networks based on space L (P), which comprised of ESL, ESP, and ESW networks.[11] To sum up, we noticed that most public transport networks were roughly described as undirected complex networks, in which the topological properties attracted more attention.
Recently, our investigation has discovered that the bus transport networks (BTNs) evolve into directed networks in some big cities (such as Harbin, Dalian from China), that is, there are lots of bus routes with different uplinks and downlinks. Zheng et al. built up a directed and weighted complex network model based on neighboring stops to analyze the topological properties of Beijing public transport network.[12] Therefore, it is necessary to establish a directed topological space for BTNs which can explore some new networked properties. Moreover, we find that nearly all the authors described BTNs as route networks or station networks and only focus on topological properties of the networks, and they commonly dismissed passenger flow on BTNs as another important composition of BTNs. We hold that some intrinsic properties of BTNs can be further revealed if passenger flow is considered in the networks.[13,14]
The remainder of this paper is organized as follows: Section 2 proposes a new representation model for BTNs, namely directed-space P. Section 3 details empirical distributions in directed and weighted BTN-H. Section 4 analyzes correlations and disparities in directed and weighted BTN-H. Section 5 gives a brief conclusion.
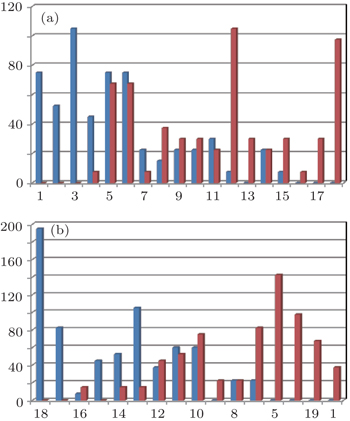
In this paper, we have reported an empirical investigation of the BTN of Harbin City in 2013, which included 132 bus routes (excluding two loop routes), 993 stations and peak-hour passenger production and attraction at each station. All the routes are divided into uplinks and downlinks. Specifically, we have counted the number of passengers who get on and get off the bus at each station in a morning peak hour by ride check, respectively, as shown in Fig.
 | Fig. 1. The collected data of route 1 in investigation: (a) uplink; (b) downlink. From above: blue bar and red bar denote the number of passengers who get on and get off the bus. The station names are listed in Appendix A. |
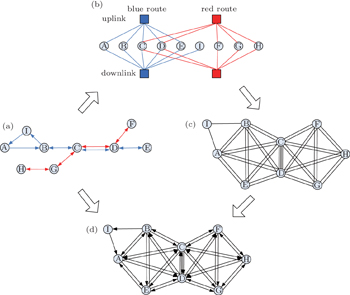
According to the investigation, it is such a common phenomenon that a bus route has different uplink and downlink in Harbin owing to single lanes and unidirectional passenger traffic, and its proportion is more than 36%. To describe the spatial characteristics of a directed BTN, we propose a new representation model for BTNs based on space P, called directed-space P.[11,12,15] The modeling can be divided into four steps as follows. A simple BTN is presented on the bus transport map, including two routes and nine stations (see Fig.
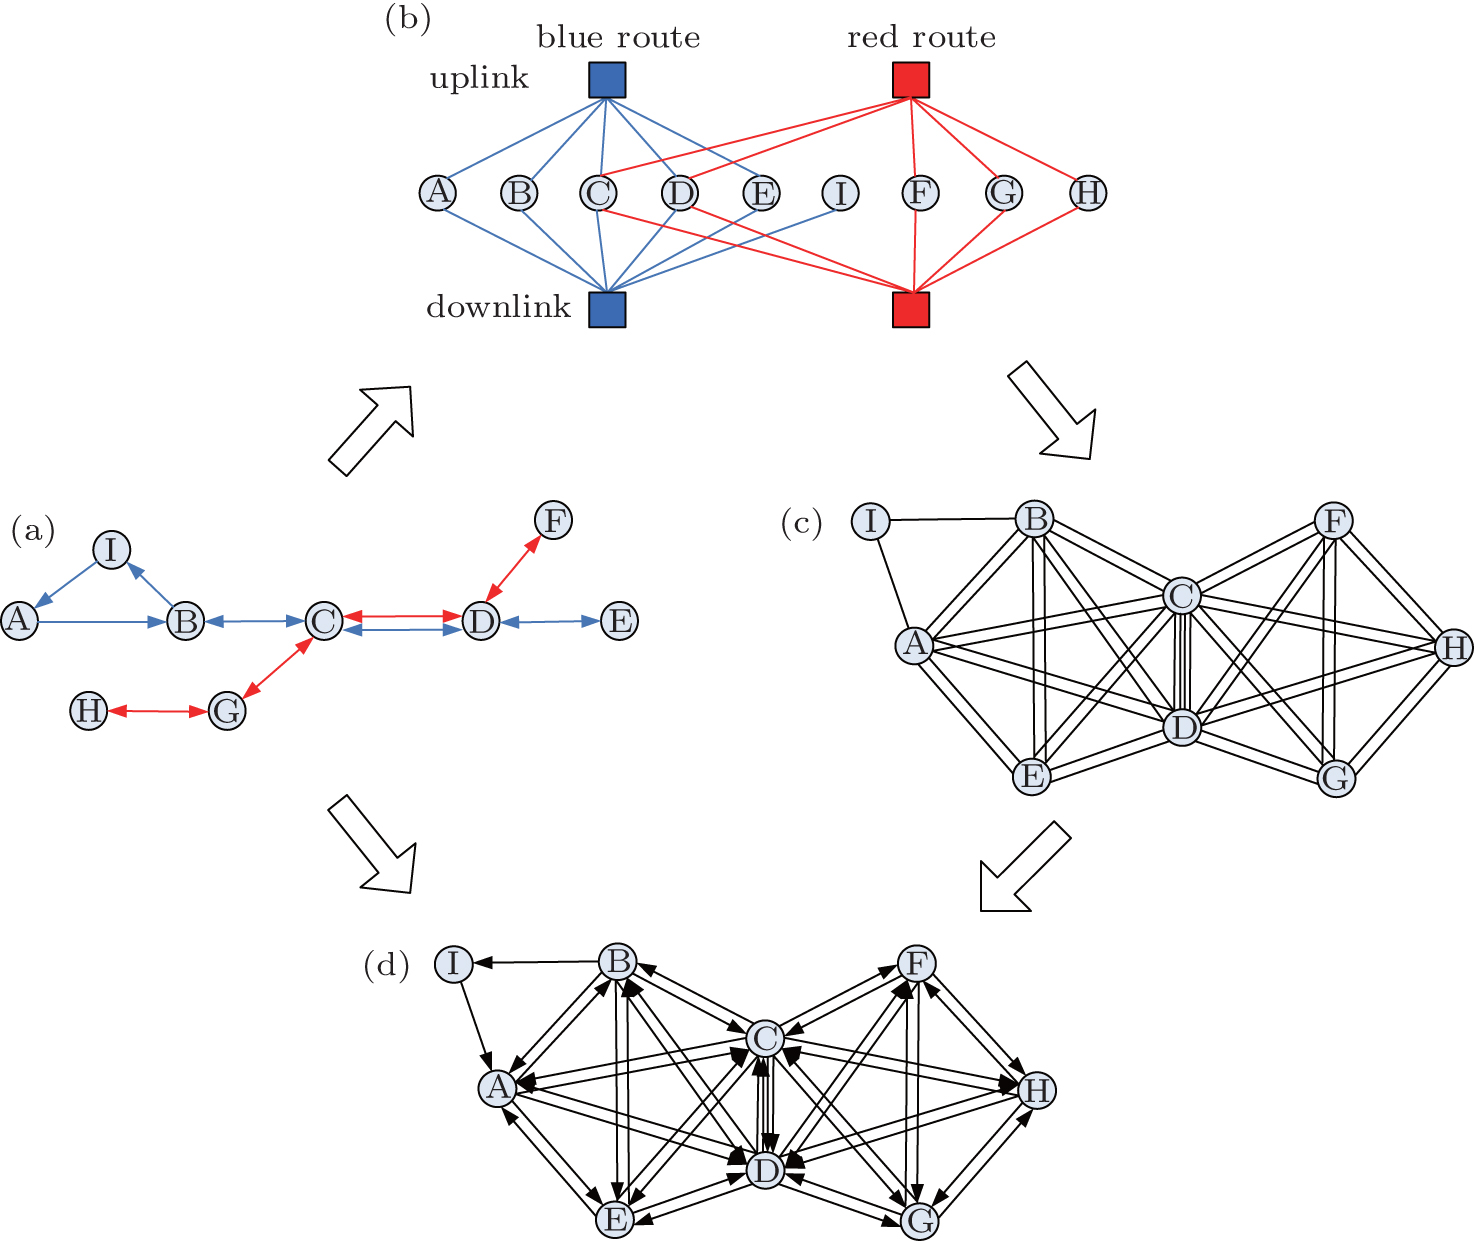 | Fig. 2. (a) Bus transport map; (b) extended bipartite graph; (c) unipartite graph; (d) directed unipartite graph. |
Figure

BTN-H is described as a directed and weighted complex network by the proposed directed-space P and by giving each node weights. The network covers 993 nodes and 93682 directed edges. It means that each passenger has a travel route or routes on these directed edges. In particular, the travel route from node i to node j may be different from the travel route from node j to node i. Degree and node weight are important measures of centrality of a node in the network. Degree distribution, node-weight distribution, and relation between degree and weight are studied in detail to reveal topological and weighted properties of the network.
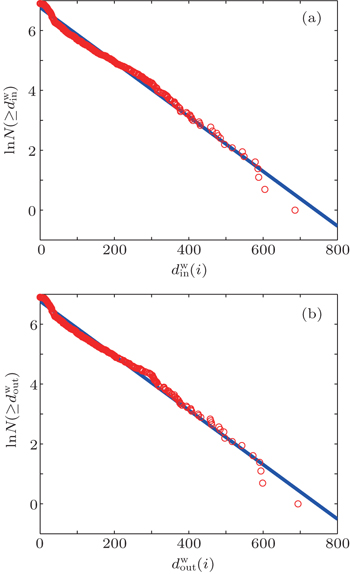
The node degree refers to in-degree and out-degree in a directed network. The in-degree of a node i is the number of edges with i as their terminal node (see Eq. (


Figure
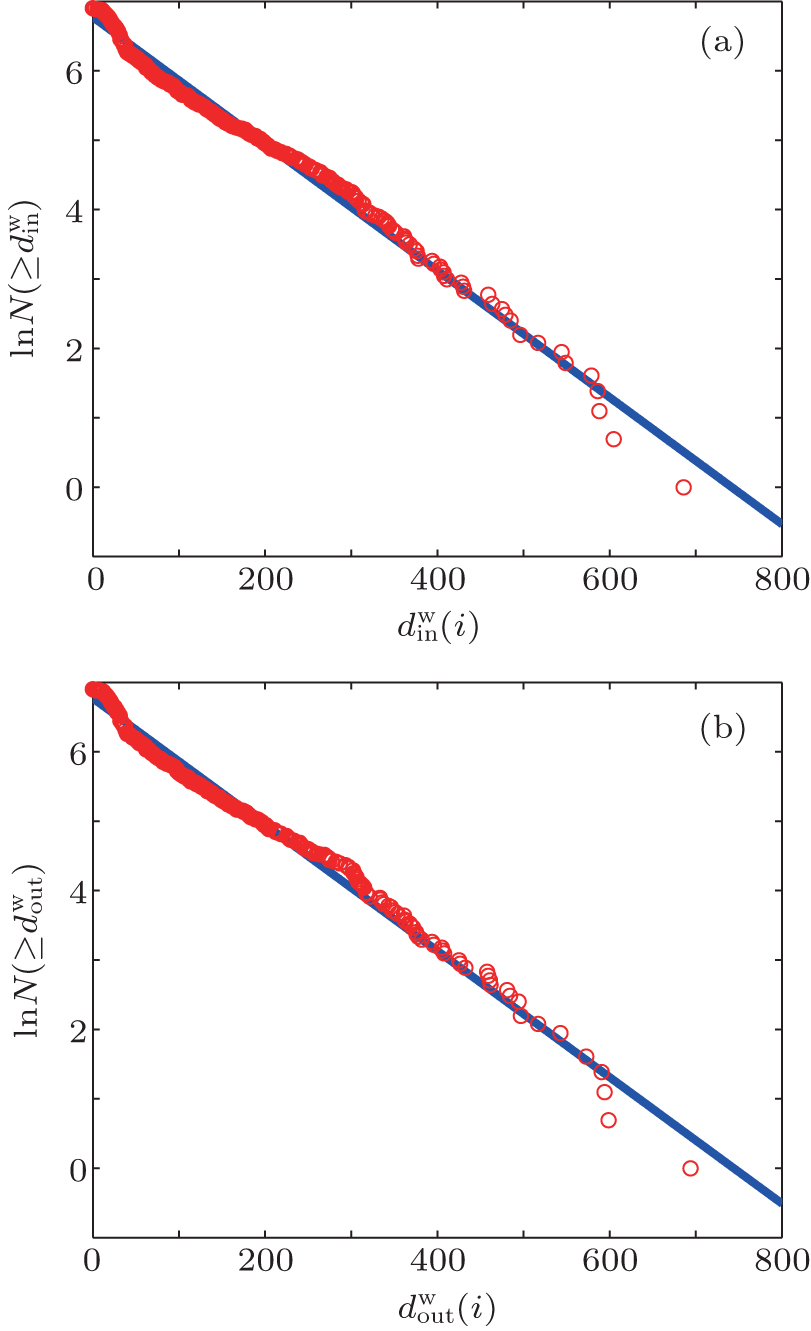 | Fig. 3. (a) Cumulative in-degree distribution; (b) cumulative out-degree distribution. |
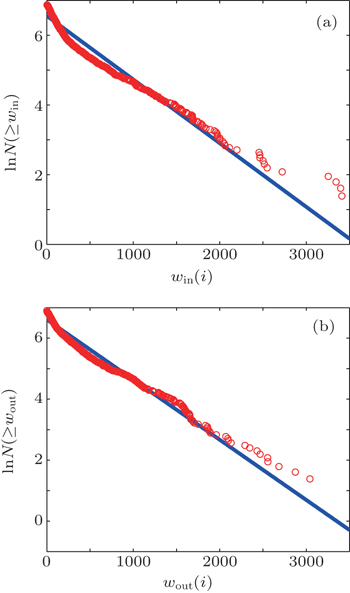
Similarly, the node weight is divided into in-weight and out-weight. The in-weight win (i) of a node i is defined as peak-hour passenger attraction at the corresponding station. The out-weight wout (i) of a node i is defined as peak-hour passenger production at the corresponding station. In terms of a node, in-weight and out-weight are usually unequal. Actually, the node weight is as important as its degree. If degree symbolizes the extrinsic importance of a node, then node weight symbolizes its intrinsic importance in the network. Put simply, the larger the node weight, the larger the corresponding degree. We can infer the BTN is designed reasonably according with passenger flow if degree distribution and node-weight distribution have the same law.
Figure
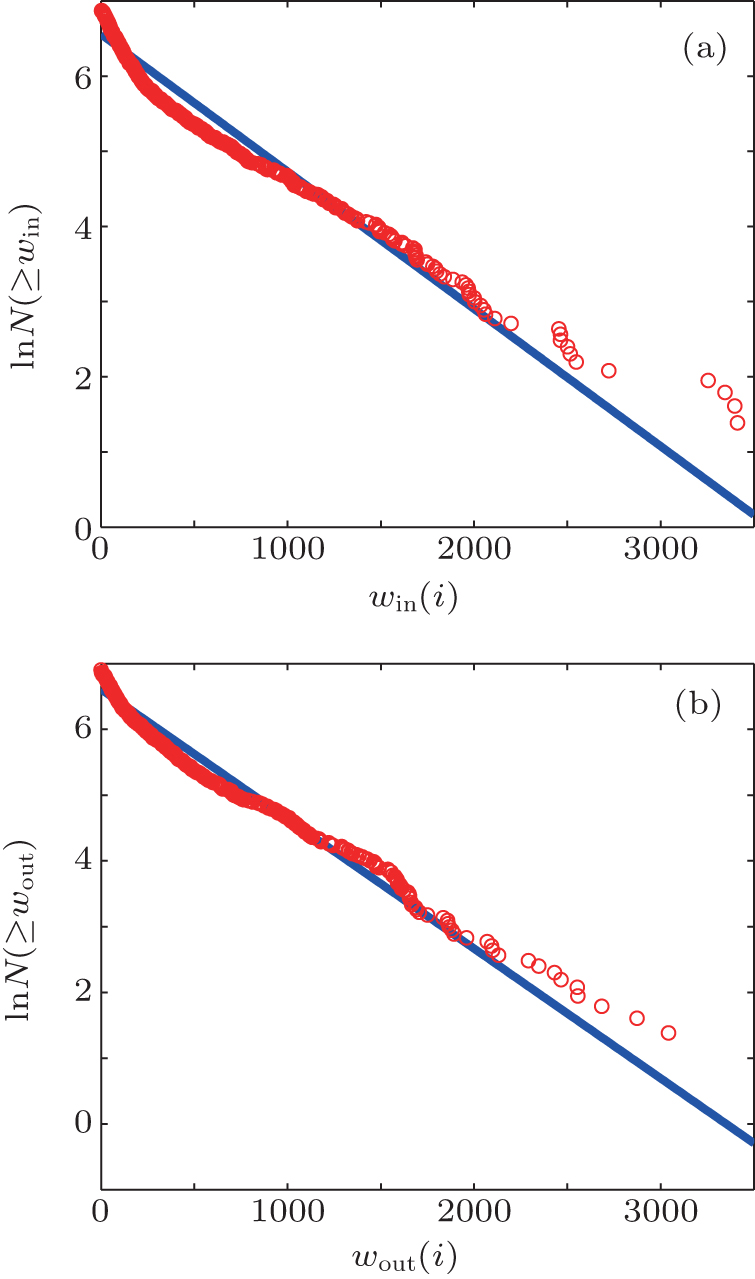 | Fig. 4. (a) Cumulative in-weight distribution; (b) cumulative out-weight distribution. |
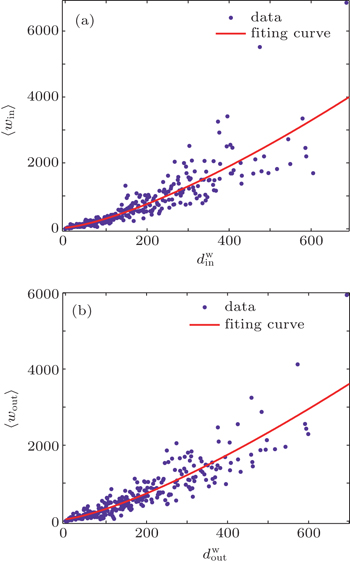
To figure out the relationship between nodes’ degree and weight, we investigate the dependence of win (i) on 


In Fig. 

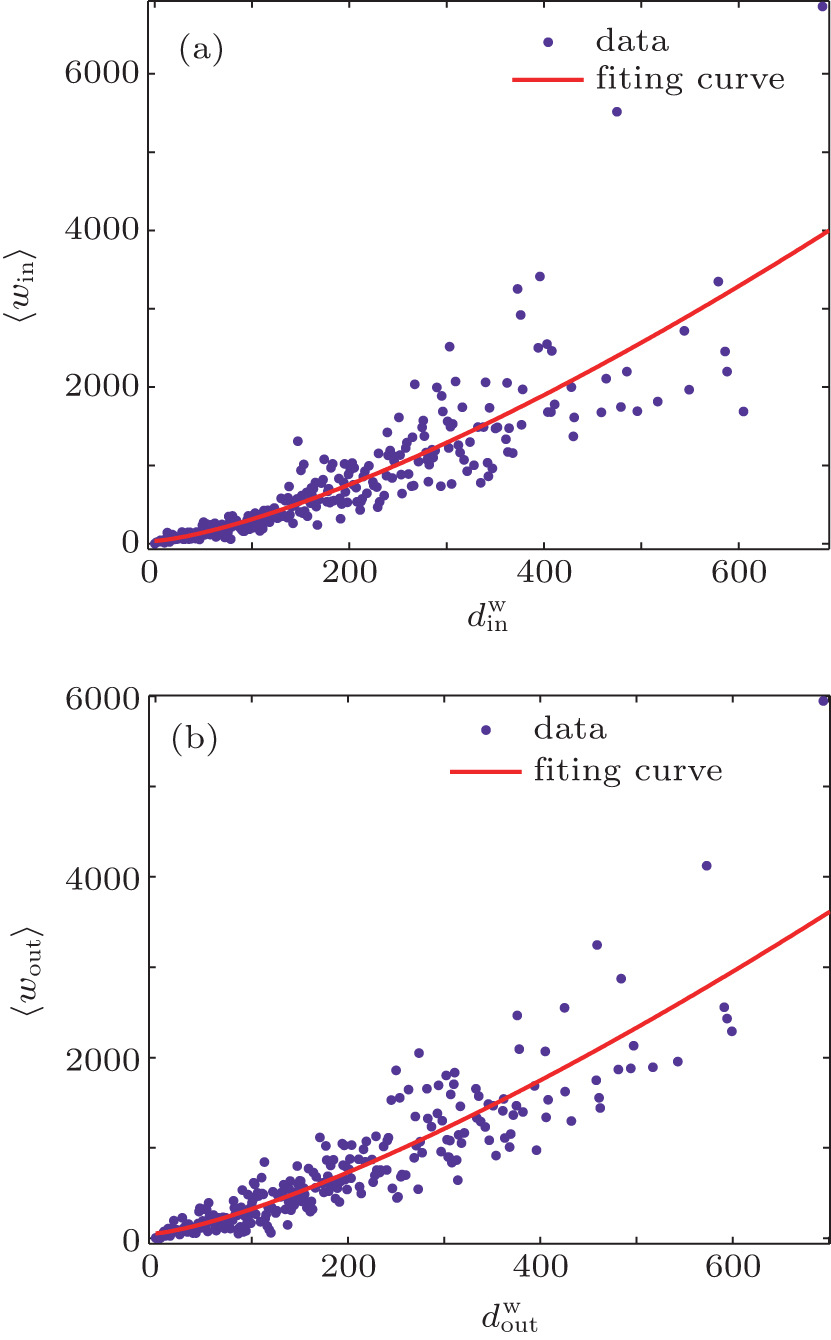 | Fig. 5. (a) Relationship between in-degree and in-weight,   |
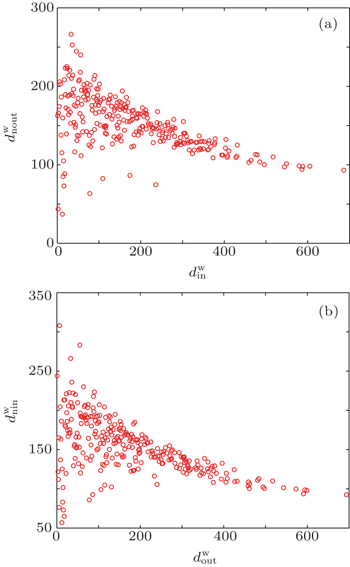
We turn now to investigate degree–degree and weight–weight correlations between connected nodes in the network to illustrate whether the network has an assortative or disassortative behavior. An assortative network is one where high-degree (or high-weight) nodes have high-degree (or high-weight) nearest neighbors, while an disassortative network has high-degree (or high-weight) nodes that have low-degree (or low-weight) nearest neighbors.[18,19]
Degree–degree correlation can measured by the average nearest-neighbor degree. Considering that the network is directed, we define the average nearest neighbors’ out-degree and in-degree for a given node as


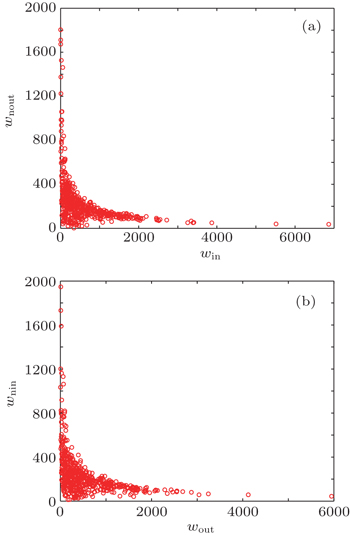
Analogously, weight–weight correlations can be measured by the average nearest-neighbor weight. We define the average nearest neighbors’ out-weight and in-weight for a given node as
Actually, the value of the average nearest-neighbor degree (or weight) is more than 1. It also denotes the node’s impact on its nearest neighbors, that is, the lower the neighbors’ degree (or weight), the greater the node’s impact.
Figures
 | Fig. 6. Degree–degree correlations for (a) nodes’ in-degree versus neighbors’ out-degree and (b) nodes’ out-degree versus neighbors’ in-degree. |
 | Fig. 7. Weight–weight correlations for (a) nodes’ in-weight versus neighbors’ out-weight and (b) nodes’ out-weight versus neighbors’ in-weight. |
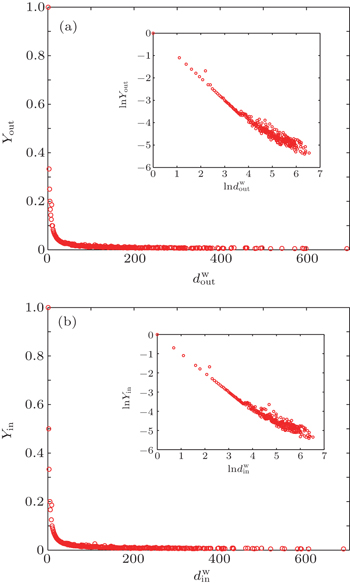
As another important topological parameter, we focus on the disparity of the node degree, which can measure the homogeneity of distribution of the node’s adjacent edges. For the directed network, we define the disparities of out-degree and in-degree for a given node as


We average the disparities of out-degree (or in-degree) for the nodes with the same out-degree (or in-degree)


Figure
 | Fig. 8. (a) Disparity distribution of out-degree; (b) disparity distribution of in-degree. |
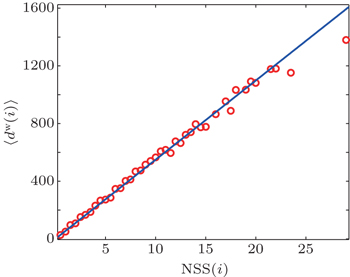
Besides, the number of routes that connect to a station (NSS) is another important parameter measuring the centrality of the station (node). Here, we examine the degree-route correlation between the node degree and NSS. The node degree equals the sum of in-degree and out-degree as

 | Fig. 9. Degree-route correlation in BTN-H. |
In this paper, uplinks and downlinks are separately considered to investigate the bus transport network of Harbin (BTN-H). The directed-space P representation model for BTNs is proposed. BTN-H is described as a directed and weighted complex network by the new representation model and by giving each node weights. The topological and weighted properties are revealed as follows.
In-degree and out-degree distributions, and in-weight and out-weight distributions are presented as an exponential law, respectively. It is believed that BTN-H is designed reasonably. In-degree and out-degree distributions have almost no difference, illustrating that BTN-H is an approximately symmetrical network. A possible explanation behavior is also revealed that new stations tend to be connected to the old ones at random during the expansion of BTN-H. Out-weight distribution is more approximate to exponential distribution than in-weight distribution. That may be because passengers’ departure is given more consideration than passengers’ arrival as BTN-H is designed. There is a strong relation between in-weight and in-degree (also between out-weight and out-degree), in spite of unavoidable fluctuations. It can also be concluded that the topological structures of BTN-H are codetermined by passenger production and attraction at each station.
Degree–degree and weight–weight correlations are investigated to reveal that BTN-H does not have an assortative or disassortative behavior as the nodes have relatively low degree (or weight), while BTN-H has a disassortative behavior and the nodes have a growing impact on their neighbors as the nodes have relatively high degree (or weight). The disparity distributions of out-degree and in-degree follow an approximate power-law, inferring that most stations have relatively homogeneous connections with other stations in BTN-H. Besides, the node degree shows a near linear increase with the number of routes that connect to the corresponding station. It can be deduced that the two measures provide almost the same information for the node centrality.
These properties revealed in this paper can help public transport planners to analyze the status quo of the BTN in nature. However, we have only collected peak-hour passenger production and attraction at each station. We will investigate the origin–destination (OD) passenger flow in future to explore more intrinsic properties of BTNs.
| 1 | |
| 2 | |
| 3 | |
| 4 | |
| 5 | |
| 6 | |
| 7 | |
| 8 | |
| 9 | |
| 10 | |
| 11 | |
| 12 | |
| 13 | |
| 14 | |
| 15 | |
| 16 | |
| 17 | |
| 18 | |
| 19 |