Song Hai-Yang, Li Yu-Long. Effect of amorphous lamella on the crack propagation behavior of crystalline Mg/amorphous Mg–Al nanocomposites. Chinese Physics B, 2016, 25(2): 026802
Permissions
Effect of amorphous lamella on the crack propagation behavior of crystalline Mg/amorphous Mg–Al nanocomposites
Song Hai-Yang1, †, , Li Yu-Long2, ‡,
College of Materials Science and Engineering, Xi’an Shiyou University, Xi’an 710065, China
School of Aeronautics, Northwestern Polytechnical University, Xi’an 710072, China
Project supported by the National Natural Science Foundation of China (Grant Nos. 11372256 and 11572259), the 111 Project (Grant No. B07050), the Program for New Century Excellent Talents in University of Ministry of Education of China (Grant No. NCET-12-1046), and the Program for New Scientific and Technological Star of Shaanxi Province, China (Grant No. 2012KJXX-39).
Abstract
Abstract
The effects of amorphous lamella on the crack propagation behavior in crystalline/amorphous (C/A) Mg/Mg–Al nanocomposites under tensile loading are investigated using the molecular dynamics simulation method. The sample with an initial crack of orientation [0001] is considered here. For the nano-monocrystal Mg, the crack growth exhibits brittle cleavage. However, for the C/A Mg/Mg–Al nanocomposites, the ‘double hump’ behavior can be observed in all the stress–strain curves regardless of the amorphous lamella thickness. The results indicate that the amorphous lamella plays a critical role in the crack deformation, and it can effectively resist the crack propagation. The above mentioned crack deformation behaviors are also disclosed and analyzed in the present work. The results here provide a strategy for designing the high-performance hexagonal-close-packed metal and alloy materials.
As one of the lightweight materials, Mg and its alloys have attracted considerable attention due to their potential applications in aerospace industries and energy conservation.[1–6] However, Mg and its alloys exhibit relatively low ductility and fracture toughness compared with face-centered cubic (fcc) and body-centered cubic (bcc) metals. Both its low ductility and low fracture toughness are detrimental to its applications. It is well known that the existence of a proper interfacial boundary in metal material will strongly affect their mechanical properties.[7–9] Amorphous alloy has sparked renewed interest in recent years due to its superior mechanical properties besides great wear and corrosion resistance.[10–17] A switching from the catastrophic failure to homogenous plasticity has also been reported for metallic glasses.[18,19] Some researches have shown that the crystalline/amorphous (C/A) Cu/Cu–Zr composites present high strength and potentially superior ductility.[20,21] Fracture behavior on an atomic scale is strongly dependent on the atomistic structure and the discrete nature of matter distribution. Very recently, Wu and Curtin[22] studied the crack deformation behavior in Mg for a broad range of crack orientations. They found that Mg was intrinsically brittle because crack tip dislocation nucleation was not observed in almost all geometries. Could the introduction of an amorphous phase into Mg and its alloys improve their mechanical properties? Relevant study on the crack deformation behavior of metals in Mg and its alloys is still very rare. In addition, the crack growth behavior of C/A composites is also very different from that of pure metals. In this work, we investigate the effect of amorphous lamella on the crack deformation behavior of C/A Mg/Mg–Al composites under tensile loading using molecular dynamics (MD) simulation. Some interesting results are obtained.
The rest of the paper is organized in the following way. In Section 2 we describe the simulation model and method for MD simulation. Section 3 provides results and discussion. Finally, some concluding remarks are given in Section 4.
2. Simulation model and method
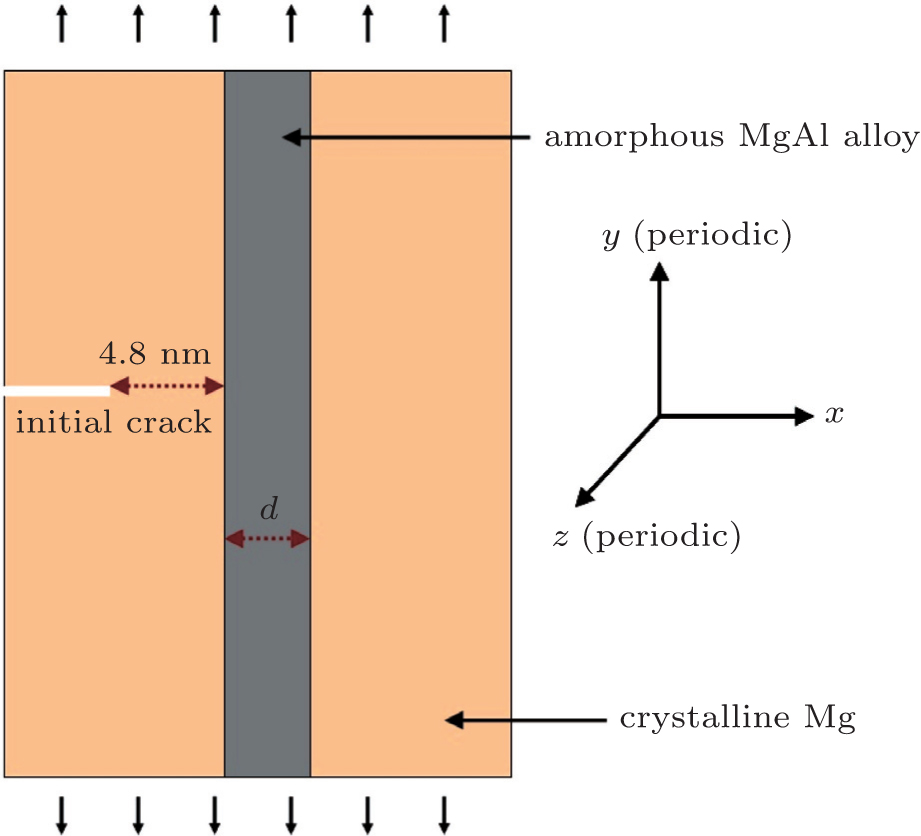
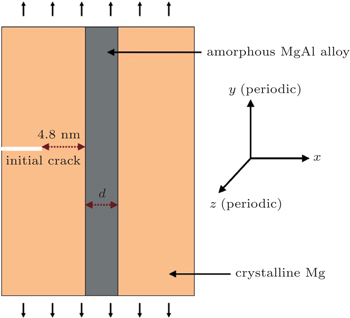
The sample used in our simulation is divided into the crystalline phase and amorphous phase. Here, the amorphous phase is composed of the two elements Mg and Al.[23–26] The numbers of Al atoms and Mg atoms in the amorphous phase are equal.[24–26] In constructing the amorphous phase, Mg–Al composition is first relaxed at 1000 K (higher than the melting temperature of Mg–Al compositions alloy) for 0.3 ns, while constraining the atoms of nanocrystalline Mg sections to being immobile. Subsequently, the amorphous phase is equilibrated at 0.01 K for 0.3 ns. Finally, the overall system is relaxed at 5 K for 0.3 ns prior to loading. After the sample is relaxed completely, the edge cracks are introduced by removing the atoms from the perfect crystalline phase as shown in Fig. 1. The crack growth rate is strongly dependent on the crystal orientation of the initial crack. The crack growth rate of orientation [0001] is the highest among all crystalline orientations.[2] To study the suppression ability for amorphous lamella to crack growth, the sample with an initial crack of orientation [0001] is considered here. It is well known that the crack growth behaviors observably depend on its shape. Blunting a crack tip even by an atomic layer can cause a brittle-to-ductile transition. Here, the length and width of the initial atomically sharp crack are about 6.0 nm and 0.6 nm, respectively. The distance between the crack tip and the amorphous boundary of each sample is 4.8 nm. The amorphous lamella thickness (d) ranges from 1.5 nm to 10.0 nm. The dimensions of the simulation system in the x, y, and z directions are about 26.5, 51.6, and 2.2 nm, respectively. The numbers of atoms in both the computational models are 131376. Periodic boundary conditions are applied in z and y directions, while the free surface is used for the x direction. In all samples, a constant strain of 0.001 is applied along the y direction, which is perpendicular to the crack plane. The inter-atomic potential used in this study is an embedded atom method (EAM) potential developed by Liu et al.[27] A 3.0-fs time step is used in all MD simulations.[28] All simulations are performed at a constant temperature of 5.0 K. Common neighbor analysis[29,30] is employed to visualize the defect in the nanocrystal, and colors are assigned according to the local crystal structure of atoms. This is implemented by using the Open Visualization Tool.[31] Here, the hcp, fcc, and non-structured atoms are colored red, green, and gray, respectively.
Fig. 1. Model geometry of C/A Mg/Mg–Al nanocomposite containing an initial crack.
3. Results and discussion
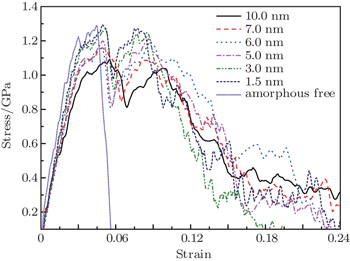
Figure 2 shows the stress–strain curves of C/A Mg/Mg–Al nanocomposites with d varying from 1.5 nm to 10.0 nm under tension loading. For comparison, we also give the stress–strain curves of nano-monocrystal Mg (namely, d is equal to 0.0 nm) in Fig. 2. The stress–strain relationship provides the overall mechanical response of a material subjected to mechanical loading. Here, the stress used to describe the stress–strain relation is calculated using the virial theorem. Figure 2 shows that the stress–strain curve is divided into elastic and plastic stages before and after the strain of 0.02. At the first deformation stage, the stress increases linearly with the increase of the applied strain and the samples undergo purely elastic deformation, regardless of the amorphous lamella thickness. Subsequently, the stress increases with the increase of the strain and reaches a peak, showing a strain hardening behavior. It is observed that the mechanical behaviors of samples are obviously all affected by d. Figure 2 shows that the peak stresses of C/A Mg/Mg–Al nanocomposites decrease with the increase of d. In detail, the peak stresses of samples with d values of 1.5 nm and 10.0 nm are 1.29 GPa and 1.09 GPa, respectively. The reason can be given that the strength for the nanocrystalline Mg under tension loading presented in our research is stronger than the amorphous one due to the regularly long-range ordered structure. Hence, for the sample with larger d, which means the proportion of crystal is higher, the peak stress is higher than that of smaller d. Figure 2 also indicates that for nano-monocrystal Mg, a rapid drop in the stress occurs immediately upon reaching the peak stress. However, this behavior obviously changes and the deformation-induced stress softening is smooth rather than abrupt when the amorphous phase is introduced into Mg. It is also interesting to note from Fig. 2 that the ‘double hump’ behavior is observed in all the stress–strain curves of C/A Mg/Mg–Al nanocomposites. The above-mentioned behaviors observed in Fig. 2 indicate that the amorphous lamella in C/A Mg/Mg–Al nanocomposites can improve crack resistance.
Fig. 2. Stress–strain curves of C/A Mg/Mg–Al nanocomposites with different d values under tension loading.
To understand the rapid drop behavior of stress for nano-monocrystal Mg, figure 3 shows the atomic configurations of nano-monocrystal Mg with a sharp crack under various strain values. Figure 3(a) gives the atomic structure at a tensile strain of 0.045, which is associated with the stress peak in nano-monocrystal Mg as shown in Fig. 2. Following this event, the crack rapidly grows via cleavage along the [0001] direction in the plane due to the stress concentration and reaches the edge at only a tensile strain of 0.050 as shown in Fig. 3(b). Namely, the crack growth exhibits brittle cleavage. It can also be seen from Fig. 3 that dislocation does not occur at the crack tip during crack growth, and the crack tip is not significantly blunted. The potential reason is that the crack here is very sharp on the one hand, and that except for the basal plane, there are no other possible slip planes with resolved stress to be opened on the other hand. This result is in agreement with the previous result of the crack growth behavior in the same crystal orientation.[2]
Fig. 3. Snapshots of nano-monocrystal Mg, under tensile strain values of (a) 0.045 and (b) 0.050. The atoms are colored according to the common neighbor analysis.
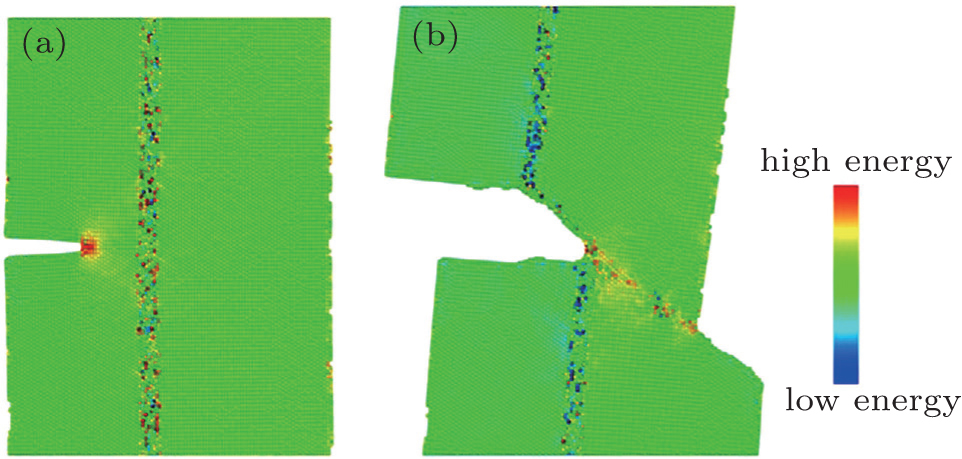
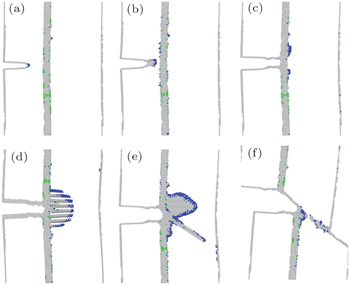
Searching for more details of the ‘double hump’ behavior in the strain–stress curve of C/A Mg/Mg–Al nanocomposites, figure 4 gives the atomic structure of nanocomposites with the d value of 1.5 nm under various strain values. It can be clearly seen from Fig. 4(a) that the deformation occurs in the crack tip and the slight blunting is observed at the crack tip due to stress concentration. As strain goes up to 0.050, the vacancy is discovered near the crack tip and the crack growth is triggered, resulting in first rapid drop in the stress. It can also be seen from Fig. 4(b) that the crack exhibits a brittle fracture along the [0001] direction accompanied with obvious blunting around crack tips. Subsequently, the crack reaches the C/A boundary when the strain goes up to 0.054 as shown in Fig. 4(c). After that, the crack growth is hindered by the C/A boundary and the stress increasing behavior is re-present as shown in Fig. 2. Namely, as strain further increases, the stress does not suffer a further drop, but increases in turn, showing a strain hardening behavior. In addition, it can be observed from Figs. 4(a)–4(c) that the dislocation does not occur at the crack tip of nanocomposites, and it works in a similar way to that of nano-monocrystal Mg. As the strain increases to 0.080, the local plastic deformation triggers the relaxation of the stress concentration ahead of the crack tip. As shown in Fig. 4(d), the prismatic dislocation nucleates and emits from the amorphous boundary adjacent to the crack tip. It corresponds to the drop of the stress–strain curve at the second peak stress displayed in Fig. 2. Dislocation motions provide an effective way to release the stress concentration around the crack tip. Here, the amorphous boundary acts as the dislocation resource which is similar to the grain boundary and twin boundary in nanocrystal metal material. With the increase of the strain, a pyramidal slip dislocation emission occurs from the amorphous boundary adjacent to the crack tips as shown in Fig. 4(e). Shortly afterwards, the blunted crack starts to grow along the pyramidal slip plane, leading to a gradual stress drop as shown in Fig. 2. In other words, the crack propagation path is deflected when the crack penetrates the amorphous boundary. The primary reason for the crack growth again is that dislocation slip is difficult to relieve the excessive stress, and the high stress concentration triggers the crack propagation. Figure 5 shows the stress distributions in the y direction at the strain values of 0.050 and 0.118, respectively. The color assigned to each atom in Fig. 5 represents the magnitude of σy. Clearly, the stress concentration occurs at the crack tip and results in atomic cleavage at the crack tips.
Fig. 4. Snapshots of C/A Mg/Mg–Al nanocomposites with d value of 1.5 nm, under tensile strain values of (a) 0.032, (b) 0.050, (c) 0.054, (d) 0.080, (e) 0.082, and (f) 0.118. The atoms are colored according to the common neighbor analysis. The perfect hcp atoms are removed for clarity.
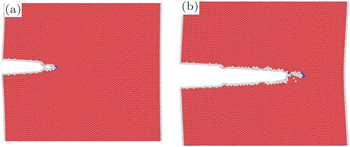
Fig. 5. Stress distributions in the y direction at the strain values of 0.050 and 0.118, respectively.
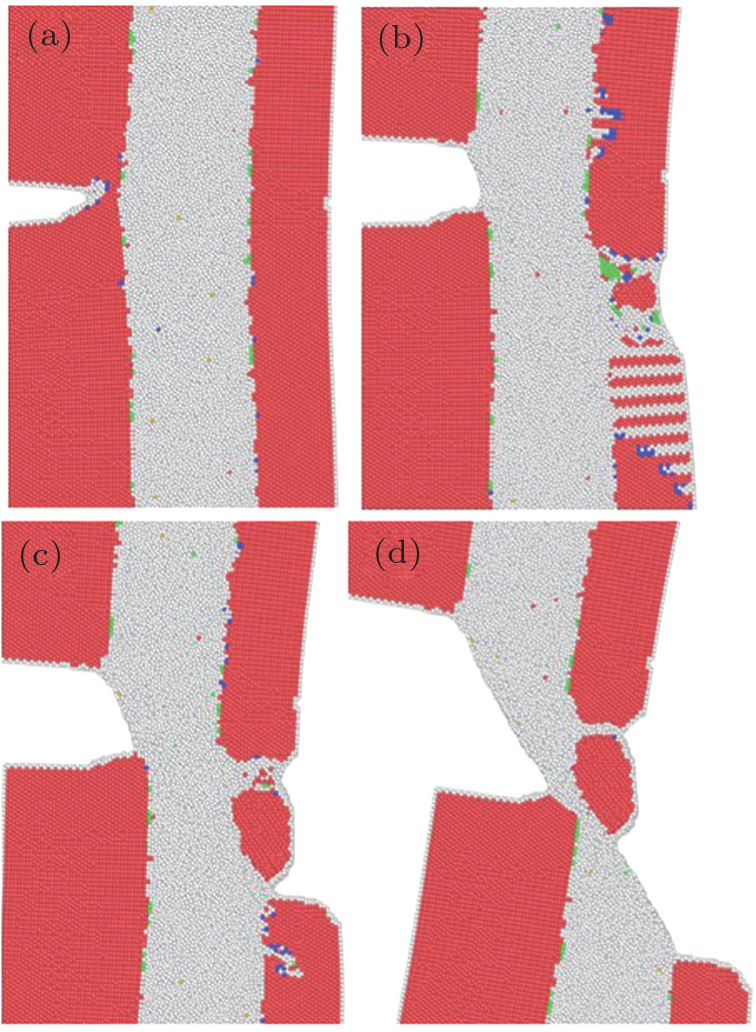
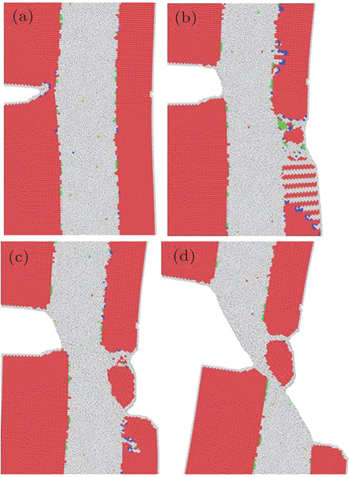
In order to investigate the effect of d on the crack growth behavior of nanocomposites, figure 6 gives the atomic structure of nanocomposites with a d of 10.0 nm under various strain values. It can be seen from Fig. 6(a) that for a sample with a d of 10.0 nm, the crack growth behavior is similar to the case of d being equal to 1.5 nm when the strain is less than 0.10. However, as strain further increases, the new grain nucleates and grows quickly from the amorphous boundary adjacent to the crack tips due to the stress concentration as shown in Fig. 6(b). This novel plastic deformation behavior (new grain nucleation and growth) in Mg have been reported in our previous simulation[32] and Liu et al.’s experiment results.[33] The reason for the nucleation of new grain mainly is that dislocation slip is difficult to relieve the excessive stress, and the high stress concentration induces atomic rearrangement. Then a crack nucleates at the interface between new and old grains, and quickly reaches the C/A boundary as shown in Fig. 6(c). It should be noted that with further increasing strain, the crack growth mainly depends on the stable sliding of the amorphous section as shown in Fig. 6(d). This deformation behavior is dramatically different from the case of d being equal to 1.5 nm, in which the subsequent crack growth is dominated by the slipping of the pyramidal plane. This is evident from the fact that the deformations of the amorphous section dominate the plastic behavior of C/A Mg/Mg–Al nanocomposites as the d becomes larger. This result is in agreement with a recent result of C/A Mg/Mg–Al nanocomposites.[34] In addition, this sliding behavior of amorphous can also be changed by the uniform introduction of a notch at the surface of the amorphous section.[35]
Fig. 6. Snapshots of C/A Mg/Mg–Al nanocomposites with d of 10.0 nm, under tensile strain values of (a) 0.055, (b) 0.120, (c) 0.143, and (d) 0.252. The atoms are colored according to the common neighbor analysis.
The study mentioned above indicates that the C/A boundary plays a critical role in the crack deformation, and it can effectively resist the crack propagation regardless of the amorphous lamella thickness. The simulation results here suggest that the introduction of a C/A boundary within hcp metal is a viable route toward developing high-performance lightweight materials.
4. Conclusions
Using the MD simulation method, we investigate the crack deformation behavior of C/A Mg/Mg–Al nanocomposites under tension loading. The microstructure evolutions of crack growth in C/A Mg/Mg–Al nanocomposites and nano-monocrystal Mg are also given. The results show that the C/A boundary plays a critical role in the crack deformation. For the nano-monocrystal Mg, a rapid drop in the stress occurs immediately upon reaching the peak stress and the crack growth exhibits brittle cleavage. However, for C/A Mg/Mg–Al nanocomposites, the ‘double hump’ behavior is observed in each of all the stress–strain curves, regardless of the amorphous lamella thickness. The crack growth in C/A Mg/Mg–Al nanocomposites is dominated by the slipping of the pyramidal plane or amorphous lamella. The simulation results indicate that the amorphous lamella has an important effect on crack deformation behavior and it can effectively resist the crack propagation regardless of the amorphous lamella thickness.

 , Li Yu-Long2, ‡,