
Vibrational features of confined water in nanoporous TiO2 by Raman spectra
[Gao Xin1, †,  , Wang Qiang2, Sun Gang2, Li Chen-Xi2, Hu Lin1]
, Wang Qiang2, Sun Gang2, Li Chen-Xi2, Hu Lin1]
 |


† Corresponding author. E-mail:
Project supported by the National Natural Science Foundation of China (Grant Nos. 11304049 and 11264006), the Guizhou Provincial Science and Technology Foundation, China (Grant No. J[2010]2132), and the Doctor Funds of Guizhou University, China (Grant No. [2012] 020).
Raman spectra of confined water adsorbed in nanoporous TiO2 are obtained in experiment. TiO2 samples with different pore diameters under different humidity conditions are investigated. The results indicate that the symmetric vibrational mode of water molecule is destroyed when relative humidity decreases. This indicates that the interaction between water molecules and surface of TiO2 becomes stronger when the distance between water molecules and surface turns smaller, and the interaction plays a major role in depressing the symmetric vibrational peak. The spectra of confined water in TiO2 and Vycor are compared. When filling fractions are the same, their spectra show distinctions no matter whether they are in partial filling condition or in full filling condition. The spectra of HDO confined in TiO2 with different filling fractions are compared with each other. There is no clear distinction among their vibrational peaks, and the peaks mainly relate to asymmetric vibration. Therefore, the interaction between water molecules and the wall of pore decouples the symmetric vibrational mode only, and the influences on asymmetric vibrational mode show little differences among different filling fractions.
Water is the most abundant and common fluid in nature, and it is closely related to most natural phenomena and our life. Confined water has attracted considerable attention due to its significance in many fields of science, including biology,[1–3] nanofluidic devices,[4–9] geology,[10] etc. There are so much work on confined water in porous materials such as zeolite,[11–13] Vycor,[14,15] carbon nanotube,[16–26] etc. Physical characteristics of nanoconfined water is related to material, pore size, shape of wall, and chemical properties of surface, so the structure and dynamics differ from those of the bulk water.[27–33]
Titanium dioxide is a kind of functional material which is used in many areas, such as heterogeneous catalysis,[34,35] solar cell,[36] gas sensor,[37–39] white pigment, and it is also used as bone implants[40] because of its great biocompatibility. Almost all applications are based on the surface properties of titanium dioxide so that the surface science of titanium dioxide has become a hot spot in surface science researches in the last decades.[41] Especially, the water interacting with surface of titanium dioxide has been studied widely because many applications are related to this interaction.[42] Though a great deal of work has been done on the interaction between water molecules and surface of titanium dioxide, most of which are studied in vacuum condition, there are few reports on confined water in porous titanium dioxide. In many cases such as catalysis, porous titanium dioxide has been used to enlarge the interface between water and titanium dioxide.[43–45] Besides surface properties of substrate, it is essential to study the structure and dynamics of water molecules in porous titanium dioxide with considering other factors such as pore size or filling fraction of water as well.
The vibrational dynamics of water molecules can be measured by Raman spectroscopy,[46,47] and this method has been used widely to study the confined water in porous materials as well.[15,48–50] The relative intensities of Raman shift from different modes of vibration will change when water molecule adsorption happens in different environment. Most of these relevant researches focus on the substrate of silica. However, there is little work on studying the substrate of titanium dioxide. It is hard to realize appreciable signal-noise ratio of Raman spectrum, because the fluorescence background is so intensive that the background almost shields the Raman signal of water. Researchers choose deuteroxide D2O to decouple the mode of symmetric vibration so that different modes of vibration can be analyzed separately.[47,51–54] In order to reveal the influences caused by filling fraction and pore size, D2O is used to decouple symmetric vibration in this work.
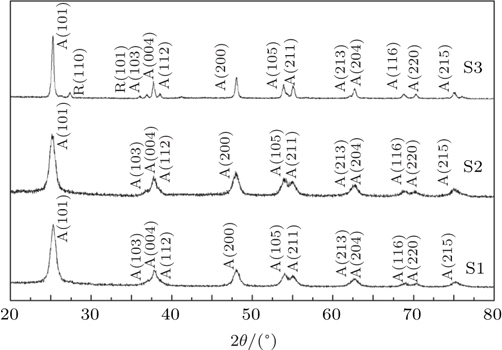
In this work, three samples of porous titanium dioxide with different diameters(Sachtopore®-NP, ZirChrom Separations, Inc.) are used as porous absorbents. These porous materials are produced as chromatographic packing material, and they each have a great chemical stability and adsorption selectivity. The chemical purity of each of all the samples is 99.99%. The average diameters for three samples are 60 Å, 100 Å, and 300 Å separately, and they are denoted as S1, S2, and S3. The physical parameters of all samples are shown in Table
| Table 1. Physical parameters of the samples. . |
The Raman spectrum of water confined in Vycor porous glass (Corning Vycor®, code 7930) is used to compare with spectra of water in titanium dioxide samples. The average diameter of this Vycor glass is 69 Å, and specific surface area is 130 m2/g. Vycor glass is comprised of SiO2, B2O3, and Na2O, and is produced by quenching and subsequent acid leaching. Unlike the sample of titanium dioxide, Vycor glass has an amorphous structure, and the concentrations of these three components are about 96%, 3%, and 0.4% respectively. Therefore, Vycor glass can be considered as a silica-based porous material which is denoted as S4 in our experiment.
 | Fig. 1. XRD spectra of S1, S2, and S3, where A and R represent anatase and rutile respectively. |
A method of using saturated salt solution to control relative humidity is adopted. The saturated vapor of each kind of saturated salt solution has special relative humidity at a certain temperature. The typical salts used in this work are bought from Jinke institute of fine chemical industry and the corresponding humidity values of saturated solutions are shown in Table
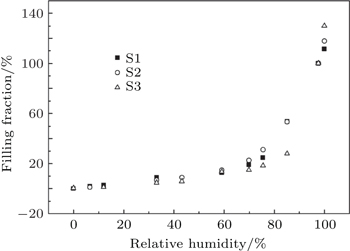
The weight m1 values of dry samples are measured by an analytical balance of Mettler AE240 with a sensitivity of 0.01 mg, then the dry samples are placed in adsorption box where the humidity is adjusted to some fixed value by corresponding saturated salt solution. This should be kept for 2 days to ensure that the adsorption reaches equilibrium. After the adsorption reaches equilibrium, the weight m2 values of the samples are measured. When the weight m3 values of the samples filled fully with water are measured finally, the corresponding filling fraction of water at each relative humidity can be written as

A Jobin Yvon T64000 Raman system is used to measure Raman scattering spectra of samples in the experiment, and wavelength of the laser is 532 nm. The laser with a power of 1 mW is focused on sample surface through the fused quartz window with a ×50 long focus objective. The integration time is set to be 140 ms per point with a spectral resolution of 1.4 cm−1. All samples are prepared and measured at about 20 °C.
| Table 2. Relative humidity values of different saturated salt solutions at 20 °C. . |
Figure
 | Fig. 2. Plots of filling fraction versus relative humidity for samples S1, S2, and S3. |
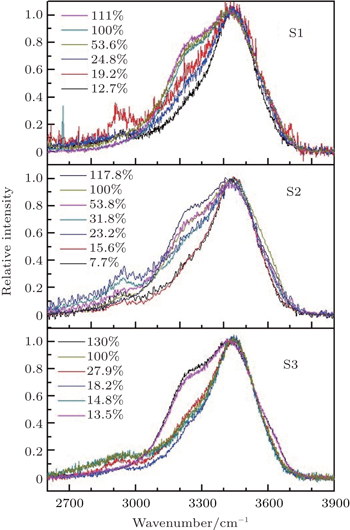
The Raman spectra of samples S1, S2, and S3 normalized by peak intensity are shown in Fig.
For the cases with lower filling fractions, the Raman spectra mainly indicate the vibrational information of water molecules near the interface of the substrate where the titanium dioxide substrate affects features of water molecule strongly. This indicates that the main action of the substrate is to weaken the symmetric vibration of H–O–H, so the asymmetric vibration dominates for the cases with lower filling fractions. For S3, when filling fraction is lower than 30%, the symmetric vibrational peak nearly vanishes, and there are little differences among the cases with filling fractions lower than 30%. However, there are still apparent peaks existing for S2 until its filling fraction is lower than 20%. For S1, even the filling fraction is lowered to 20%, the component of symmetric vibration in Raman peak still exists, and it vanishes mostly only when the filling fraction reaches 10%.
 | Fig. 3. Comparisons of stretching band of water adsorbed in S1, S2, and S3 among different filling fractions. |
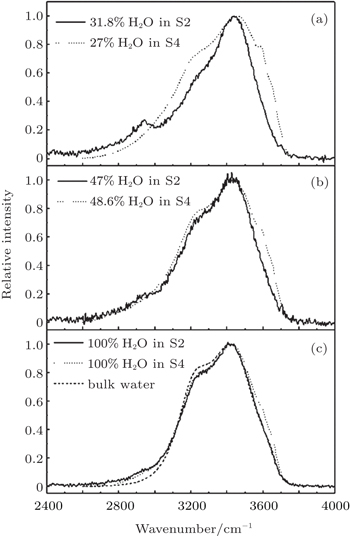
In order to ascertain the influence caused by interface of the substrate materials, the Raman peaks of water in both porous titanium dioxide and silicon dioxide are compared in Fig.
In Figs.
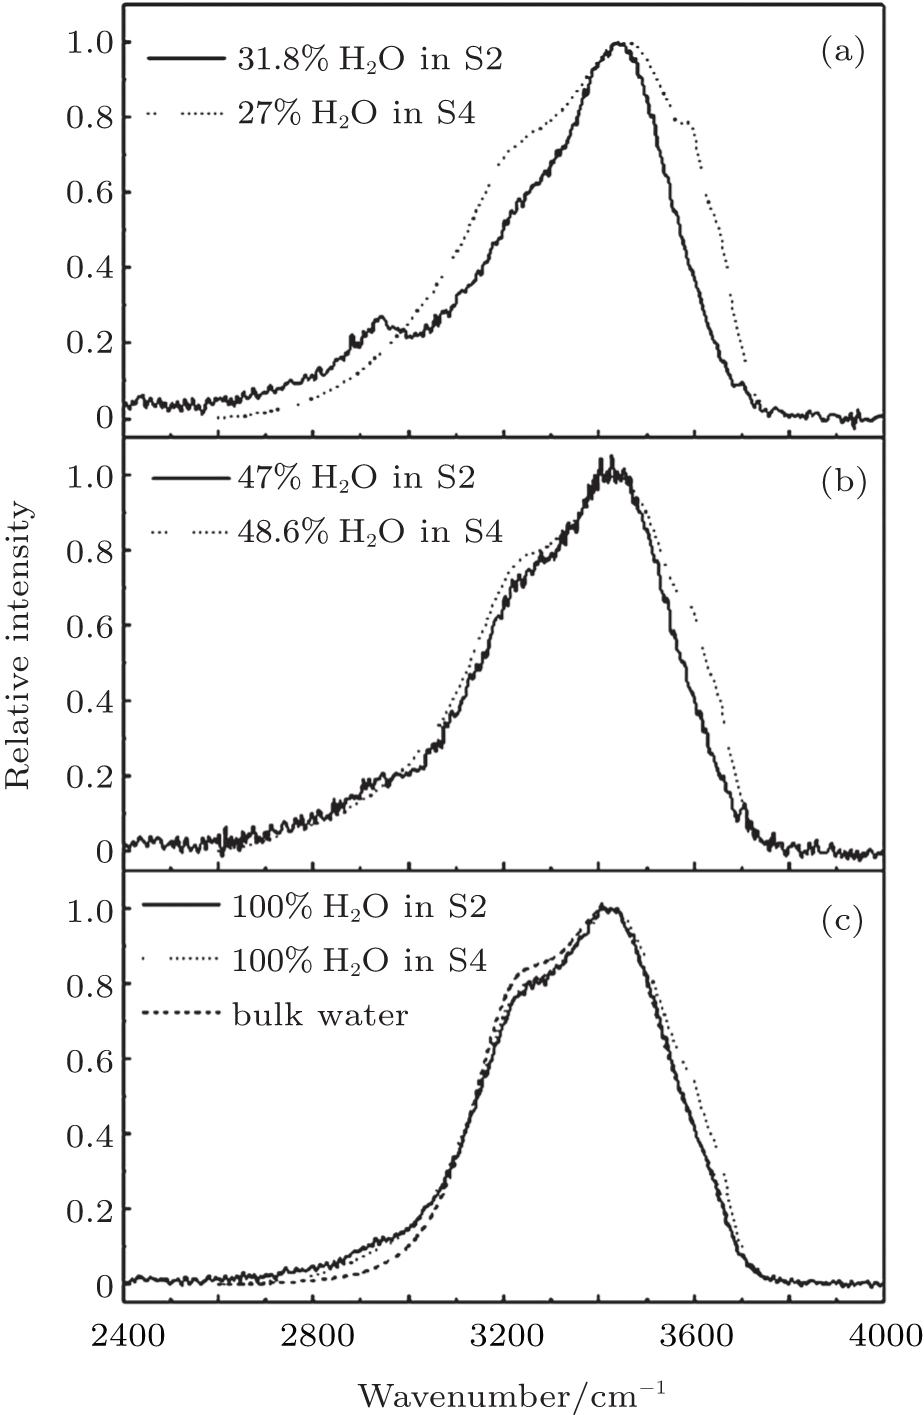 | Fig. 4. Comparisons among the stretching bands of H2O adsorbed in S2 and S4 with similar filling fractions. |
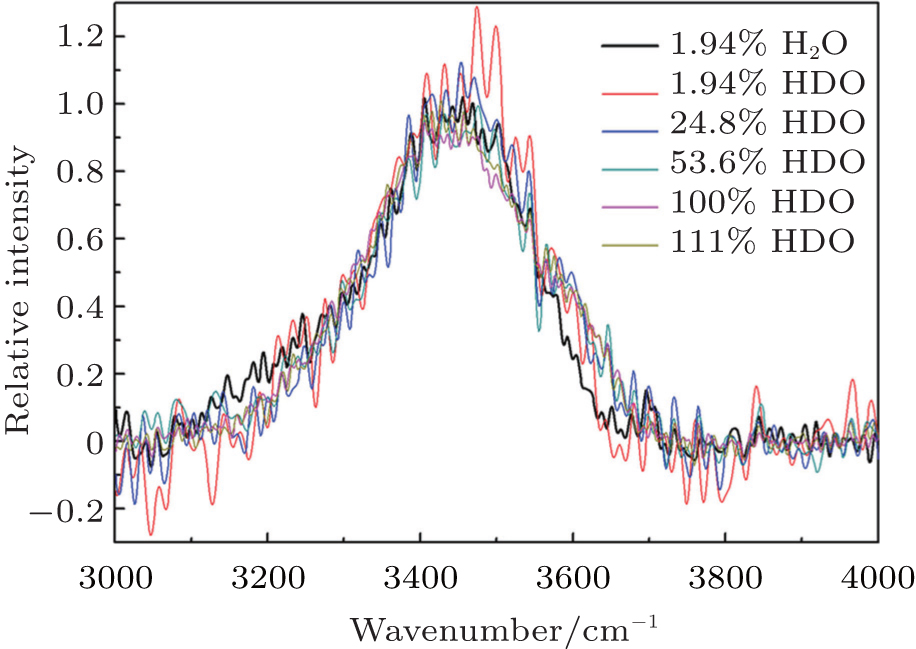
To further study the influence caused by TiO2, D2O is used to decouple the bond of H–O–H,[47,51–54] so that we can confirm whether the TiO2 has an influence on the asymmetric vibration of water molecule. When D2O and H2O are mixed together, a dynamic equilibrium can be realized according to the following chemical equation:

Based on the following equation:

 | Fig. 5. Raman spectra of HDO with different filling fractions in S1. |
Because there exists only a small fraction of HDO in the mixture we prepared, single-noise ratio of Raman peak of H–O is poor, but we can still compare the results well as shown in Fig.
Confined water absorbed in nanoporous materials such as TiO2 and SiO2 is realized by the method of saturated vapor of saturated salt solution in this work. Based on Raman measurements, the vibrations of water molecule confined in nanoporous materials are studied in detail, and the results show that the features of confined water are very different from those of bulk water. The main conclusions can be obtained as follow.
| 1 | |
| 2 | |
| 3 | |
| 4 | |
| 5 | |
| 6 | |
| 7 | |
| 8 | |
| 9 | |
| 10 | |
| 11 | |
| 12 | |
| 13 | |
| 14 | |
| 15 | |
| 16 | |
| 17 | |
| 18 | |
| 19 | |
| 20 | |
| 21 | |
| 22 | |
| 23 | |
| 24 | |
| 25 | |
| 26 | |
| 27 | |
| 28 | |
| 29 | |
| 30 | |
| 31 | |
| 32 | |
| 33 | |
| 34 | |
| 35 | |
| 36 | |
| 37 | |
| 38 | |
| 39 | |
| 40 | |
| 41 | |
| 42 | |
| 43 | |
| 44 | |
| 45 | |
| 46 | |
| 47 | |
| 48 | |
| 49 | |
| 50 | |
| 51 | |
| 52 | |
| 53 | |
| 54 | |
| 55 | |
| 56 | |
| 57 | |
| 58 | |
| 59 | |
| 60 | |
| 61 |