Lattice stabilities, mechanical and thermodynamic properties of Al3Tm and Al3Lu intermetallics under high pressure from first-principles calculations
Zhang Xu-Dong1, †, , Jiang Wei1, 2
School of Science, Shenyang University of Technology, Shenyang 110870, China
School of Materials Science and Engineering, Shenyang University of Technology, Shenyang 110870, China


† Corresponding author. E-mail: zxdwfc@163.com

Project supported by the Scientific Technology Plan of the Educational Department of Liaoning Province and Liaoning Innovative Research Team in University, China (Grant No. LT2014004) and the Program for the Young Teacher Cultivation Fund of Shenyang University of Technology, China (Grant No. 005612).

Abstract
Abstract

The effects of high pressure on lattice stability, mechanical and thermodynamic properties of L12 structure Al3Tm and Al3Lu are studied by first-principles calculations within the VASP code. The phonon dispersion curves and density of phonon states are calculated by using the PHONONPY code. Our results agree well with the available experimental and theoretical values. The vibrational properties indicate that Al3Tm and Al3Lu keep their dynamical stabilities in L12 structure up to 100 GPa. The elastic properties and Debye temperatures for Al3Tm and Al3Lu increase with the increase of pressure. The mechanical anisotropic properties are discussed by using anisotropic indices AG, AU, AZ, and the three-dimensional (3D) curved surface of Young’s modulus. The calculated results show that Al3Tm and Al3Lu are both isotropic at 0 GPa and anisotropic under high pressure. In the present work, the sound velocities in different directions for Al3Tm and Al3Lu are also predicted under high pressure. We also calculate the thermodynamic properties and provide the relationships between thermal parameters and temperature/pressure. These results can provide theoretical support for further experimental work and industrial applications.

1. Introduction

The Al3M trialuminide compounds with L12 structure in aluminum alloys have attracted a great deal of attention recently due to their particularly attractive characteristics including low densities, high specific strengths, very high melting points and excellent oxidation resistances.[16] Among them, Al3Sc is the most studied intermetallics so far, since it has a thermodynamically stable L12 structure, relatively large volume fraction, and modest coarsening rate.[1,7,8] However, the high cost of Sc limits its industrial applications. Like Sc, Tm and Lu are cheaper than Sc and can also form thermodynamically stable L12-structured trialuminide compound.[9,10] The microstructure and mechanical properties of Tm and Lu containing Al alloys have been investigated, and it has been found that Tm and Lu can improve the creep-resistance properties of Al alloys by forming L12 structure Al3Tm and Al3Lu precipitates or solid solved in the matrix.[11] The recent studies of L12 structures Al3Tm and Al3Lu mainly focused on the electronic structure and elastic constant under ground states. Tao et al.[12] calculated the density of states and elastic modulus at the pressure of 0 GPa using first-principles calculations. Tsvyashchenko et al.[9] employed the time-differential perturbed angular correlations technique (TDPAC) to measure the parameters of hyperfine interactions in known Al3RE compounds. However, to the best of our knowledge, no first-principles calculations about the relationship between pressure and lattice stability, mechanical and thermodynamic properties for L12 structure Al3Tm and Al3Lu have been performed so far. So the effects of high pressure on phase stability, elastic constants and thermodynamic properties should be discussed for the further considerations. With the development of computer science and technology, first-principles calculations have successfully predicted the physical and chemical properties of the materials.[1321] In the present work, the first-principles calculations are performed to better clarify and understand the lattice stabilities, mechanical and thermodynamic properties for L12 structures Al3Tm and Al3Lu under high pressure.

2. Computational methods

The first-principles calculations are based on density functional theory (DFT) and employ the plane-wave pseudo-potential total energy method as implemented in the VASP code.[22] Projector augmented wave (PAW) functions were used and exchange correlation functional was treated using the generalized gradient approximations (GGA) of the Perdew–Burke–Ernzerhof (PBE). The k-point meshes for Brillouin zone sampling were constructed using the Monkhorst–Pack scheme. The 12×12×12 k-point meshes were used for Al3Tm and Al3Lu. Spin polarization was considered in all calculations. The kinetic cut-off energy of 500 eV has been tested to be sufficient for convergence. The convergence of the energy was less than 1.0×10⁻⁵ eV. Force was converged to less than 1.0×10⁻⁴ eV·Å−1. In order to obtain the vibrational properties, we carried out the phonon calculation by using the supercells approach and used the 3×3×3 supercells for Al3Tm and Al3Lu. Real-space force constants were calculated using the density functional perturbation theory (DFPT) with the VASP code. Phonon frequencies were calculated by using the PHONOPY code.[23]

3. Results and discussion

In the present work, L12 structure Al3Tm and Al3Lu belong to face-centered cubic crystal structures, each with space group Pm3m (No. 221). In the unit cell, the Tm/Lu and Al atoms occupy the Wyckoff site 1a (0, 0, 0) and 3c (0, 1/2, 1/2), respectively. The experimental lattice parameters of Al3Tm and Al3Lu are 4.2215 Å and 4.2947 Å.[24] In order to determine the thermodynamic stabilities for Al3Tm and Al3Lu, we calculate the formation enthalpies for Al3Tm and Al3Lu. The calculated results are −40.4 kJ/mol and −39.1 kJ/mol for Al3Tm and Al3Lu, respectively. The obtained results agree well with the available experimental values.[24] We can note that Al3Tm has a stronger thermodynamic stability than Al3Lu since Al3Tm possesses the lower values of formation enthalpy.

3.1. Vibrational properties and dynamical stability

The vibrational properties play an important role in determining the physical properties of solids, such as dynamical stabilities, phase transitions, electron–phonon interactions and heat conductions and so on. We calculate the phonon spectra of Al3Tm and Al3Lu and examine their dynamical stabilities. The phonon spectrum curves at arbitrary values of wave vector q of the Brillouin zone (BZ) for Al, Al3Tm and Al3Lu are shown in Figs. 1 and 2. In Fig. 1, we show the phonon dispersion curves of Al. The calculated values are plotted as solid lines. The experimental data from the inelastic neutron scattering measurement[25] are plotted as circles. The calculated values are in good agreement with the experimental data, indicating that our computational method is reliable. Figure 2 shows the phonon dispersion curves for Al3Tm and Al3Lu along ΓXMΓR directions in the first Brillouin zone at 0, 50, 100 GPa. The shapes of phonon spectrum curves are similar to each other. As the unit cells of Al3Tm and Al3Lu each contain 4 atoms, there are 12 phonon branches, which contain 9 optical modes and 3 acoustic modes. Phonon calculations can provide a criterion for crystal dynamical stability and indicate structural stability through the non-appearance of mode softening. As can be seen from Figs. 2(a) and 2(b), all phonon modes have positive frequencies, indicating the dynamical stabilities of these compounds in the L12 structure at 0 GPa. The total and partial densities of phonon states (PHDOS) are displayed in Fig. 3. The PHDOS curves can be divided into three distinct regions. The low frequency region belongs to the acoustic modes and derives from the hybridization of the vibrational motions of Al and Tm/Lu atoms in the low frequency range of the phonon spectrum. The middle and high frequency regions result from optical modes, and are dominated by the vibration motions of Al atoms. Figure 2 also shows phonon spectra of Al3Tm and Al3Lu at 50 GPa and 100 GPa. In Fig. 2, there is neither negative frequency nor mode softening at 50 GPa and 100 GPa, indicating that Al3Tm and Al3Lu will keep L12 structure stable from 0 GPa to 100 GPa. Some numerical values at high symmetry point Γ are listed in Table 1. When the pressure increases, we can see that most mode frequencies move up to a higher frequency and the band gap between the highest optical branches and the rest of the phonon branches has already disappeared. The phenomenon results from the shorter bond length with increasing pressure. The shorter bond can lead to the larger force constants and higher phonon frequencies.[26]

Fig. 1. Phonon dispersion curves of Al and the circles correspond to the experimental data.
Fig. 2. Phonon dispersion curves for Al3Tm (a) and Al3Lu (b) under different pressures.
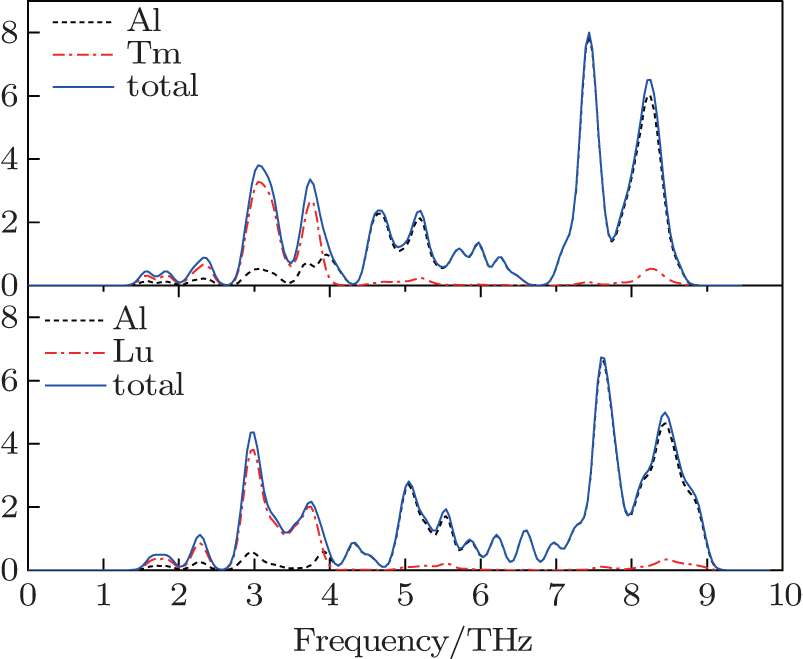
Fig. 3. Calculated total and partial densities of phonon states for L12 Al3Tm, and Al3Lu at 0 GPa.
Table 1.

Phonon frequencies (in THz) at the Γ point for L12 Al3Tm, and Al3Lu at different pressures (in GPa).

.
3.2. Elastic properties and elastic anisotropy

For elastic constants, we employ the stress-strain method proposed by Shang et al.[27] to calculate the elastic constants and use the Voigt–Reuss–Hill method[28] to obtain the Bulk modulus B, Young’s modulus E and shear modulus G. The value of bulk modulus (in GPa) B = (BV+BR)/2, where BV and BR are the Voigt’s and the Reuss’s bulk modulus respectively. The value of shear modulus G = (GV + GR)/2, where GV and GR are the Voigt’s and the Reuss’s shear modulus respectively. They are defined respectively as

Using the two formulas:

the polycrystalline Young’s modulus E (in GPa) and Poisson’s ratio v are obtained. These constants are listed in Table 2. At 0 GPa, the values of elastic properties of Al3Tm and Al3Lu are in good agreement with the previously reported results.[12] Under different pressures, the calculated elastic constants all satisfy the mechanical stability criteria, C11C12 > 0, C11 > 0, C44 > 0, C11 + 2C12 > 0, C12 < B < C11, indicating that L12 Al3Tm and Al3Lu will keep mechanically stable for the considered pressures ranging from 0 GPa to 100 GPa. These elastic constants and elastic moduli versus pressure are plotted in Fig. 4. The calculated values of elastic constant (Cij) and mechanical moduli (B, G, E) of Al3Tm and Al3Lu exhibit similar trends and increase almost linearly with the increasing pressure. We can note that the elastic constant C11 of Al3Lu is slightly bigger than those of Al3Tm under different pressures. Because C11 indicates the resistance to linear compression along the x direction, Al3Tm is more compressible along the x axis than Al3Lu. Elastic constants C12 and C44 are less sensitive to the increasing of pressure than C11. Moreover, the corresponding values of elastic moduli B and G of Al3Lu are larger than those of Al3Tm, indicating that Al3Lu is likely to be harder than Al3Tm. The brittleness of the compound is related to Poisson’s ratio v. If Poisson’s ratio v is less than 0.26, the compounds will be brittle materials.[29] The value of v for Al3Tm increases from 0.17 to 0.214 and that for Al3Lu increases from 0.168 to 0.234 with pressure increasing from 0 GPa to 100 GPa. However, the values of v of Al3Tm and Al3Lu under high pressure are still less than 0.26, indicating that Al3Tm and Al3Lu are both brittle in the whole range. The value of B/G is consistent with that of v, which is also related to the brittleness. The critical value which classifies materials as being ductile and brittle is 1.75; i.e., if B/G > 1.75, the material has a ductile behavior; otherwise the material is brittle. In Table 2, these values of B/G for L12 Al3Tm and Al3Lu are smaller than 1.75 with increasing pressure, suggesting that two compounds are both brittle in the considered pressure range.

Table 2.

Elastic constants and elastic moduli (in GPa) of L12 Al3Tm, and Al3Lu at different pressures (GPa).

.
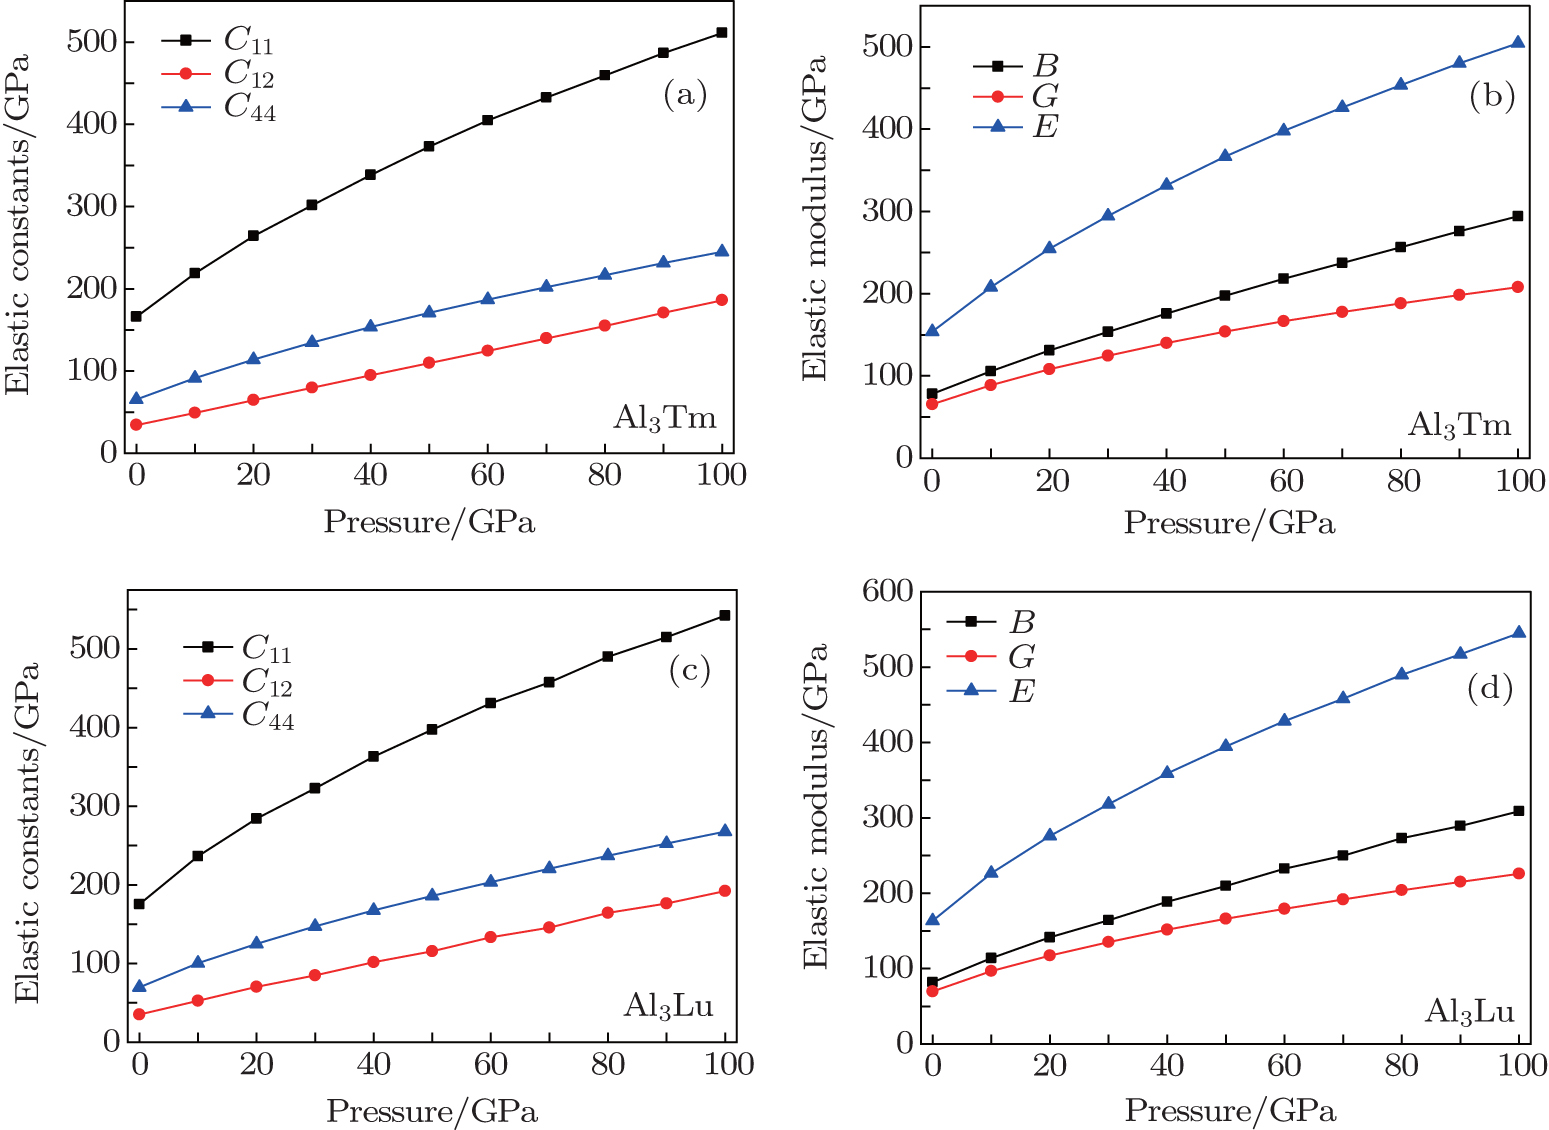
Fig. 4. Elastic constants and elastic moduli of Al3Tm and Al3Lu at different pressures.

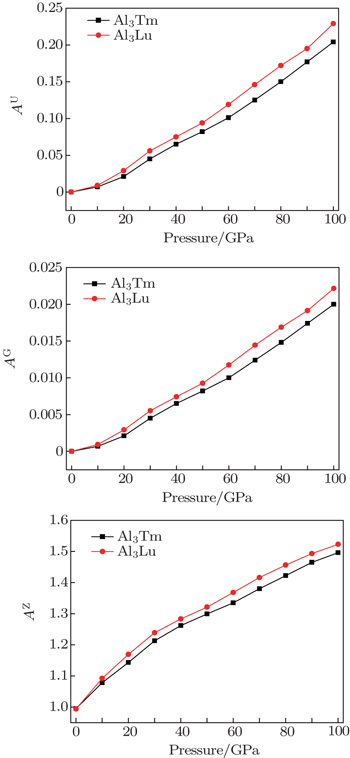
The elastic anisotropy constant is an important parameter of material and has many industrial and technological applications. Based on calculated elastic constants and moduli, we employ three methods to estimate the anisotropies for L12 Al3Tm, and Al3Lu. Zener factor AZ, Chung–Buessem anisotropy index AG, and universal elastic anisotropy index AU have been proposed as follows:[3032]

The calculated dependences of anisotropic factors (AZ, AG, AU) on pressure for Al3Tm and Al3Lu are shown in Fig. 5. It is noted that the various tendencies of AZ, AG, and AU are very similar for two compounds. For the Chung–Buessem anisotropy index AG, 1 represents the largest anisotropy and 0 refers to elastic isotropy. The AG values of Al3Tm and Al3Lu deviate from 0 with increasing pressure, indicating that they are anisotropic. The universal elastic anisotropy index AU is equal to zero, namely the crystal with the value of AU = 0 is elastically isotropic. At 0 GPa, the values of AU for Al3Tm and Al3Lu are close to 0, indicating that they are both isotropic. However, the values of Al3Tm and Al3Lu deviate from 0 as pressure increases, indicating that they are anisotropic. For the Zener factor AZ, the vales of Al3Tm and Al3Lu deviate from 1 with the increase of pressure, and we can also regard Al3Tm and Al3Lu as being elastically anisotropic under high pressure. In Fig. 5, the values of AZ, AG, and AU of Al3Lu are larger than those of Al3Tm. It indicates that both Al3Tm and Al3Lu exhibit anisotropy. In the meantime, the anisotropy increases with the increasing of pressure, and Al3Lu has more of an anisotropic feature than Al3Tm in the whole pressure range.

Fig. 5. Pressure dependences of anisotropic factors (AU, AG, AZ) for Al3Tm and Al3Lu.

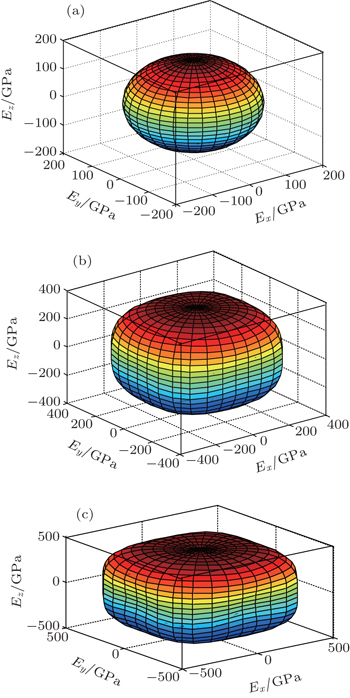
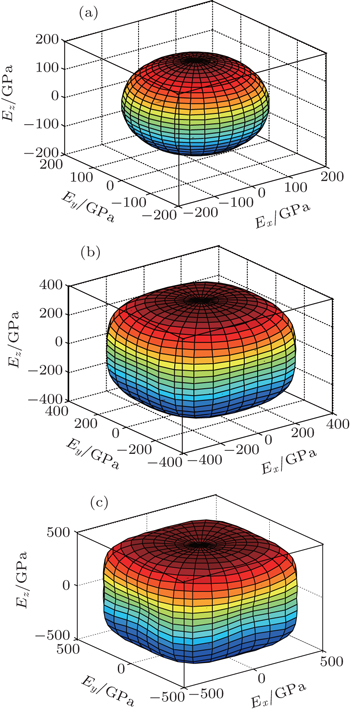
In order to further describe the elastic anisotropies for Al3Tm and Al3Lu, we plot the three-dimensional (3D) curved surface of Young’s modulus E in a given direction. The surface of 3D Young’s modulus E can be determined by using the following equation:[33]

In Eq. (7), the constants S11, S12, and S44 are the elastic compliance constants. l1, l2, and l3 are the direction cosines between the loading direction and three coordinate axes. Sijs are obtained from the inverse of the matrix of the elastic constants Cij. For an isotropic material, the 3D curved surface should exhibit a spherical shape. In the meantime, the deviation degree from the spherical surface indicates the extent of anisotropy. The 3D figures of Al3Tm and Al3Lu under different pressures are plotted in Figs. 6 and 7. In Figs. 6 and 7, each of the 3D surfaces of the Al3Tm and Al3Lu at 0 GPa obviously has a spherical shape and exhibits a noticeable isotropy. The degrees of deviation from the sphere for Al3Tm and Al3Lu increase with increasing pressure, which indicates that each Young’s moduli for Al3Tm and Al3Lu shows an increasing elastic anisotropy under high pressure. In the meantime, we can note that the degree of deviation from the spherical surface of Al3Lu is slightly bigger than that of Al3Tm under high pressure, which indicates that Al3Lu has slightly bigger anisotropy than Al3Tm. We can note that this result is consistent with the analyses of anisotropy factors (AZ, AG, AU) under high pressure. As pressure increases, we can see that the elastic anisotropy becomes bigger under high pressure. The phenomenon results from the shorter bond length with increasing pressure. The shorter bond can lead to the larger force constants, which will make Al3Tm and Al3Lu more anisotropic.

Fig. 6. Directional dependences of Young’s modulus for Al3Tm at 0 GPa (a), 50 GPa (b), and 100 GPa (c), the axes are in units of GPa.
Fig. 7. Directional dependences of Young’s modulus for Al3Lu at 0 GPa (a), 50 GPa (b), and 100 GPa (c), the axes are in units of GPa.
3.3. Anisotropic sound velocity and Debye temperature under pressure

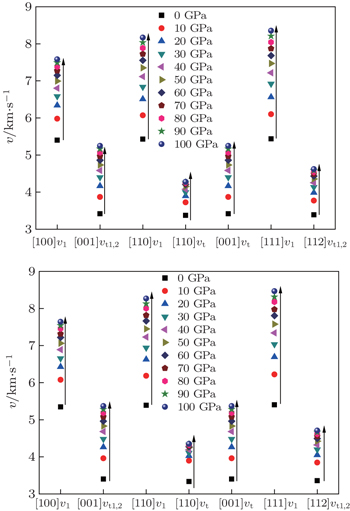
The sound velocities in solids are related to their elastic constants, thermal conductivities, and phonon frequencies. For L12, Al3Tm, and Al3Lu, we calculate the sound velocities of longitudinal (vl) and transverse waves (vt) along the [100], [110], and [111] crystal directions. We calculate sound velocities by using the following equations:[34,35]

Table 3.

Sound velocities along different directions (km/s) and for different values of ρ (g/cm3) for L12, Al3Tm, and Al3Lu at different pressures (GPa).

.

The calculated sound velocities along three directions of Al, Al3Tm, and Al3Lu are presented in Table 3. These calculated values of Al in this work are in good agreement with the available calculated and experimental results.[36,37] We can note that compounds with smaller densities and larger elastic constants exhibit larger sound velocities. The sound velocities along different directions at different pressures for Al3Tm and Al3Lu are shown in Fig. 8. We can note that the sound velocities in the directions increase with the increasing of pressure in Fig. 8. At a given pressure, the corresponding sound velocities in different directions of Al3Tm are smaller than those of Al3Lu.

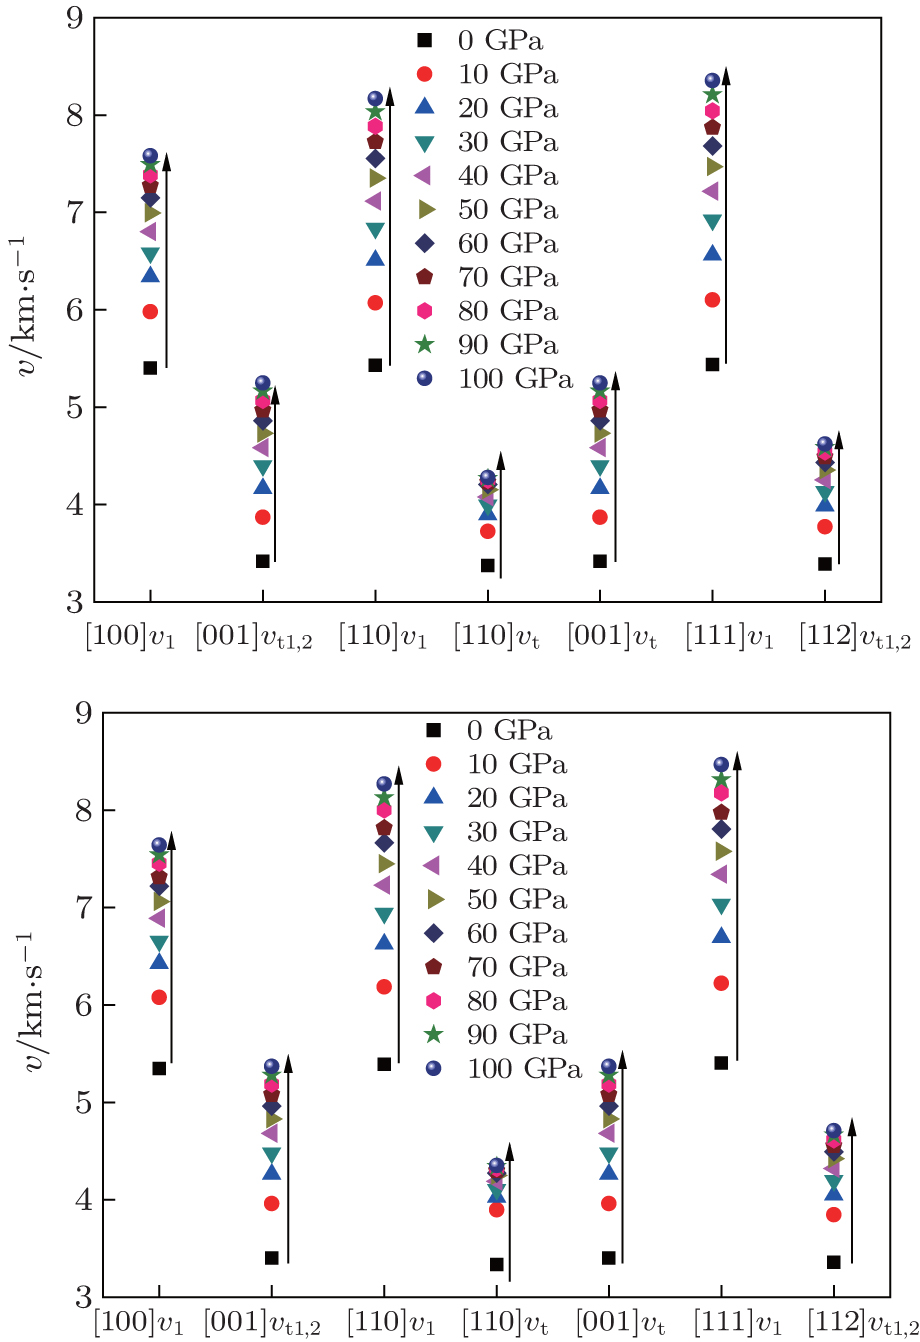
Fig. 8. Sound velocities along different directions for Al3Tm (a) and Al3Lu (b), each as a function of pressure.

The Debye temperature is an important parameter describing the material thermodynamic properties in solid state physics. We calculate the Debye temperatures of Al3Tm and Al3Lu by using the average sound velocities from the following equations:[37]

where h is the Planck constant, NA is the Avogadro number, M is the molecular weight, ρ is the density, kB is the Boltzmann constant, n is the number of atoms per formula unit, and vm is the average sound velocity. The calculated values of sound velocity and Debye temperature ΘD of Al, Al3Tm, and Al3Lu are listed in Table 4. In Table 4, the calculated values of the present work are also in good agreement with the available calculated and experimental results.[12,3638] From Table 4, we can note that the elastic wave velocities of Al3Tm and Al3Lu increase with increasing pressure. At high pressure, the increases of sound velocities become slower. We can also note that Debye temperatures of Al3Tm and Al3Lu increase with increasing pressure in Table 4. To describe the dependences of Debye temperature on the applied pressure, a nonlinear three-order polynomial is fitted up to 100 GPa. The polynomials obtained for L12 structures Al3Tm and Al3Lu are respectively as follows:

We can note that the values of zero-pressure Debye temperature ΘD are 411 K and 404 K for Al3Tm and Al3Lu respectively. The errors between the fitting ΘD and calculated ΘD in Table 3 are less than 1%. It indicates that the relationships between ΘD and pressure for Al3Tm and Al3Lu are reliable. In the meantime, Al3Tm possesses a higher Debye temperature than Al3Lu in the whole pressure range. The increases of ΘD correspond to normal vibrations of Al3Tm and Al3Lu strengthening with pressure rising.

Table 4.

Elastic wave velocities (m/s) and the Debye temperatures (K) for Al, Al3Tm, and Al3Lu.

.
3.4. Thermodynamic properties

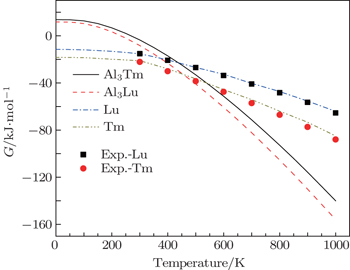
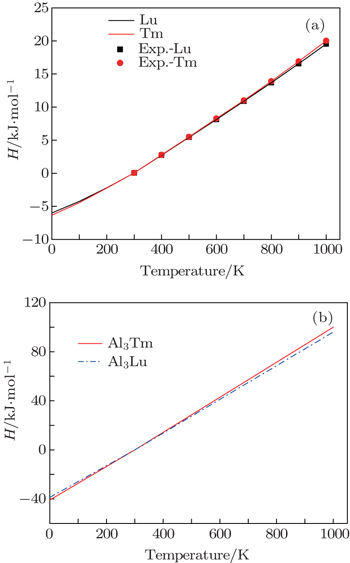
We calculate the thermodynamic properties of Al3Tm and Al3Lu by using the quasi-harmonic approximation (QHA) theory. In order to verify the correctness of the computational method, we calculate the values of Gibbs free energy (G) and enthalpy (H) of pure Tm, Lu, Al3Tm, and Al3Lu at 0 GPa. In Figs. 9 and 10, we can note that our calculated results for Tm and Lu agree well with the available experimental values reported by Barin.[39] It indicates that our method is reasonable. In Fig. 9, we can note that the Gibbs free energy curves are similar to each other and move down with increasing temperature for Al3Tm and Al3Lu. The smaller the values of Gibbs free energy, the better the thermal stability of material will be. So Al3Tm has the better thermal stability than Al3Lu in a temperature range from 0 K to 1000 K. Figure 10 shows the linear variations of enthalpy (H) with temperature for Al3Tm and Al3Lu at 0 GPa. In order to further discuss the thermodynamic properties, we also calculate the thermal expansion coefficient α, specific heat capacity CP, and entropy S. The thermal expansion coefficients α under high pressure are shown in Fig. 11. In the low temperature region (T < 300 K), the coefficient increases rapidly with increasing temperature and then increases smoothly and slowly at high temperatures. The thermal expansion becomes slower with the increase of pressure and keeps unchanged basically at high temperature. Figure 11 also shows the calculated values of specific heat capacity CP of Al3Tm and Al3Lu. At 0 GPa, the values of CP are proportional to T3 in the low temperature range and become linear with the increase of temperature in the high temperature range. At high pressure, CP keeps unchanged with increasing temperature.

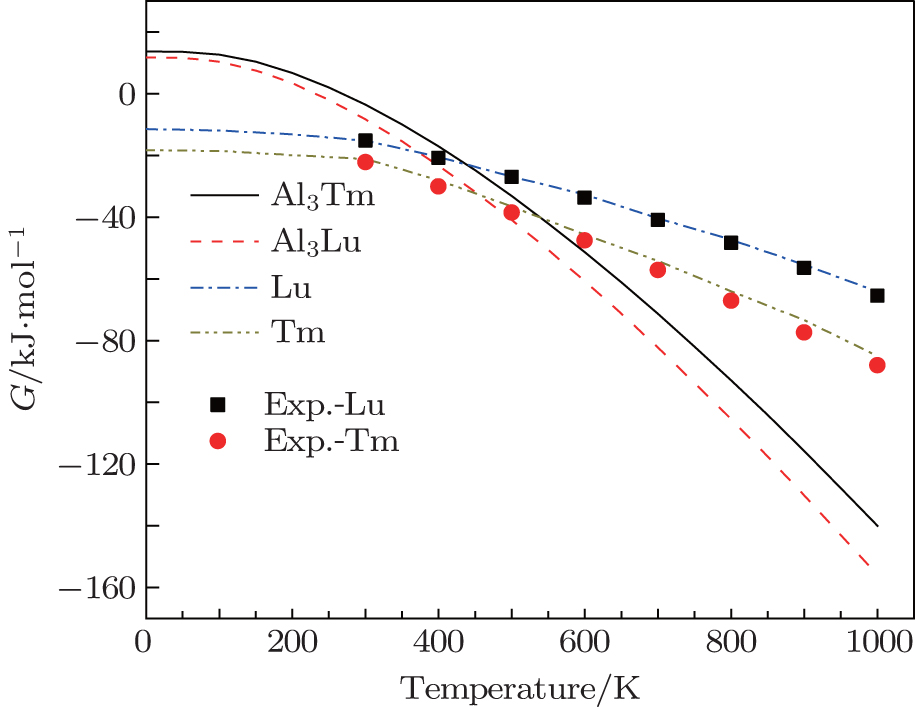
Fig. 9. Temperature dependences of Gibbs free energy for Tm, Lu, Al3Tm, and Al3Lu at 0 GPa.
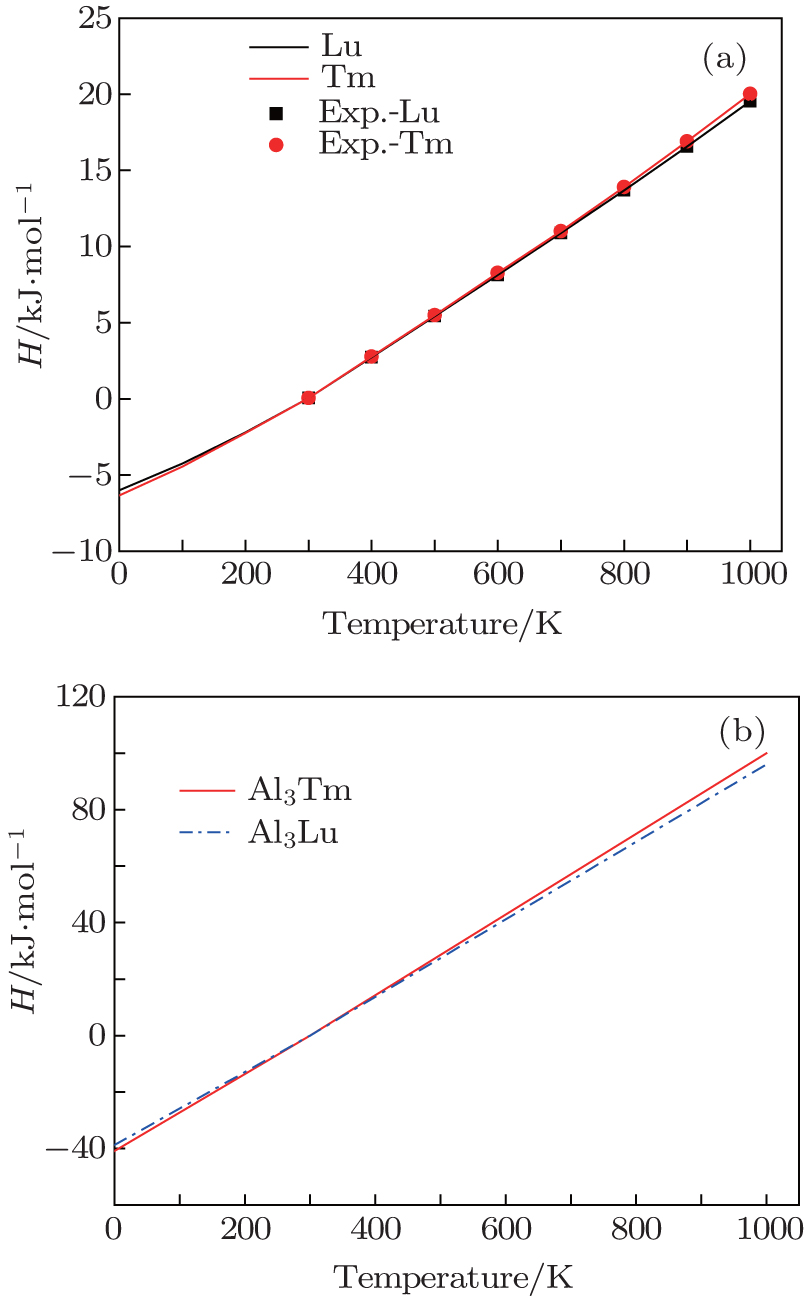
Fig. 10. Temperature dependences of enthalpy for Tm, Lu (a), Al3Tm and Al3Lu (b).
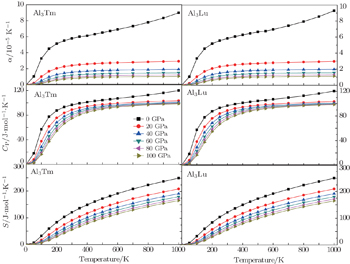
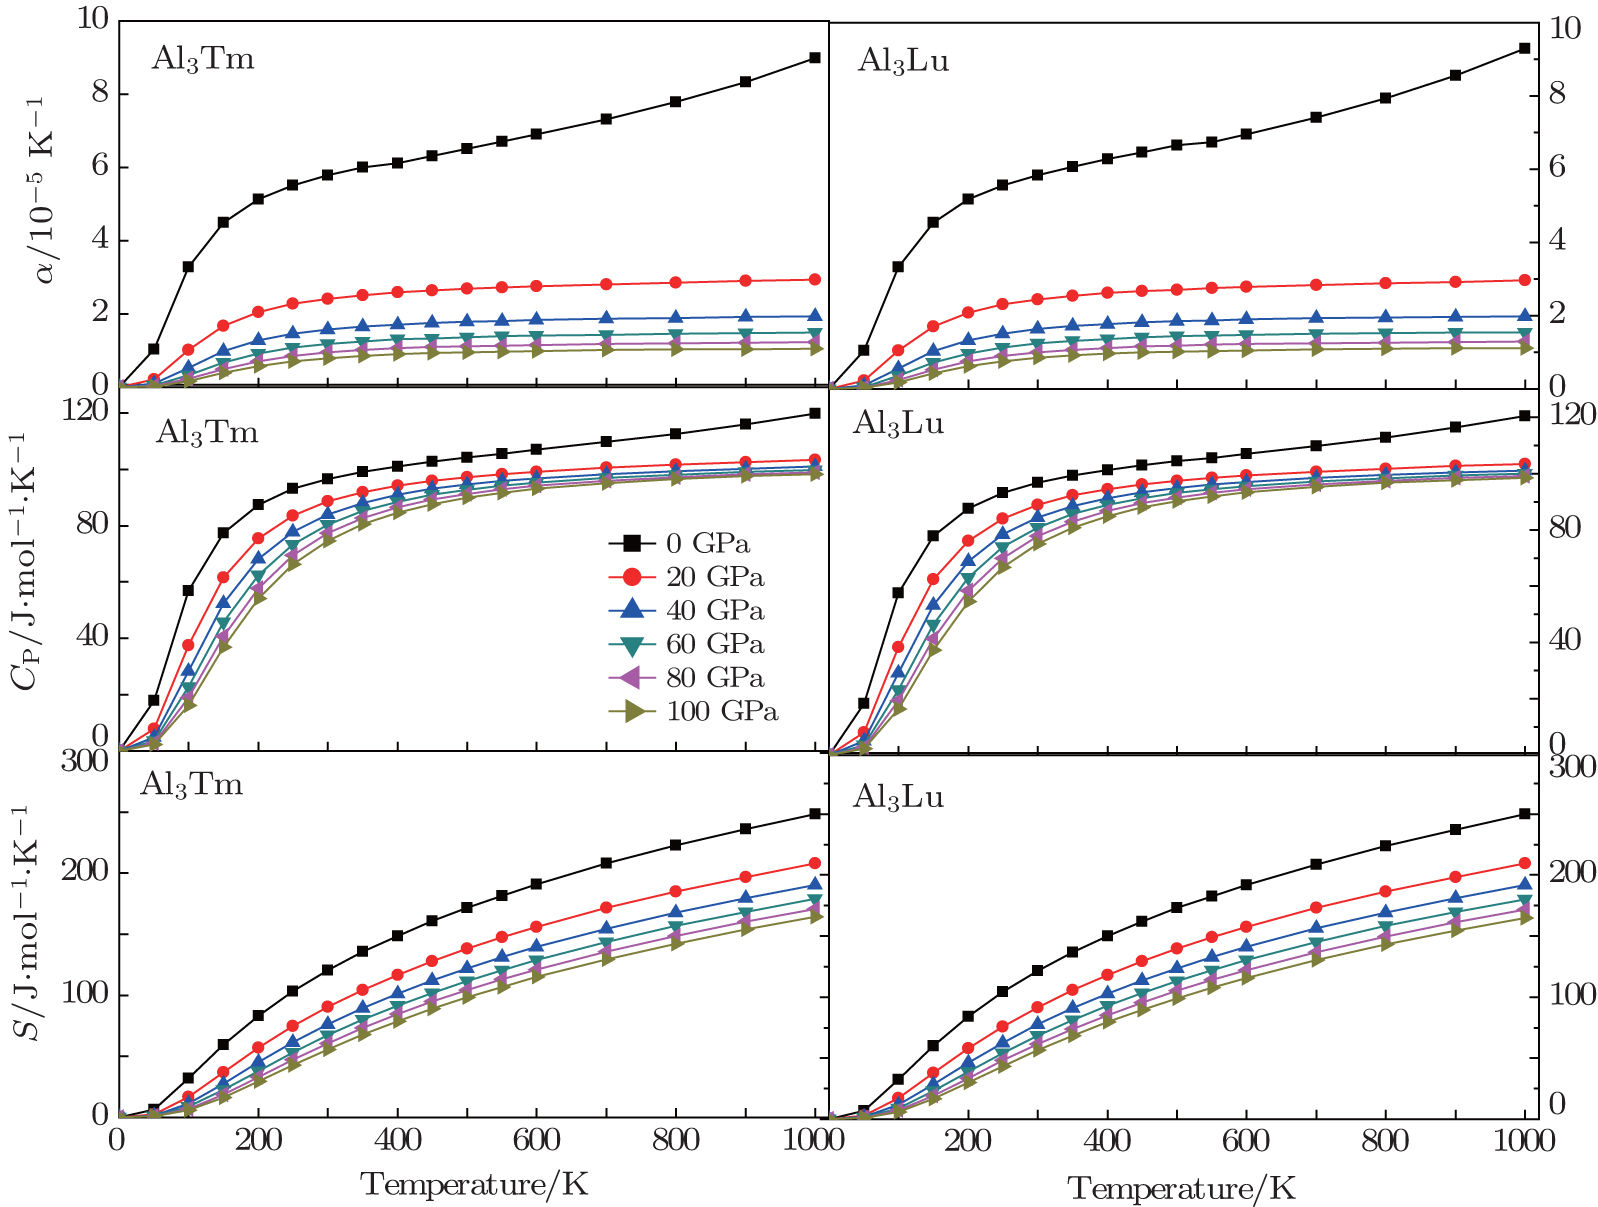
Fig. 11. Temperature dependences of thermal parameters for Al3Tm and Al3Lu.

It indicates that the increasing of pressure influences the increase of CP. The curves of entropy S at different pressures are shown in Fig. 11. The curves indicate that the entropy decreases with the increase of pressure at a given temperature. Unlike the constant pressure heat capacity CP, the high temperature dependence of entropy S is nearly insensitive to pressure. These results indicate that the effects of increasing pressure and reducing temperature on Al3Tm and Al3Lu are the same.

4. Conclusions

In this work, the dynamic stabilities, elastic and thermodynamic properties of Al3Tm and Al3Lu under high pressure are investigated by using first-principles calculations. According to the vibrational properties, we can predict that Al3Tm and Al3Lu will keep the lattice stable up to 100 GPa. The elastic constants and elastic moduli for Al3Tm and Al3Lu indicate that the two compounds keep mechanically stable and possess a brittle nature in the considered pressure range. The calculated anisotropic constants AG, AU, and AZ and 3D curved surface of Young’s modulus show that Al3Tm and Al3Lu are both isotropic at 0 GPa and are anisotropic under high pressure. The sound velocities in different directions and Debye temperatures under high pressure are also calculated for both phases. We also calculate the thermodynamics properties by the QHA method and discuss the relationships between these thermal parameters and pressure as well.

Reference
1Watanabe CKondo TMonzen R 2004 Metall. Mater. Trans. A 35 3003
2Knipling K EDunand D CSeidman D N 2007 Microscopy and Microanalysis 13 503
3Wen S PGao K YLi YHuang HNie Z R 2011 Scripta Mater. 65 592
4Booth-Morrison CDunand D CSeidman D N 2011 Acta Mater. 59 7029
5Karnesky R ADunand D CSeidman D N 2009 Acta Mater. 57 4022
6van Dalen M EGyger TDunand D CSeidman D N 2011 Acta Mater. 59 7615
7Karnesky R Avan Dalen M EDunand D CSeidman D N 2006 Scripta Mater. 55 437
8van Dalen M EKarnesky R ACabotaje J RDunand D CSeidman D N 2009 Acta Mater. 57 4081
9Knipling K EDunand D CSeidman D N 2006 Zeitschrift fur Metallkunde 97 246
10Tsvyashchenko A VFomicheva L NBrudanin V BKochetov O ISalamatin A VVelichkov AWiertel M 2007 Solid State Commun. 142 664
11Krug M EWerber ADunand D CSeidman D N 2010 Acta Mater. 58 134
12Tao X MOuyang YLiu HFeng Y 2008 Int. J. Mater. Res. 99 582
13Shi S QTanaka SKohyama M 2007 Phys. Rev. B 76 075431
14Zhang HTang YShen JXin XCui L 2011 Appl. Phys. A 104 529
15Shang S LHector L GJrShi S QQi YWang YLiu Z K 2012 Acta Mater. 60 5204
16Ouyang CDu YShi S QLei M S 2009 Phys. Lett. A 373 2796
17Tang Y HZhang HCui L XOuyang CShi S QTang W HLi HLee JChen L 2010 Phys. Rev. B 82 125104
18Shi S QQi YLi HHector L GJr2013J. Phys. Chem. C1178579
19Shi S QLu PLiu ZQi YHector L GJrLi HHarris S J 2012 J. Am. Chem. Soc. 134 15476
20Li Z LCheng X L 2014 Chin. Phys. B 23 046201
21Lu CJin X LSu T C 2014 Chin. Phys. B 23 026201
22Kresse GFurthmuller J 1996 Comput. Mater. Sci. 6 15
23Togo APhonopy http://phonopy.sourceforge.net/
24Vinet PRose JFerrante JSmith J 1989 J. Phys.: Condens. Matter 1 1941
25Dederichs P HSchober HSellmyer D J1981Phonon states of elements. Electron states and Fermi surfaces of alloysBerlin/HeidelbergSpringer
26Liu Z LYang J HCai L CJing F QAlfe D 2011 Phys. Rev. B 83 144113
27Shang SWang YLiu Z K 2007 Appl. Phys. Lett. 90 101909
28Hill R W1952Proc. Phys. Soc. London65A349
29Pugh S F 1954 Philos. Mag. 45 823
30Spoor PMaynard JKortan A 1995 Phys. Rev. Lett. 75 3462
31Ranganathan S IOstoja-Starzewski M 2008 Phys. Rev. Lett. 101 055504
32Chung DBuessem W 1967 J. Appl. Phys. 38 2010
33Peng M JDuan Y HSun Y 2015 Comput. Mater. Sci. 98 311
34Belmonte DOttonello GVetuschi Zuccolini M 2014 American Mineralogist 99 1449
35Ottonello GCivalleri BGanguly JPerger W FBelmonte DVetuschi Zuccolini M 2010 American Mineralogist 95 563
36Feng JXiao BWan C LQu Z XHuang Z CChen J CZhou RPan W 2011 Acta Mater. 59 1742
37Grimvall G1999Thermo Physical Properties of MaterialsAmsterdamNorth Holland
38Feng JXiao BZhou RPan WClarke D R 2012 Acta Mater. 60 3380
39Barin I1995Thermochemical Date of Pure SubstanceNew YorkVCHpp. 990, 1717