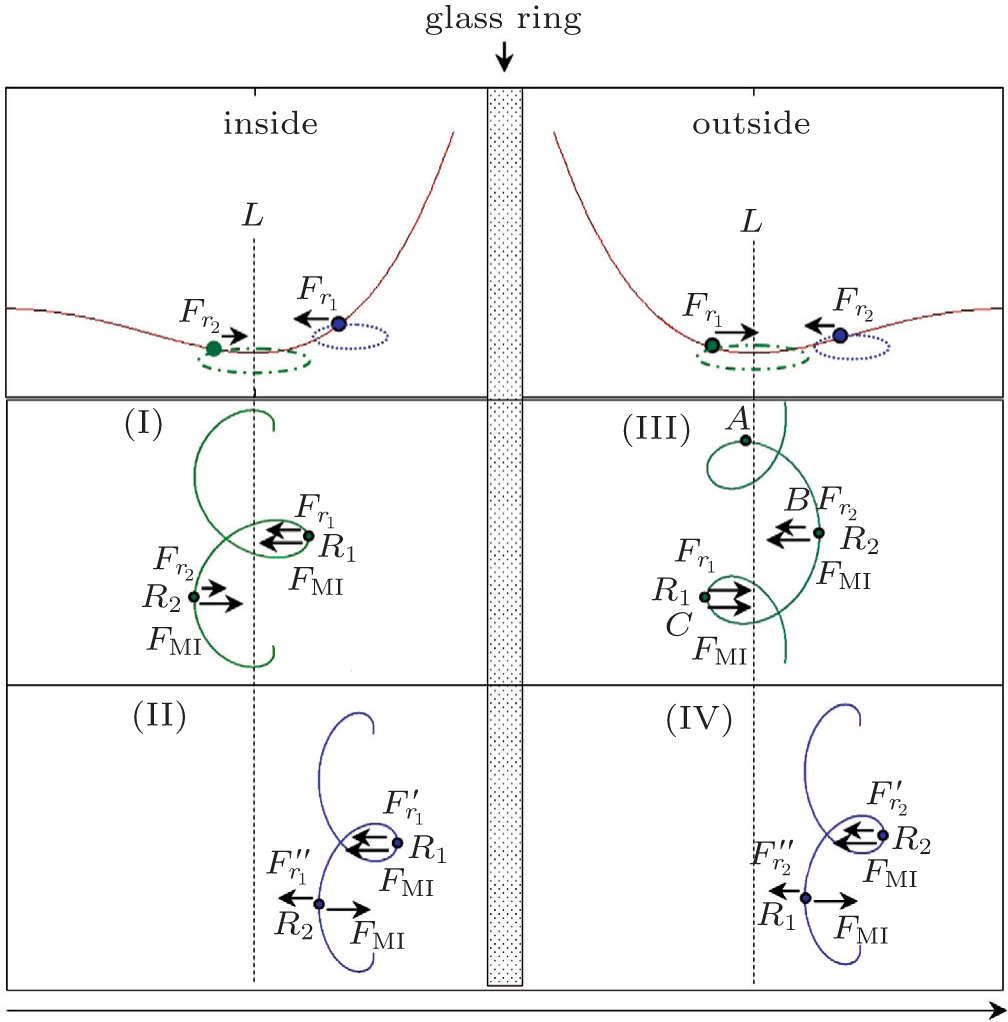
Schematic diagram of the grain trajectories. Solid lines in panel (a) illustrate the approximate profile of sheath in vertical section. Equilibrium line L (dashed line) indicates the position of the minima value of confining potential. F1 represents the horizontal component of the radially confining force when the grain is between the equilibrium line L and the glass wall. Outside this region, it is expressed as F2. Panel (b) shows four cases of complex trajectories in a horizontal plane. (I), (II), and (IV) show the hypocycloid motions, and (III) shows the epicycloid motion. FMI represents the inverse Magnus force. R1 (R2) is the cyclotron radius when the grain is near (far away from) the glass wall. |