1. IntroductionNO3 radical is a significant species during the night, affecting the formation of secondary organic aerosol (SOA) at night.[1–3] It is also the most pivotal oxidation at night, involved in the removal process of NOx and VOCs,[4–6] which is directly related to atmosphere cleanliness. The high activity, low life expectancy and extremely low density make atmospheric NO3 radicals difficult to measure.[7]
A number of different techniques based on optical absorption in the visible region,[8–14] matrix isolation electron spin resonance (MI-ESR),[15] laser-induced fluorescence (LIF),[16] and chemical ionization mass spectrometry (CIMS)[17] have been used to measure NO3 successfully. In recent years, there were three optical techniques commonly used: DOAS,[8,9] Cavity Ring-Down Spectroscopy (CRDS),[10,11] and Cavity-Enhanced Absorption Spectroscopy (CEAS).[12–14] DOAS is the most widely used analytical technique for monitoring atmospheric NO3 radicals due to being a non-contact measuring method, avoiding the influences of sampling, chemical changes and other factors on the measurement. In 1980, Platt et al. first used LPDOAS instrument to detect atmospheric NO3 radicals in polluted areas.[18] Traditional DOAS device uses a xenon lamp as a light source. Xenon lamp is a heat source with band width and powerful light. In contrast, LED light has lighter weight, smaller size, lower power consumption, less heat, more efficient and stable spectrum with no security risks, and because of the narrow-band spectral characteristics, there is no need for filters which will simplify the system.[19] The employment of LED in LPDOAS instruments has great advantages in terms of portability and miniaturization.[20–22] In 2006, Kern et al. first used a red LED with a 625-nm center wavelength as the light source of LPDOAS to measure atmospheric NO3 radicals with a 6-km optical path and the average detection limit was 16 ppt. However, intrinsic thermal drift of LED light will reduce the stability of the light source and if the spectrum shape changes, narrowband variation may occur and interfere with absorption structures of the target gas.[19] Besides, the absorption of NO3 at 623 nm is weaker than that at 662 nm, which was found to lead to lower detect sensitivity.[23]
In the present paper, a 660-nm LED is chosen as our light source and its temperature drift characteristics are tested, and a shift of as much as 0.121 nm/°C at the center wavelength and its influence on the fitting results are found. In order to improve the feasibility of the LED-LPDOAS device for detecting atmospheric NO3 radicals, we mount an LED lamp with a self-developed temperature control device, and test the stability. The LED lamp is combined with a Schmidt–Cassegrain telescope and a Y-fiber bundle.[24] A field experiment for observing the atmospheric NO3 radicals is carried out to examine the instrument.
2. Measurement principle and experimental setup2.1. Measurement principle of DOASDifferential Optical Absorption Spectroscopy (DOAS) based on Lambert–Beer absorption law uses the characteristic absorption of trace gas in light radiation to quantify the concentration.[15] Light I0(λ,L) emitted by a light source transmits through the atmosphere, and finally is received by a detector, with denoting the received light as I(λ,L), relationship between I(λ,L) and I0(λ,L) is given by

where
σj(
λ,
p,
T) is the absorption cross section of
j trace gas at the atmospheric pressure of
p, temperature of
T and wavelength of
λ;
cj(
l) is the trace gas concentration in the optical path at
l;
ɛR(
λ,
l) and
ɛM(
λ,
l) are the Rayleigh and Mie extinction at wavelength
λ, optical path
l, respectively;
N (
λ) is the noise added to the
I (
λ,
L). The basic idea of DOAS technique is to divide the gas absorption cross section into slow changes with wavelength and fast varying differential cross section. The Rayleigh scattering, Mie scattering, atmospheric turbulence and the instrument itself, weakening and waving the light, are independent of the trace gas differential absorption and show slow change characteristics. The slow change can be removed by the digital filter to obtain a differential optical density, thereby mainly retaining the trace gas quickly changing absorption. The trace gas concentration can be obtained by fitting the absorption cross section to the differential optical density.
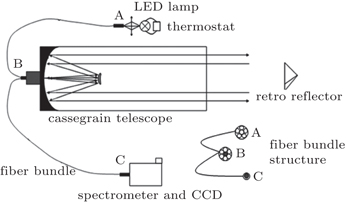
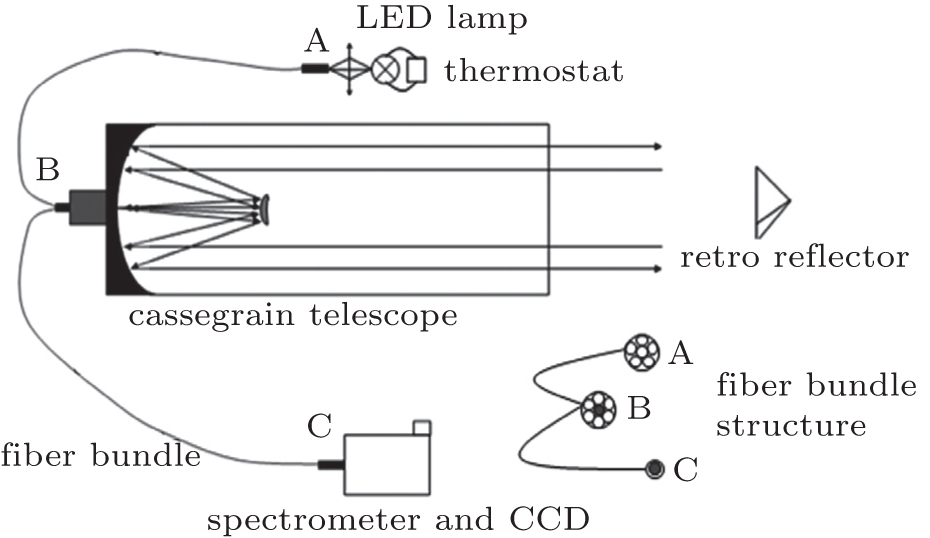
2.2. Experimental setupAs shown in Fig. 1, the experimental setup includes a Schmidt–Cassegrain telescope with 235-mm diameter, acting as transmitting and receiving component, a 5-W red LED light (LZ1-00R205, LedEngin Inc.) with a center wavelength of 660 nm, FWHM of 20 nm, an array of retro reflectors, a Y-sharp fiber bundle (six transmitting outer cores and one receiving inner core each with 200-μm diameter), spectroscopy (Andor Shamrock SR-303i), CCD detector (Andor iDus DV 420A-BU2) and computer. A diffuse reflector is utilized to realize the conversion of measuring light through or not through the atmosphere. To measure light through the atmosphere, the diffuse reflector is removed. The light emitted from LED is coupled into the fiber transmitter side A by a lens, directing through the fiber to the transceiver side B, and then transmitted by the outer cores, reflected by the telescope secondary mirror to the primary mirror, collimated and exited into the atmosphere. After some distance transmission, a nearly parallel beam is reflected by the retro reflectors and returns along the same angle optical path with a slight lateral displacement, converged into the inner core of fiber transceiver side B and transferred into the spectrometer, after being split by the spectrometer, finally received by the detector. The grating of the spectrometer is set to be 660 nm as a center wavelength, 600 grooves/mm, 500 in blaze. The spectral detection range is 595 nm–728 nm, with a resolution of 0.43 nm and the time resolution was 30 s–1 min. The detector is cooled to −30 °C, to reduce the effects of dark current. Neon is used for calibrating the spectrometer and the recorded emission line at 659.9 nm is treated as an instrument function.
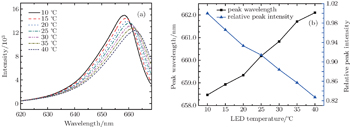
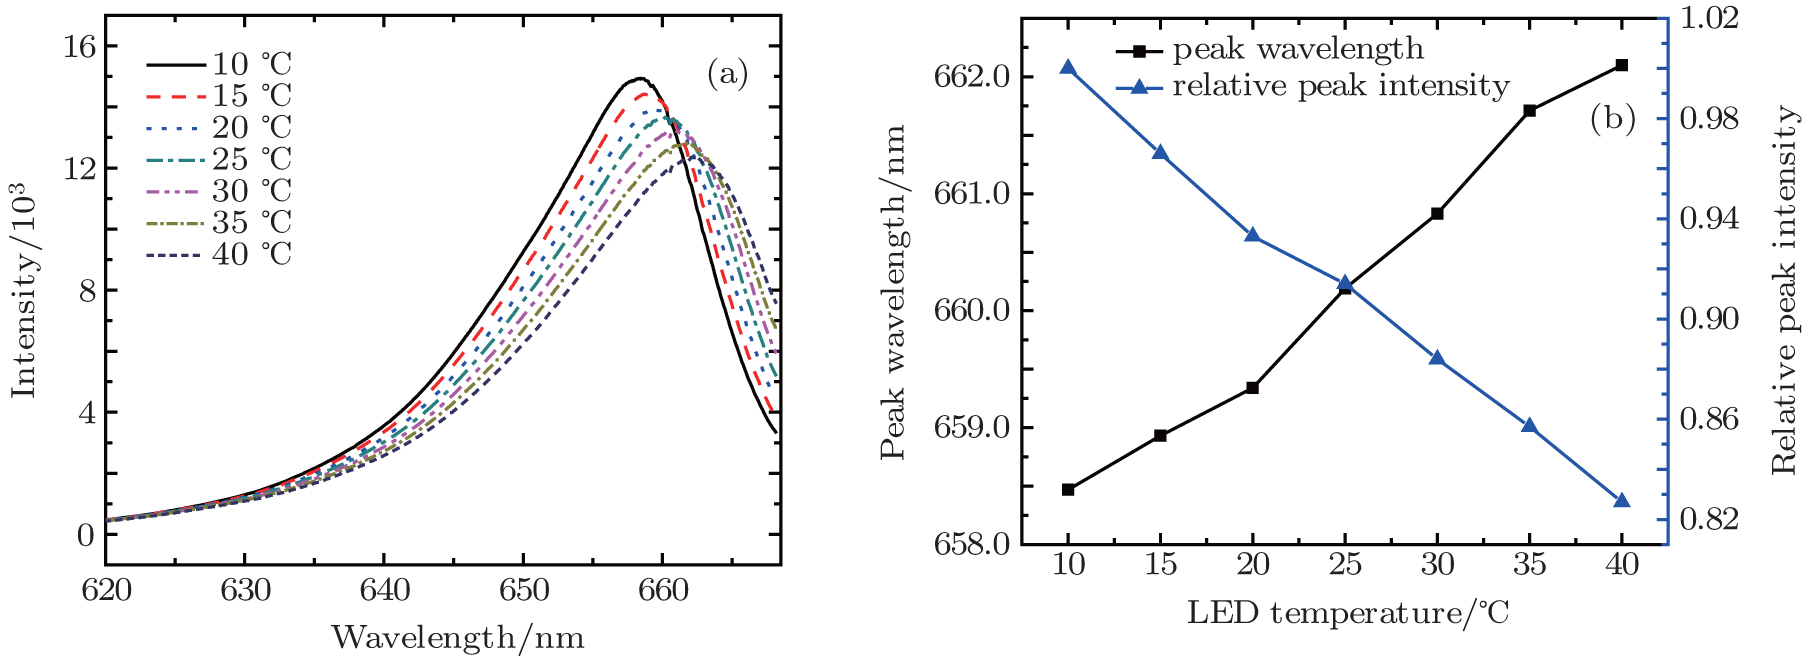
2.3. LED light stability testing2.3.1. LED temperature drift characteristicsThe LED light spectra are taken at different temperatures to test the temperature drift characteristics. The temperature is adjusted by a self-developed temperature control device (stability: ±0.1 °C) in a range from 10 °C to 40 °C, while operating current is set to be 700 mA (stability: ±1 mA). When measuring light not through the atmosphere, place a diffuse reflector in front of the transceiver side B vertically to obtain the original lamp spectrum without atmospheric absorption: the light exiting from the outer core of side B is diffusely reflected, a portion of reflection is received by the inner core of side B and then transmitted to the spectrometer. Figure 2(a) shows the LED spectral radiances taken at different temperatures. The peak spectral intensity decreases slightly and the LED spectra each have a significant red shift with temperature rising. Detailed statistics are shown in Fig. 2(b). With the temperature rising from 10 °C to 40 °C, the center wavelength shifts 3.63 nm with an average shift of 0.121 nm/°C, and the light intensity decreases by 17.3 % with a nearly linear slope of −5.77 %/°C. Experimental results show that the red LED spectra are sensitive to temperature fluctuation, which leads to detection limit increasing with fit residual enlarging.[15]
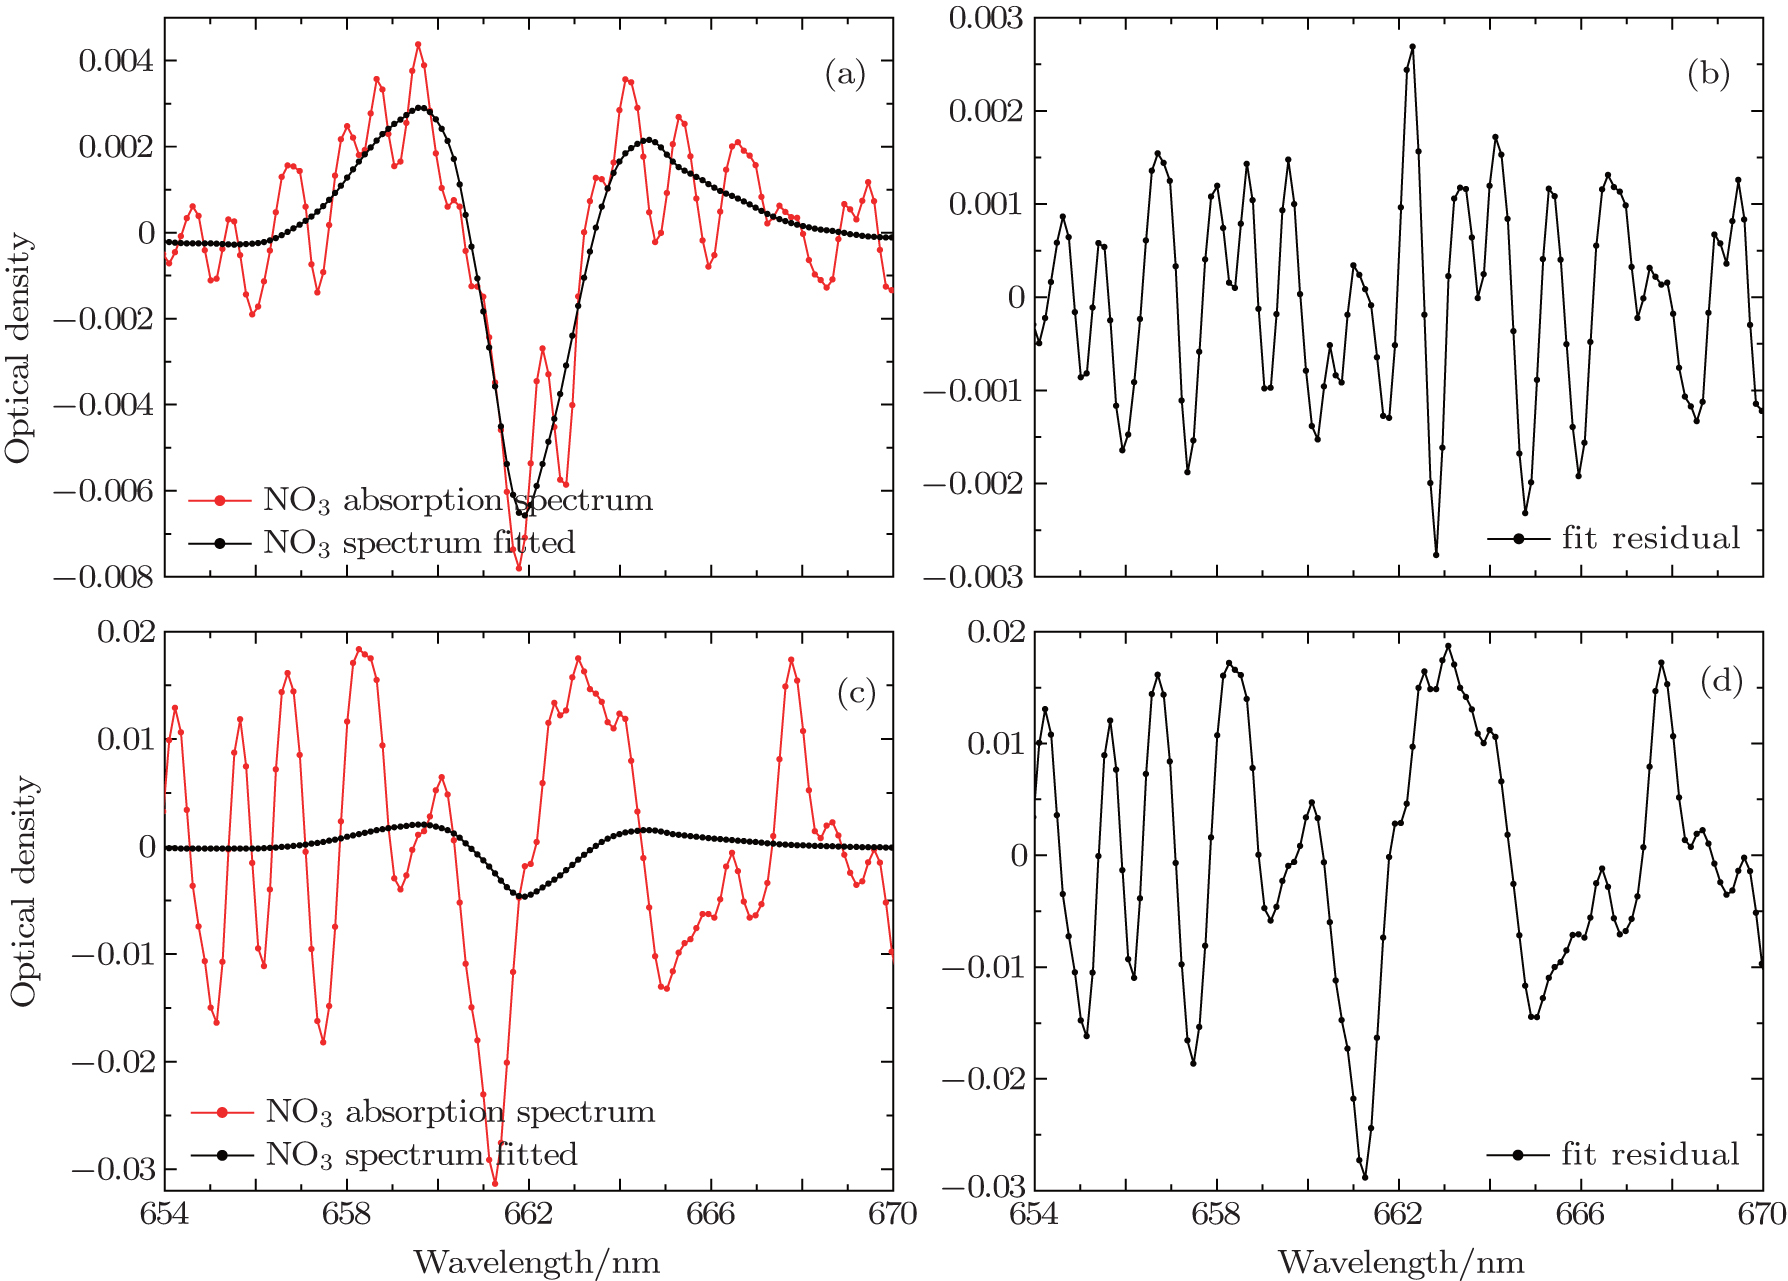
2.3.2. Influence of LED light stability on fitting resultIn order to clarify the influence of LED temperature fluctuation on data fitting, two groups of reference spectra taken under different temperature conditions are fitted to the same differential optical density (see the specific fitting process in Subsection 2.4). Figure 3 shows a comparison of fitting result between with and without stable LED temperature on the condition that the retrieval procedure and absorption spectrum are all the same while the reference spectra are taken at LED temperatures of 20 °C and 40 °C, respectively. The NO3 concentration in Fig. 3(a) is about 93 ppt. The fitting residual in Fig. 3(b) is about 0.00545 and the shape is close to the waveform of random noise. The NO3 spectrum fitted in Fig. 3(c) cannot coincide well with NO3 absorption spectrum, and the fitting residual in Fig. 3(d) is almost 9 times as great as that in Fig. 3(b). It is shown in Fig. 3 that temperature fluctuations can cause spectral displacement and significantly change the fitting results. Therefore, high temperature stability should be one of the key points to obtain high detection sensitivity.
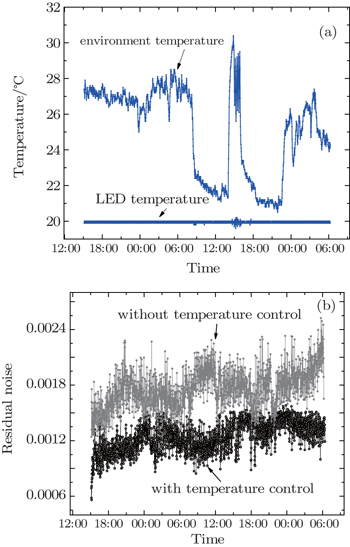
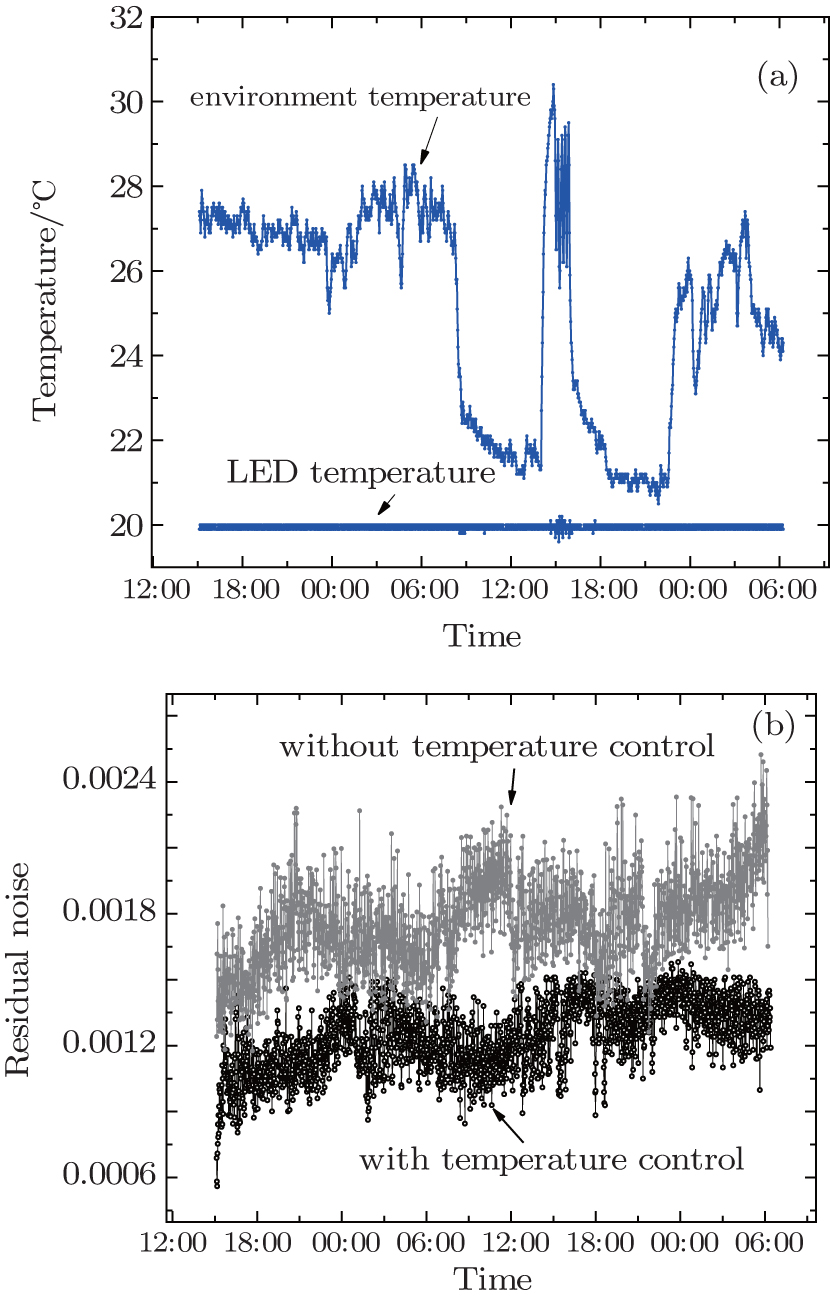
2.3.3. LED with controller stability testingIn order to ensure the stability of the light source, an LED test lasting two nights and one daytime is conducted. During the experiment, LED light operating current is set to be 700 mA, the temperature of LED with controller is set to be 20 °C and ambient temperature is adjusted by air-conditioning in the laboratory. Continuous light spectra are taken for 39 h while the temperature data are recorded by the temperature control device every one minute. All spectra are corrected for offset and dark current before being divided by the first spectrum, then high-pass filtered, and the residual noise of each processed spectrum is recorded within the NO3 fitting channel (654 nm–670 nm). Figure 4 shows the test results: LED temperature is maintained between 20 °C and 19.9 °C. When the ambient temperature changes dramatically, LED temperature is maintained between 10.2 °C and 19.7 °C. The residual noises with temperature control are all below 0.0016, while the residual noises without temperature control reaches 0.0024. Considering the same experimental conditions, it can be inferred that the factors of influencing the residual noises are the same except temperature. Therefore, it is clear that temperature control can reduce LED residual noises and improve the stability of LED spectrum.
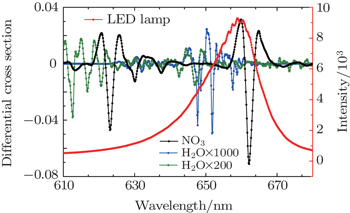
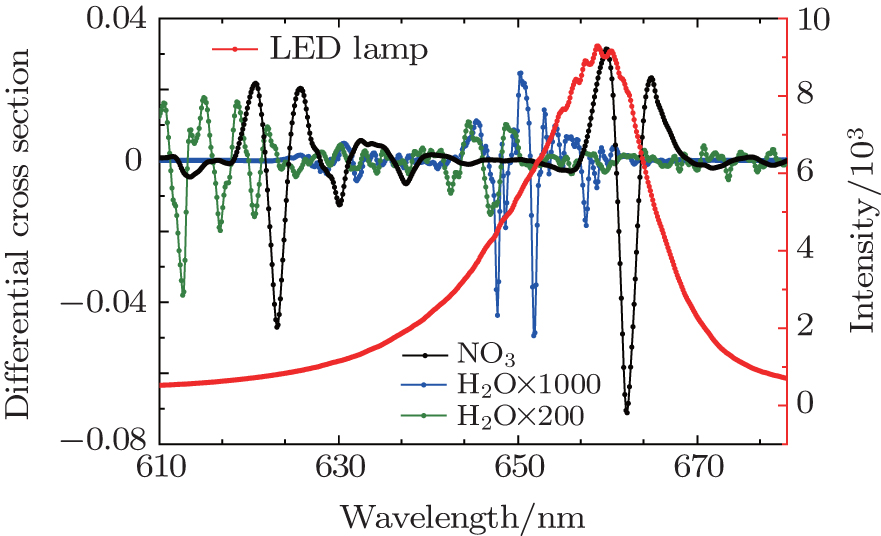
2.4. Retrieval procedure and fitting analysisIn a first step, night-time atmospheric spectra are corrected by subtracting the offset and background light spectra, removing slow change through using a high-pass filter, and smoothing the spectrum through a low-pass filter to obtain the differential optical density. Secondly, the literature high-resolution absorption cross sections of NO3,[25] NO2,[26] and H2O (from the HITRAN database)[27] are convoluted with the instrument function to be suitable for the apparatus and multiplied by the optical path to obtain the reference differential absorption cross-section. Figure 5 shows the LED light spectra measured by the LED-LPDOAS instrument and NO3, NO2, H2O reference differential absorption cross-sections. We can see that the LED spectrum has a good coverage of the stronger NO3 absorption peak. NO3 absorption spectrum has two main peaks in red band: 623 nm and 662 nm while the latter is 1.49 times as great as that of the former at peak-to-peak value, δ(σ). According to the literature, the detection limit of DOAS system Dlimit is calculated by

where
τRes is the fitting residual,
L is the optical path, and
N is the number of absorption peaks fitted. So the detection limit will be reduced by 33% in fitting the 662-nm absorption peak instead of 623 nm. Main interference is the absorption of water vapor and NO
2, while the peak-to-peak value of NO
3 differential absorption cross section is 3627 and 3103 times as great as that fitted within a wavelength range of 654 nm–670 nm. The saturated absorption of water vapor does not follow Lambert–Beer’s law which makes it the major confounding factor.
Studies[19] show that three spectra(c1, c2, c3) only with different vapor concentrations and the vapor concentrations of which follows the order: c1 < c2 < c3, when fitting c1 and c3 to c2, the water vapor structure can be deducted well according to the quite small residual structures. The daytime NO3 concentration is very low due to the photolysis, so the daytime atmospheric absorption spectrum (at solar zenith angle less than 80°) can act as a reference spectrum after using the same process to deduct water vapor and LED lamp structure. Thirdly, in the actual evaluation of NO3, two daytime spectra taken at 1.5 h before sunset and after sunrise are performed with the same procedure of the night-time atmospheric spectra, to obtain the reference spectra. Fourthly, the reference spectra with NO3, NO2, and H2O reference differential absorption cross-sections are fitted to the differential optical density to obtain the concentration of NO3 radicals. The whole retrieval procedure is implemented by DOASIS software which is developed by the Institute of Environmental Physics in Heidelberg University, Germany.[28]
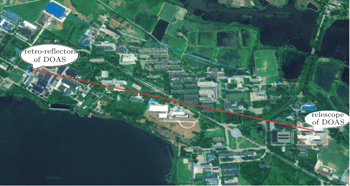
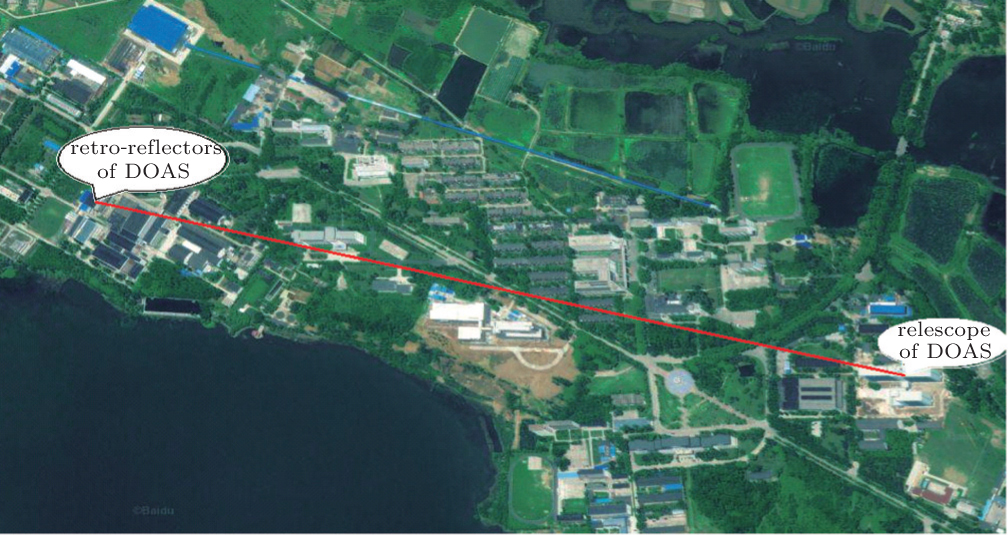
3. Field experiment3.1. Measurement locationAs shown in Fig. 6, the measurement was carried out at the Anhui Institutes of Optics and Fine Mechanics of Chinese Academy of Sciences in the Science Island, western suburb of Hefei, Anhui province, China. The telescope is placed on the 8th floor of Laboratory Building, about 25-m high above the ground. An array of retro reflectors is placed on the 5th floor of a northwest direction office building, 1305 m away from the telescope, the optical path passes above the main road (Innovation Avenue) on the Science Island, with Dongpu reservoir in the southwest. No significant pollution is found during the measurement.
3.2. Fitting example and the resultFigure 7 shows a fitting example. The NO3 concentration is 76.7 ± 5 ppt, fitting residual is 0.0052. Based on the fitting error, the estimated detection limit for the LED-LPDOAS instrument with 2.61 km optical path is about 10 ppt (2σ).[29]
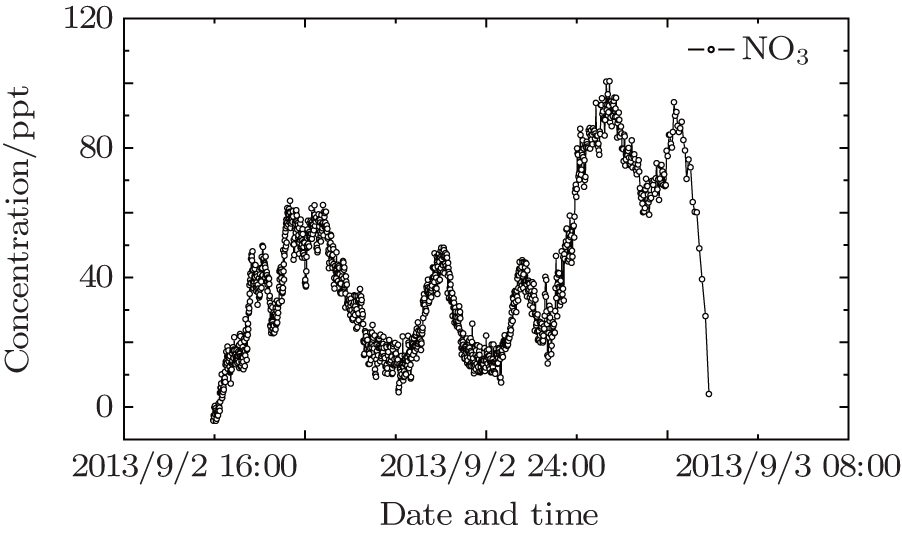
Figure 8 shows the time series of NO3 concentrations recorded during the night from September 2 to September 3, 2013, with good continuity and it shows that NO3 concentration increases rapidly just after sunset to a smaller high-value; through the accumulation later, the highest value appears in the late time at night; the concentration decreases rapidly after sunrise. The mean concentration is 42.8 ppt, and it has a highest value of 100.6 ppt at 02:43, September 3. The result is close to other observations of NO3 radicals in the boundary layer. [8,9,23]
4. ConclusionsNO3 radical is a critical atmosphere species in the night and its precise observation is particularly important for studying the night atmospheric chemistry. Owing to the continuous development of the materials, LED light covers a wider waveband. The employment of LED in optical instruments has become a trend in recent years. In addition, modern LED has a higher power that can maintain sufficient intensities to obtain a higher temporal resolution. This study is to use Schmidt–Cassegrain telescope, transceiver optic fiber and 660-nm stable LED light equipped with self-developed temperature control device to observe atmospheric NO3 radicals based on LP-DOAS, and the detection limit is about 10 ppt with a 2.16-km optical path. This article provides a tool for studying night atmosphere NO3 radicals.


 , Xie Pin-Hua1, 3, ‡,