Cheng Wei-Dong, Gu Xiao-Hua, Song Xue, Zeng Peng, Wu Zhao-Jun, Xing Xue-Qing, Mo Guang, Wu Zhong-Hua. In-situ SAXS study on PET/ PMMT composites during tensile tests. Chinese Physics B , 2016, 25(1): 017802
Permissions
In-situ SAXS study on PET/ PMMT composites during tensile tests
College of Materials Science and Engineering, Qiqihar University, Qiqihar 161006, China
Department of Practice Teaching and Equipment Management, Qiqihar University, Qiqihar 161006, China
Institute of High Energy Physics, Chinese Academy of Sciences, Beijing 100049, China
† Corresponding author. E-mail: 57399942@qq.com
‡ Corresponding author. E-mail: gxh216@163.com
Project supported by the National Natural Science Foundation of China (Grant Nos. U1232203, U1432104, U1332107, 11305198, and 11405199), the Program for Young Teachers Scientific Research in Qiqihar University, China (Grant No. 2012k-Z02), and the Natural Science Foundation of Heilongjiang Province, China (Grant No. E201259).
Abstract
Abstract
The nanostructures during the tensile drawing of poly(ethylene terephthalate) (PET)/hexadecyl triphenyl phosphonium bromide montmorillonite (PMMT) nanocomposites were studied by in-situ small angle x-ray scattering. For strain higher than the yield point, the scattering intensity increases dramatically due to the nucleation and growth of nanovoids and crystals. The nanovoids and crystals are significantly dependent on the heating temperature. The effective filling of PMMT in the PET matrix provokes a strong restriction to the long period. The peaks of the long period disappear gradually with the deformation strain increasing from 0% to 34%.
Poly(ethylene terephthalate), PET, is a semi-crystalline thermoplastic polymer widely used in soft drink bottles, food and nonfood containers. The barrier property of PET to oxygen should be improved for the application of packaging such as soft drinks and beer. The PET nanocomposite reinforced with particular montmorillonite, MMT, becomes an important alternative to neat PET with improved mechanical and barrier properties because the reinforcement from the inorganic layers occurs in two dimensions. [ 1 – 4 ] The nanocomposite properties depend on the delamination of MMT nanoparticles into the PET matrix. Normally, the surface organic modification of MMT is recognized as an effective way to improve the composite compatibility. [ 5 , 6 ]
The understanding of the mechanisms behind the enhancement, as well as the effect of the MMT nanofiller on the structural evolution, is crucial for the successful industrial application of PET nanocomposites. In this regard, research efforts have been devoted to the nanostructures and the deformation mechanism characterizations of the PET polymer and PET/MMT nanocomposites during stretching with small angle x-ray scattering (SAXS) technique. [ 7 – 17 ] At small strains, SAXS showed no hierarchical structure in amorphous PET polymer. At intermediate strains, SAXS indicated the formation of a layered structure and a fibrillar domain on a large scale. At high strains, the crystal reorientation and lateral crystal growth took place. [ 11 ] Tensile deformation could induce a mesophase structure, which is the precursor to crystallization. Todorov et al. assessed the evolution of craze-like structures and void sizes in PET/MMT nanocomposites with in-situ SAXS experiments. The evolution of the PET/MMT nanocomposite multiscale structure has three main common stages. [ 7 ]
This work aims at a better understanding of the inter-relationships between hexadecyl triphenyl phosphonium bromide montmorillonite (PMMT) nanoparticles incorporated into a PET matrix and the nanostructure during stretching at room temperature and 90 °C above the glass transition temperature by using in-situ SAXS method. PMMT is prepared, and as a result, the compatibility of MMT is improved to a great extent. In addition, a new monomer is also synthesized by a condensation reaction between succinic anhydride and p-phenylene diamine to improve the barrier property and depress the crystallization of the PET/PMMT nanocomposites. The in-situ SAXS measurement yields the information about the nanostructure changes, including the scattering intensity, nanovoids, crystals, and long period. The observed nanostructure characteristics are highly consistent with the mechanical behaviors.
2. Materials and experiment
2.1. Raw material
PMMT was obtained through a common preparation method. [ 18 , 19 ] Pure terephthalic acid (PTA) and ethylene glycol (EG) were purchased from Tokyo Kasei Kogyo Co. The succinic anhydride and p-phenylene diamine were supplied by Sinopharm Chemical Reagent Corp., and they were all of analytical purity.
2.2. Preparation of new monomer
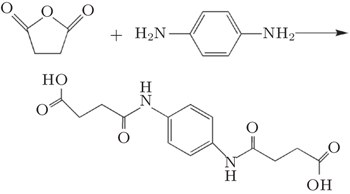
The new monomer was synthesized by a condensation reaction of succinic anhydride and p-phenylene diamine. A typical procedure for preparing the new monomer was as follows. 2.1 g p-phenylene diamine was dissolved in acetone. The mixed solution was added to another solution prepared by dissolving 4 g succinic anhydride in 40 mL acetone. The solution was then stirred at 600 rpm for 4 h at room temperature. The new monomer was purified by recrystallizing several times. The product was dried in a vacuum to extract the remaining solvent and non-reacted monomers. The preparation method of the new monomer was shown in Fig. 1 .
2.3. Preparation of poly (ethylene terephthalate) (PET)/ PMMT nanocomposites
PTA and EG with weight ratios in the range of 1.14–3.0 were added into a 50-L reactor with 1 wt.% the new monomer. The reactor was quickly heated to 230–260 °C for the esterification reaction under nitrogen atmosphere at a pressure in the range of 0.3–0.5 MPa. Afterwards, PMMT was added into the reactor under a suitable viscosity and the polymerization was carried out at a temperature in the range of 275–280 °C and a pressure of 50 Pa. The compositions of the prepared PET/PMMT nanocomposites are presented in Table 1 .
Table 1.
Table 1.
Table 1.
Compositions of the prepared PET/PMMT nanocomposites.
.
Sample
New monomer content
PMMT content
Pure PET
0
0
DPM-1-0.3
1%
0.3%
DPM-1-0.5
1%
0.5%
DPM-1-1
1%
1%
Table 1.
Compositions of the prepared PET/PMMT nanocomposites.
.
2.4. Mechanical test
The mechanical properties of the samples were examined using a Linkam TST350 tensile tester (Linkam Scientific Instruments, Surrey, UK) at room temperature and 90 °C above the glass transition temperature. The load cell and the crosshead speed used were 200 N and 10 μm/s, respectively. The specimens were cut into dog bone shape using a cutter. The test specimens possessed dimensions of 35 mm × 5.1 mm × 0.3 mm.
2.5. FTIR spectroscopy, DSC analysis, and SEM
Fourier transform infrared (FTIR) spectroscopic analysis of the secondary-modified MMT was conducted on a Bruker Tensor 27 infrared spectrometer (Germany). For DSC (Q2000 TA) testing, samples of all resulting nanocomposites were subjected to heating from room temperature to 285 °C with the same rate of 10 °C/min. The scanning electron microscope (SEM) (Hitachi S-4300, Japan) was used to record and analyze the brittle fracture surface obtained in liquid nitrogen.
2.6. SAXS experiment
The small angle x-ray scattering experiment was performed at beam line 1W2A of Beijing synchrotron radiation facility (BSRF) with incident x-ray of wavelength 0.154 nm. The storage ring was operated at 2.5 GeV with a current about 200 mA. A Pilatus detector with 981 × 1043 pixels (pixel size: 172 μm × 172 μm) was positioned perpendicularly to the incident beam with a detector–sample distance of 1330 mm.
In-situ SAXS measurements were carried out during tensile tests. The pattern recording time of 10 s was chosen in order to have the best compromise between pattern resolution and minimum strain increment during detecting. The tensile stretching device can move both grips in opposite directions, so the x-ray beam can be maintained at the center of the PET/PMMT nanocomposites during the stretching procedures. The samples were mounted perpendicularly to the incident x-ray beam and stretched in the horizontal direction. Background scattering was subtracted and all scattering intensities were normalized with respect to the incident x-ray intensity.
3. Results and discussion
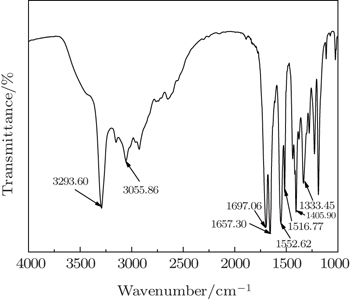
Figure 2 shows the IR spectrum of the new monomer. In the figure, some new absorption peaks appear after the condensation reaction, such as the C–C absorptions of the benzene ring at 1552.62 cm −1 and 1516.77 cm −1 , the stretching vibration of NH at 3293.60 cm −1 , the absorptions at 1697.06 cm −1 and 1657.30 cm −1 , and the stretching vibrations of C=O of acylamino and carboxyl. The peak at 1405.90 cm −1 is attributed to the stretching mode of C–N in the monomer. The peaks at 3055.86 cm −1 and 1333.45 cm −1 correspond to the stretching modes of OH and C–O of carboxyl, respectively. All these new peaks indicate that the new monomer is synthesized successfully.
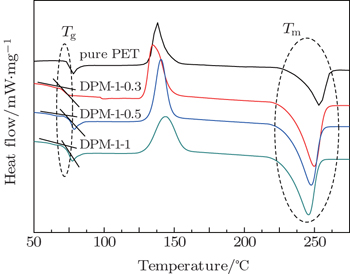
The DSC samples of all resulting nanocomposites are subjected to heating from room temperature (RT) to 285 °C with the same rate of 10 °C /min. Figure 3 shows that T g and T m of PET/PMMT nanocomposites are both lower than those of pure PET. It indicates a high dispersivity. PMMT and the unit of the new monomer affect the regularity of the PET chains and the influenced molecular chains are rearranged in a regular crystal. Consequently, the ability to crystallize copolymers is weakened.
Fig. 3. DSC curves of pure PET and new PET/PMMT nanocomposites.
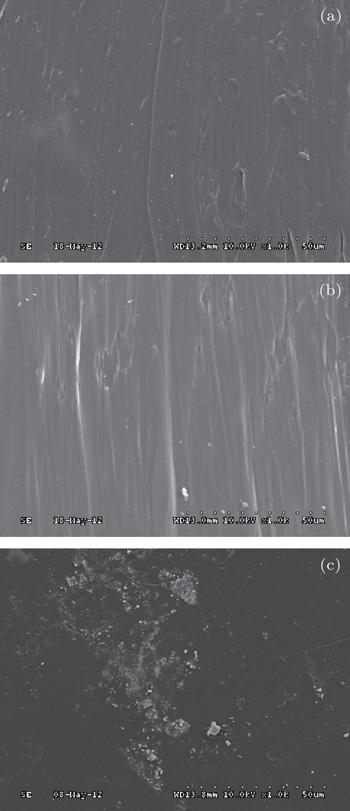
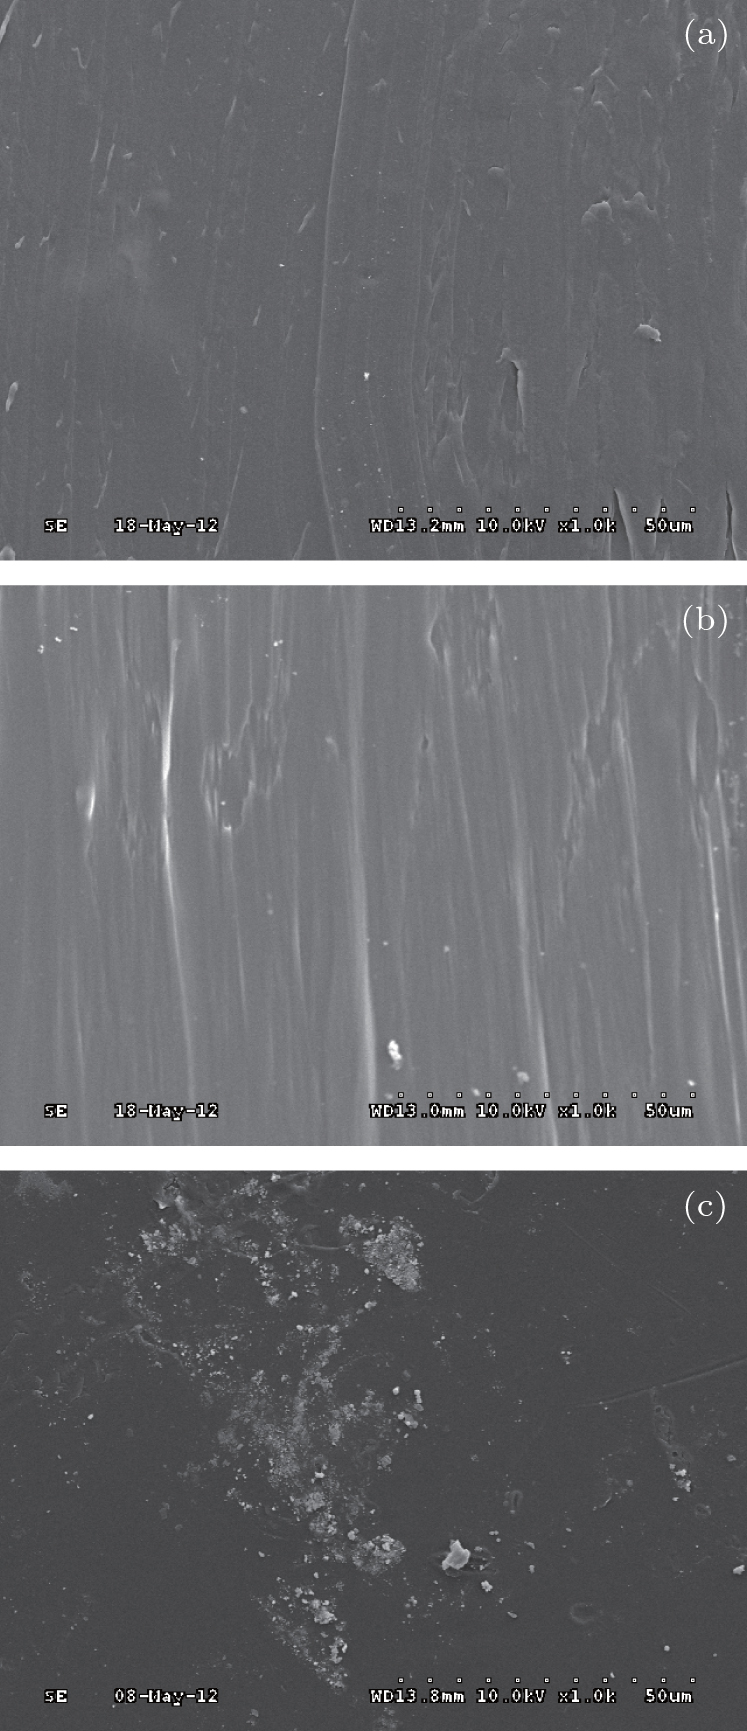
The SEM is used to characterize the PMMT nanoparticle distribution and to assess the presence of large aggregates. Figure 4 shows SEM micrographs of PET/PMMT nanocomposites containing PMMT of different contents. Based on the SEM observations, the PET nanocomposites exhibit higher PMMT densities with increasing PMMT content. The uniform dispersions of DPM-1-0.3 and DPM-1-0.5 are evidenced by SEM images in Figs. 4(a) and 4(b) , while PMMT is distributed as a part of an agglomerated state in the DPM-1-1 sample shown in Fig. 4(c) .
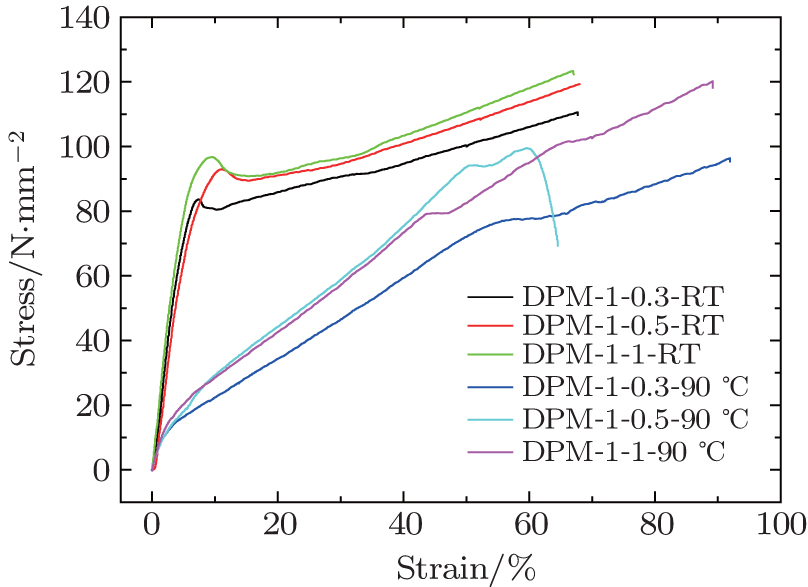
As is well known, the PMMT content affects the mechanical properties and microstructure of the PET/PMMT nanocomposites. Figure 5 shows the stress–strain curves of the PET/PMMT nanocomposites with different PMMT contents at different temperatures. The experiments confirm the necking formation during the deformation of the sample. The yield stress significantly increases with increasing PMMT content. The stress–strain curves at RT also show the ductile behavior of the PET/PMMT nanocomposites with a pronounced necking at about 10% strain. It is associated with the yield point which is located roughly at the point of maximum curvature in the necking. However, the necking and the yielding appear at about 50% strain at 90 °C. The stress at 90 °C is lower than that at RT under the same strain. The different increases of molecular mobility of PET at higher stretching temperature are responsible for the different curve developments.
Fig. 4. SEM images of (a) DPM-1-0.3, (b) DPM-1-0.5, and (c) DPM-1-1.
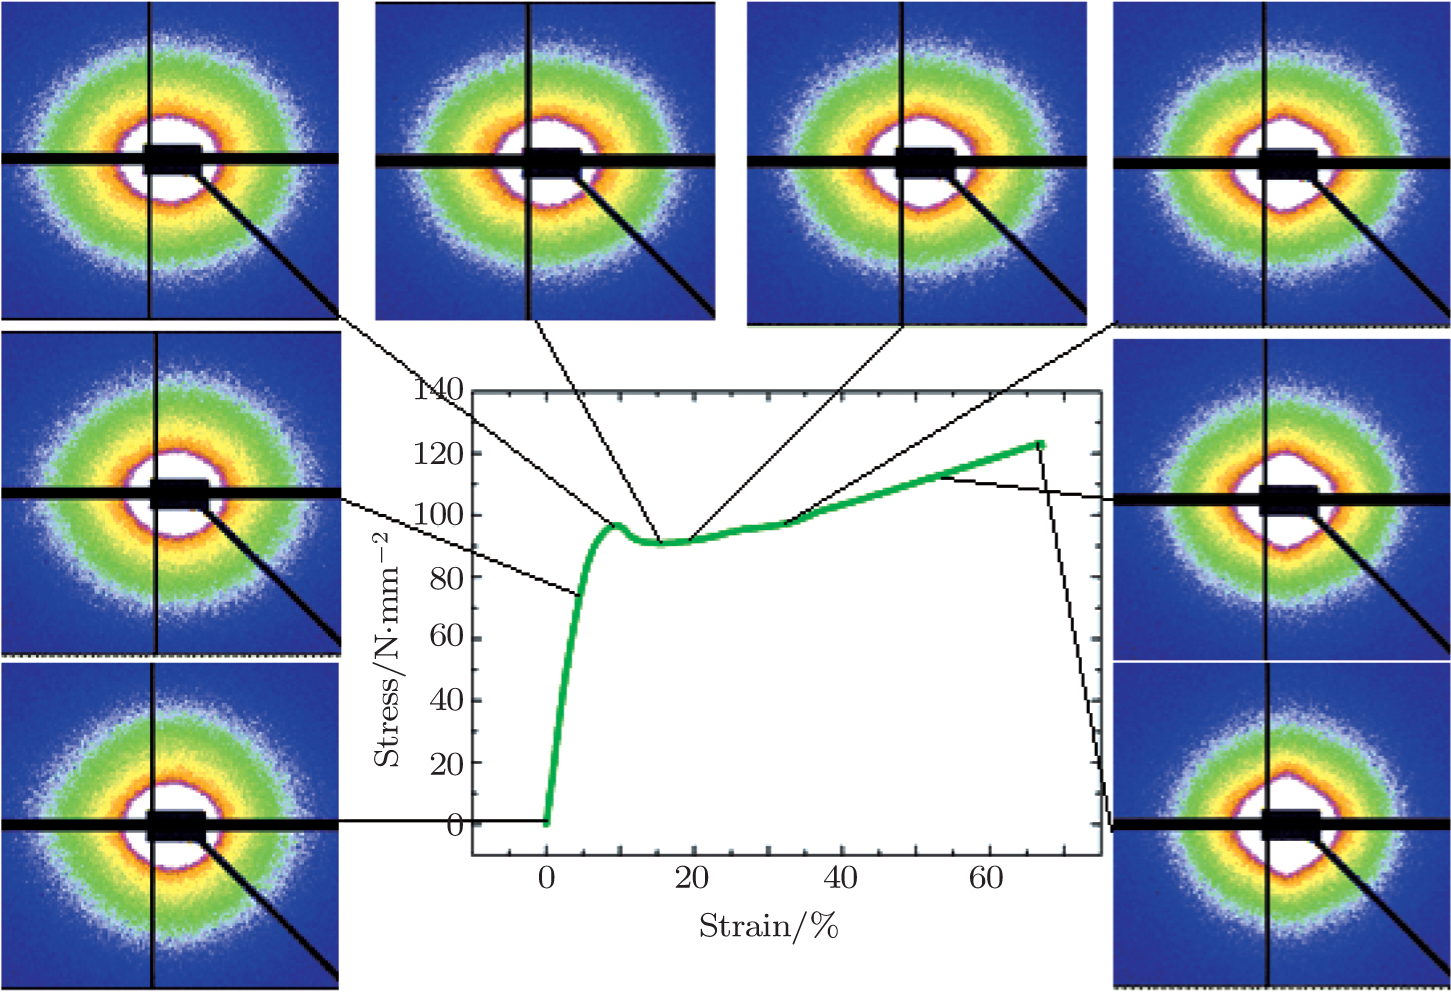
Figure 6 shows the selected SAXS patterns during tensile deformation for the DMP-1-1 nanocomposite, along with the engineering stress–strain curve. When the strain is between 0% and about 10%, approximately isotropic scattering patterns are observed and the scattering intensity is almost homogeneously distributed. A broad isotropic ring in the SAXS pattern could be explained by scattering from randomly oriented stacks of the PMMT lamellar structure. At above 10% strain, an anisotropic SAXS pattern appears and the orientation becomes obvious with stretching along the meridional direction. It indicates that some PMMTs are oriented along the pulling axis easily during this stage and a layered nanostructure forms inside the matrix of the PET/PMMT nanocomposites. At above the strain of yielding (i.e., 10%), the SAXS patterns consistently show a diamond shape. The appearance of the scattering shape can be attributed to the occurrence and elongation of nanovoids along the stretching direction. At the same time, it indicates that the period of the adjacent lamellae in the stretching direction is longer than that in the initial stage of stretching.
Fig. 6. Selected SAXS patterns of DPM-1-1 along with the stress–strain curve during tensile stretching at room temperature.
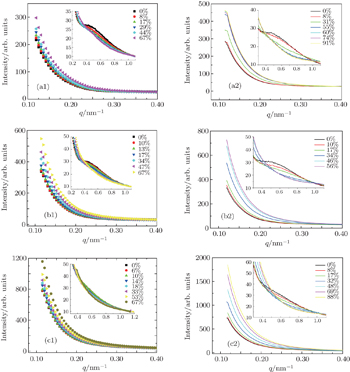
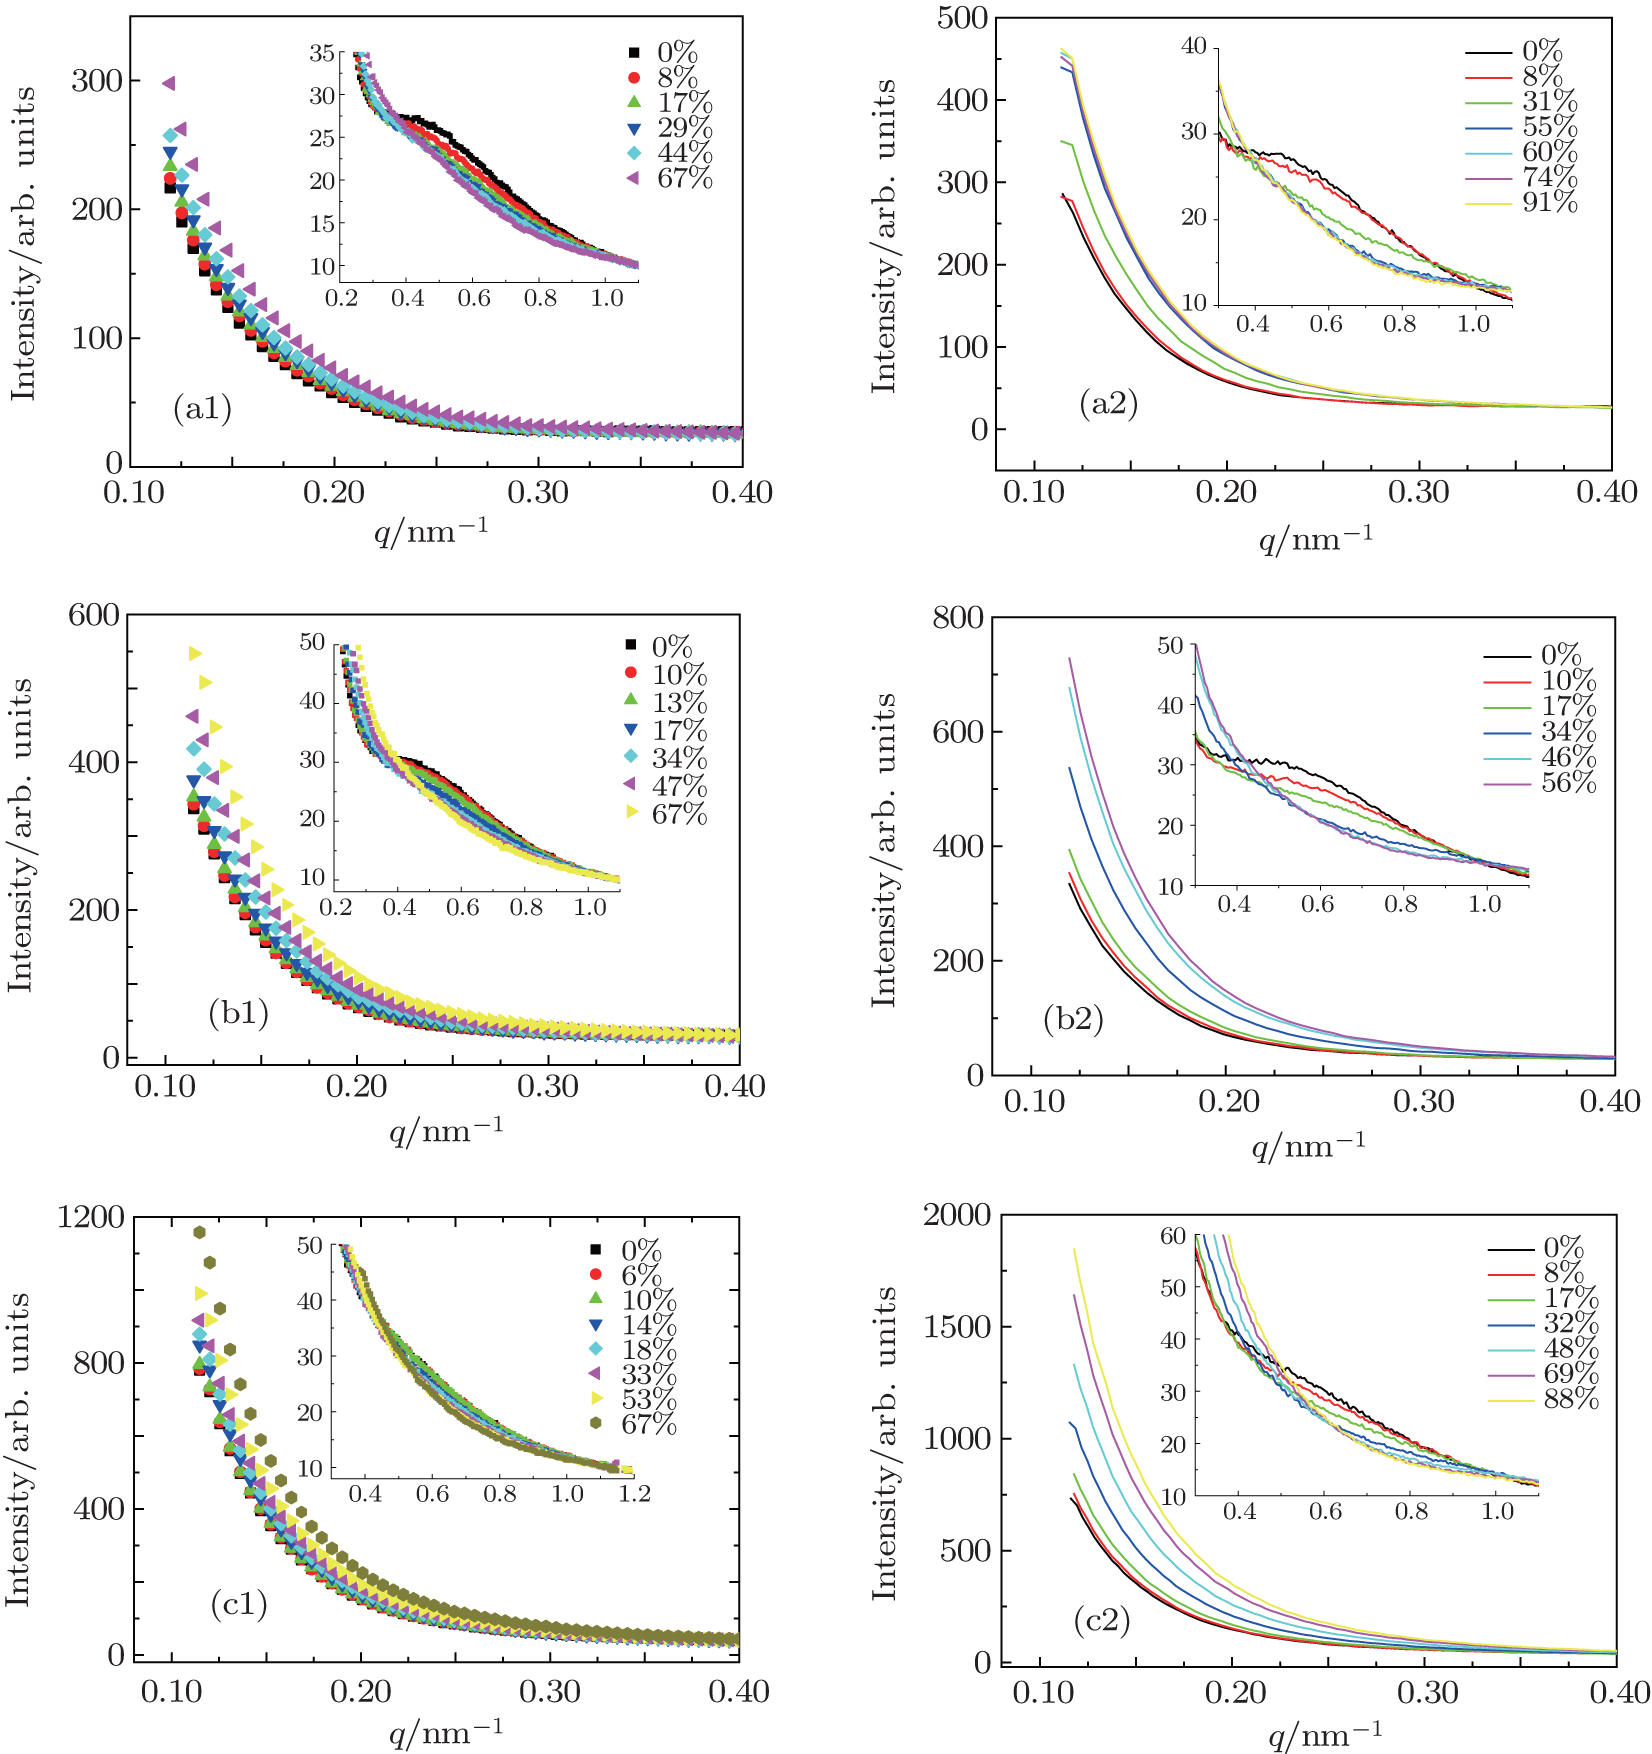
The SAXS patterns can be used to detect nanovoids. It may be useful to analyze the maximal intensities in the scattering patterns as a function of strain. The intensities should quickly increase from the moment when the nanovoids are formed. The integrated SAXS profiles of the PET/PMMT nanocomposites with strains are shown in Fig. 7 . Figure 7 also shows the relation between the strain and the maximal intensity. From the SAXS curves, it can be seen that all the intensities in the meridional direction have no obvious change below about 10% strain of yielding. However, significant increases of intensities at above about 10% strain (the yield point) are observed for these samples. It is conceivable that nanovoids and deformation-induced crystals are formed. The nanovoids elongate along the stretching direction. The increase of the scattering intensity with deformation can be explained by the increases in nanovoid and crystal densities. In particular, the scattering intensity at the range of 0.12 nm −1 < q < 0.3 nm −1 increases more obviously at 90 °C than that at RT. This can be explained by the fact that the nanovoids and crystals at 90 °C are larger than those at RT. It is shown that nucleation and growth of nanovoids and crystals are strongly dependent on the temperature. The insets in Fig. 7 show that there is a scattering shoulder at about q = 0.5 nm −1 in the meridional direction for the PET/PMMT nanocomposites before deformation. It indicates that there exist scattering interferences among the nanoparticles of the nanocomposites, and the inter-nanoparticle distances are very closely distributed. The shoulder decreases gradually with increasing PMMT content as shown in Figs. 7(a1) , 7(b1) , and 7(c1) . This decrease is related to the depression of the crystallization of the PET matrix with increasing PMMT content. This can be explained by the PMMT as a heterogeneity instead of a nucleating agent. The introduction of a small quantity of nanoscale PMMT brings an obstacle to the molecular chain movement, which would reduce the tendency of the molecular chains to crystallize. During deformation, the shoulders gradually disappear when the strain increases from 0% to about 34% in the meridional direction. This result that the shoulders decrease gradually is different from the previous one [ 11 ] that the scattering shoulder appeared and changed into a peak. A reasonable conjecture is that the effect of PMMT should contribute mainly to the change of the shoulder.
Fig. 7. The SAXS profiles of nanocomposites (a1), (a2) DMP-1-0.3; (b1), (b2) DMP-1-0.3; and (c1), (c2) DMP-1-1 during stretching at RT and 90 °C, respectively.
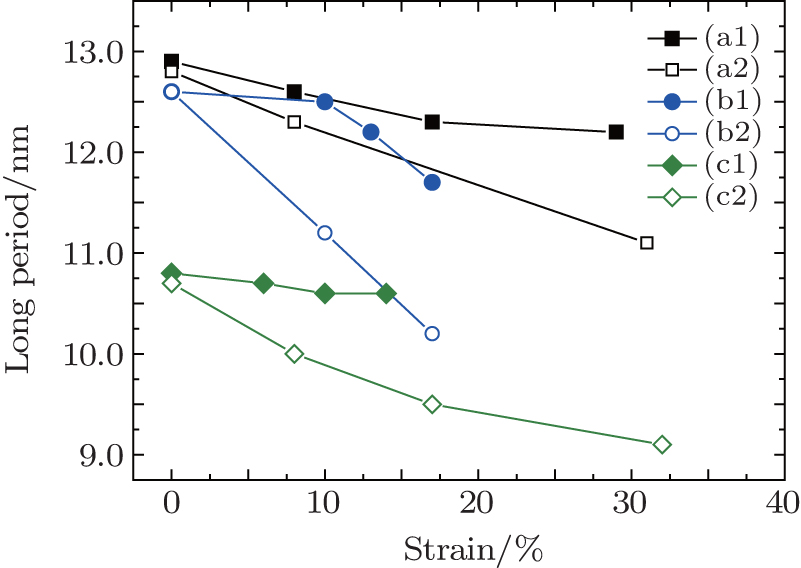
From the evolution of the shoulders, it can be speculated that the nanoparticles have a long period of layered nanostructure in the nanocomposites. On the SAXS intensity representing the scattering from the PET/PMMT nanocomposite, only one maximum of intensity, resulting from the periodic structure, is usually visible. This maximum is used to determine the long period of structure based on L = 2 π / q , where L is the long period and q is the scattering vector. [ 11 ] The correlation of the long period with the strain is shown in Fig. 8 . The long period decreases with increasing PMMT content and deformation strain. For the early stages of stretching from 0% to 34%, the disappearance of the long period may be because the average spacing of the long period is enlarged due to the elongation of amorphous chains in the matrix of the PET/PMMT nanocomposites. Another important reason may be the relatively high scattering or absorption of PMMT.
Fig. 8. Changes of long period with strain for nanocomposites (a1), (a2) DMP-1-0.3; (b1), (b2) DMP-1-0.5; and (c1), (c2) DMP-1-1 during stretching at RT and 90 °C, respectively.
4. Conclusion
In-situ SAXS experiments coupled with stretching were performed to investigate the nanostructure evolution of the PET/PMMT nanocomposites at RT and 90 °C. The SAXS appears as a very suitable technique to characterize the complex plastic deformation behavior. The load–strain curves at RT can be divided into different ranges of strain based on the SAXS experimental results and the nanostructure characteristics. Below about 10% strain, the scattering patterns are approximately isotropic and the scattering intensities have no obvious change. At above 10% strain (the yield point), an anisotropic SAXS pattern appears and the orientation becomes obvious with stretching along the meridional direction. It is conceivable that nanovoids and deformation-induced crystals are formed. The nanovoids elongate with increasing strain. Some PMMTs are oriented along the pulling axis and a layered nanostructure is formed inside the matrix of the PET/PMMT nanocomposites. At strain from 0% to about 34%, the long period of the layered nanostructure in the nanocomposites decreases with increasing PMMT content and deformation strain.


 , Gu Xiao-Hua 1, ‡,