Phase transition and critical behavior of spin–orbital coupled spinel ZnV 2 O 4
[Wang Li 1 , Wang Rong-juan 1 , Zhu Yuan-yuan 2 , Lu Zhi-hong 3 , Xiong Rui 1 , Liu Yong 1, †,  , Shi Jing 1, ‡, ]
, Shi Jing 1, ‡, ]
|
|

 , Shi Jing 1, ‡,
† Corresponding author. E-mail:
‡ Corresponding author. E-mail:
Project supported by the National Basic Research Program of China (Grant No. 2012CB821404), the National Natural Science Foundation of China (Grant Nos. 51172166 and 61106005), the National Science Fund for Talent Training in Basic Science, China (Grant No. J1210061), and the Doctoral Fund of Ministry of Education of China (Grant No. 20110141110007).
We present the temperature-dependent susceptibility and specific heat measurement of spinel ZnV 2 O 4 . The structural transition with orbital ordering and the antiferromagnetic transition with spin ordering were observed at 50 K and 37 K, respectively. By analysis of the hysteresis behavior between the specific heat curves obtained in warming and cooling processes, the structural transition was confirmed to be the first-order transition, while the antiferromagnetic transition was found to be of the second-order type. At the structural transition, the latent heat and entropy change were calculated from the excess specific heat, and the derivative of pressure with respect to temperature was obtained using the Clausius–Clapayron equation. At the magnetic transition, the width of the critical fluctuation region was obtained to be about 0.5 K by comparing with Gaussian fluctuations. In the critical region, the critical behavior was analyzed by using renormalization-group theory. The critical amplitude ratio A + / A − = 1.46, which deviates from the 3D Heisenburg model; while the critical exponent α is −0.011, which is close to the 3D XY model. We proposed that these abnormal critical behaviors can be attributed to strong spin–orbital coupling accompanied with the antiferromagnetic transition. Moreover, in the low temperature range (2–5 K), the Fermi energy, the density of states near the Fermi surface, and the low limit of Debye temperature were estimated to be 2.42 eV, 2.48 eV −1 , and 240 K, respectively.
The S = 1 spinel compound ZnV 2 O 4 has attracted much interest in recent years due to its novel applications in the energy area such as hydrogen storage, [ 1 – 4 ] as well as the unique physical properties of 3d electrons arising from strong coupling among charge, spin, orbit, and lattice. [ 5 ] At room temperature, the V 3+ ions form a corner-sharing, geometrically frustrated, pyrochlore network and are octahedrally coordinated by six oxygen ions, while the Zn 2+ ions are located in four tetrahedral oxygen ions, presenting the cubic symmetry Fd 3̅ M . [ 6 ] With temperature dropping, the symmetry of the lattice is broken by a structural transition induced by the Jahn–Teller effect. [ 6 ] Such transition leading by a lattice distortion was originally observed by Ueda’s team via peak splitting in the x-ray diffraction (XRD) pattern around the transition temperature T S = 50 K. [ 7 ] They found that ZnV 2 O 4 is cubic above 50 K while tetragonal below 48 K with a compression along the c axis ( c / a ≈ 0.994). [ 7 ] Accompanied by this structural transition, a kind of orbital ordering emerges at the same temperature on account of the split of the t 2g level and the reoccupation of two lower energy levels by two electrons of V 3+ . [ 8 ] Tsunetsugu and Motome believed that the Coulomb and exchange interaction between V 3+ ’s played a decisive role, thus one electron of each V 3+ invariably occupied d xy and another one occupied d zx and d yz alternatively. [ 9 , 10 ] However, based on the relativistic spin–orbit coupling effect, Tchernyshyov proposed a ferro-type orbital order with complex orbital state d xz ± id yz consistent with the system symmetry I 4 1 / amd . [ 11 ] On the other hand, neutron scattering experiments and the susceptibility result witnessed that a Néel transition from paramagnetism (PM) to antiferromagnetism (AFM) at transition temperature T M = 40 K exists in ZnV 2 O 4 as well. [ 7 , 12 , 13 ] The configuration of such antiferromagnetic spin chains is still ambiguous owing to the geometric frustration and the spin–orbital coupling. Those two transitions were obviously observed in temperature-dependent susceptibility and specific heat by Vasiliev et al . [ 14 ] Although the two transition temperatures obtained by them, 45 K and 31 K, are lower than those identified in XRD and neutron scattering experiments, Vasiliev’s work [ 14 ] revealed that the structural and orbital transition is a first-order transition, while the AFM transition is a second-order one.
As is well known, the second-order transition is a continuous transition, whose critical behaviors and universal classifications could provide a deep insight into such transition, as well as the inherent relations between the transition and various interactions. [ 15 ] Thus, a lot of investigations of critical behaviors have been carried out for the second-order phase transitions with ferromagnetic and antiferromagnetic orders, as well as superconductive orders. However, few investigations into the critical behaviors of ferromagnetic or antiferromagnetic transition with the coexistence of spin–spin interaction and spin–orbital couplings were reported, especially in AB 2 X 4 spinel compounds. The critical behaviors of paramagnetic–ferrimagnetic and paramagnetic–ferromagnetic transitions with the competitions between spin, orbital, and lattice degrees of freedom were studied in MnV 2 O 4 and CdCr 2 S 4 by Zhang’s group and Lou’s group, respectively. [ 16 , 17 ] They both observed the discrepancy of critical exponents with respect to either the Heisenberg model or the mean field theory, and revealed some possible effects of spin–orbital and spin–phonon couplings on the critical phenomena. [ 17 ] Different from MnV 2 O 4 and CdCr 2 S 4 , the second-order phase transition in ZnV 2 O 4 is a paramagnetic–antiferromagnetic transition. Moreover, for MnV 2 O 4 , the temperature of structural transition accompanied by the orbital ordering ( T S ) is lower than the magnetic transition temperature T M , [ 16 ] while for ZnV 2 O 4 , T S is higher than T M . This indicates that the AFM transition in ZnV 2 O 4 is in the background of the orbital order. Obviously, it is significant to check the critical behavior of this kind of AFM transition accompanied with orbital order.
In this paper, the phase transitions and the critical behaviors of ZnV 2 O 4 are investigated via susceptibility and specific heat measurements. The critical exponent and the critical fluctuation region accompanying the second-order AFM transition are obtained. An inconsistency of universal classification identified by either the critical exponent or the critical amplitude ratio is found in this compound. Moreover, the derivative of pressure with respect to temperature around the first-order structural transition is derived from the Clausius–Clapayron equation.
The polycrystalline sample of ZnV 2 O 4 was synthesized by solid-phase reaction using high purity powders of ZnO (Sinopharm, 99.99%) and V 2 O 5 (Sinopharm, 99%). The starting powders were first mixed thoroughly at stoichiometric ratio; then the mixed powder was pressed into pellets and annealed at 800 °C for 24 h under H 2 /N 2 (concentration of H 2 was 5%) mixed gas atmosphere. The obtained sample was a black bulk ceramic.
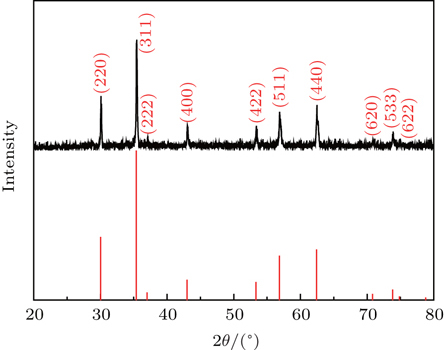
The crystal structure and phase purity of the sample were investigated by XRD by using Cu- Kα radiation (D8 Advanced, Bruker AXS, Germany) with 2 θ changing from 20° to 80° at room temperature. The temperature-dependent susceptibility and specific heat measurements were carried out on a physical properties measurement system (PPMS 6000, Quantum Design, USA). Specifically, the susceptibility against temperature ( χ – T ) was measured in a warming process from 2 K to 300 K under an applied field of 1 T after zero field cooling. The temperature-dependent specific heat ( C P – T ) was measured between 2 K to 200 K in both cooling and warming processes without field. The data of specific heat were collected every 0.1 K in ranges of 2 K to 10 K and 30 K to 60 K, and every 0.01 K in the AFM transition region with a temperature range from 36 K to 39 K.
The structure of the ZnV 2 O 4 sample is characterized by XRD at room temperature. The XRD pattern is shown in Fig.
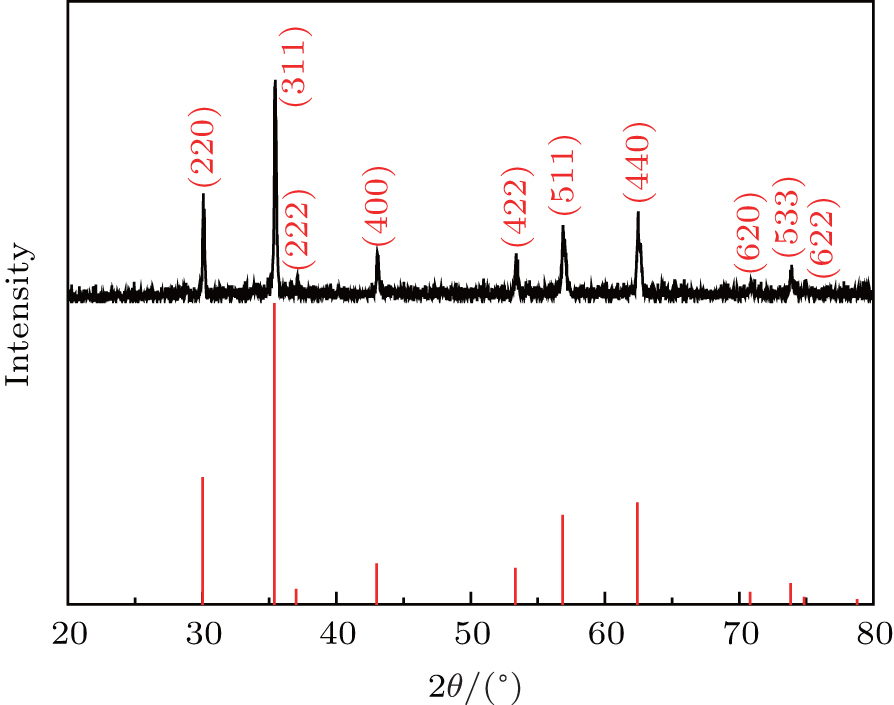 | Fig. 1. The experimental XRD pattern (upper) and the standard characteristic peaks of ZnV 2 O 4 (lower). |
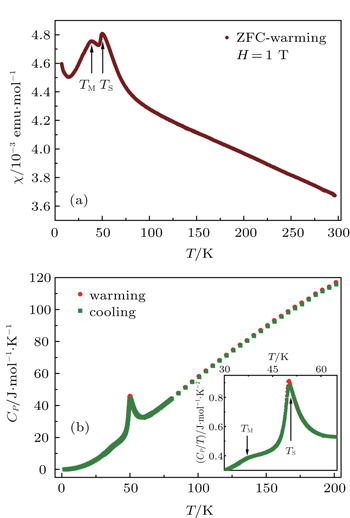
The temperature-dependent susceptibility of the sample is exhibited in Fig.
 | Fig. 2. (a) Temperature-dependent susceptibility of ZnV 2 O 4 by ZFC-warming measurement. (b) Temperature-dependent specific heat of ZnV 2 O 4 by warming (solid red dots) and cooling (solid green squares) measurement. The inset shows C P / T vs. T for obviously displaying the peak and bump. |
Figure
In the following parts, C P will be analyzed in detail in three different temperature regions: 1) the low temperature region with T < 30 K, 2) the first-order structural and orbital transition region around T S = 50 K, and 3) the second-order AFM transition region around T M = 35 K.
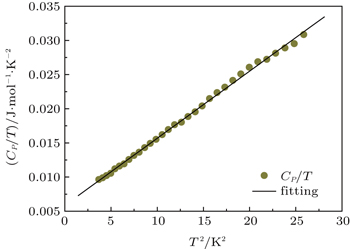
At low temperature, only contributions from electrons, phonons, and magnons need to be considered. Therefore, C P can be expressed as [ 20 ]


 | Fig. 3. Linear relationship between C P / T and T 2 in temperature range of 2–5 K. |
Through linear fitting, γ and ( β + δ ) are obtained. The fitting results are the same for both cooling and warming processes because they are identical in the considered temperature range. The related parameters obtained from fitting are γ = 5.85 × 10 −3 J/mol·K 2 and β′ = ( β + δ ) = 0.983 × 10 −3 J/mol·K 4 . The γ of ZnV 2 O 4 is lower than that of MnV 2 O 4 (12 × 10 −3 J/mol·K 2 ) reported by Myung-Whun et al . [ 21 ] In MnV 2 O 4 , not only 3d electrons of V 3+ contribute to C P , those of Mn 2+ may also have significant contributions. This might be the reason for MnV 2 O 4 to have larger γ compared with ZnV 2 O 4 . The γ can be related to Fermi energy ε F and the density of states near the Fermi surface D ( ε F ) of ZnV 2 O 4 as follows: [ 22 ]

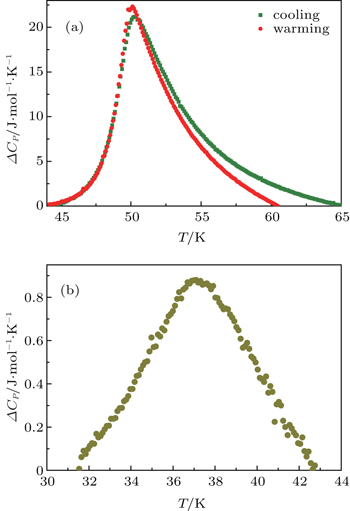
The peaks around 50 K in C P curves for both cooling and warming processes correspond to the structural transition. Excess specific heat Δ C P is obtained by subtracting the regular contribution from C P and shown in Fig.

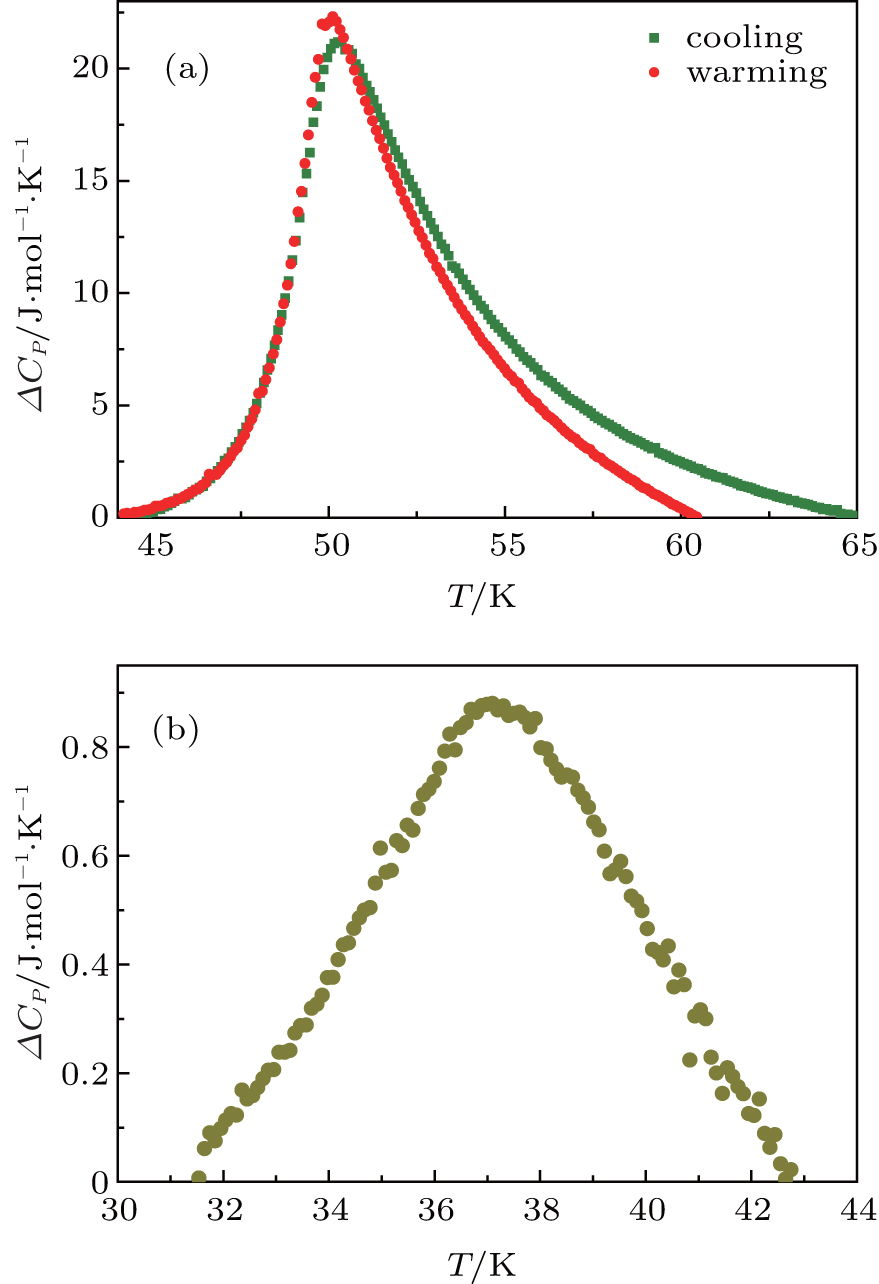 | Fig. 4. (a) The excess specific heat of ZnV 2 O 4 at structural transition for warming (solid red dots) and cooling (solid green squares) processes. (b) The excess specific heat of CdV 2 O 4 at AFM transition for both processes. |
| Table 1. Enthalpy change, entropy change, and specific volume difference after and before structural transition of ZnV 2 O 4 in warming and cooling measurement. . |
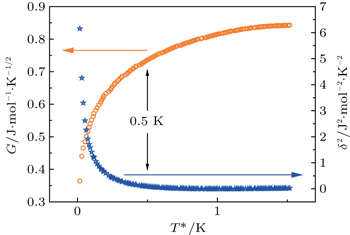
The bump in the C P curve shown in Fig.

 | Fig. 5. The T * − dependent strength of the Gaussian term G (hollow orange hexagons) and square error σ 2 (hollow blue stars). |
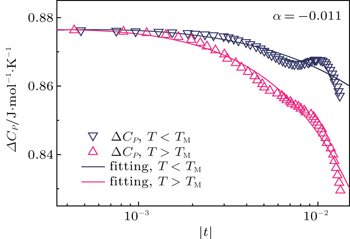
 | Fig. 6. Experimental (triangles) and fitted curves (lines) of the specific heat vs. reduced temperature above (pink) and below (navy blue) T M for PM–AFM transition of ZnV 2 O 4 . |
| Table 2. Critical exponents and critical amplitude of ZnV 2 O 4 ; theoretical values of different models. . |
To understand the abnormal critical behaviors of ZnV 2 O 4 , it is helpful to compare the critical behaviors of ZnV 2 O 4 with those of MnV 2 O 4 , since they are isostructural counterparts. In MnV 2 O 4 , the second-order transition is ferrimagnetic and happens at higher temperature than the structural and orbital transition. So for MnV 2 O 4 , around T M , the orbital order is lacking, and the spin–spin interactions dominate this second-order transition. Nevertheless, the investigation of DC-magnetization by Zhang’s group revealed that magnetic critical exponent β deviates from the 3D Heisenberg model and proposed that the deviation is due to the precursor phenomenon of orbital order fluctuation. [ 16 ] For ZnV 2 O 4 , T M < T S , i.e., around T M of ZnV 2 O 4 , the orbital order has already presented. So the spin–spin and spin–orbital interactions coexist at T M and both of them contribute to the transition. Therefore, strong spin–orbital coupling might confine the spin degree of freedom, and also induces the universality class of critical behaviors to deviate from the 3D Heisenburg model, even shifting to the 3D XY model.
The phase transition and low temperature characteristics of spin–orbital coupling spinel ZnV 2 O 4 are investigated. The Debye temperature, the Fermi energy, and the density of states near the Fermi surface of this compound are given by analyzing the data of specific heat below 5 K. The measurement of temperature-dependent specific heat confirms that the structural transition accompanied with orbital order at T S = 50.1 K is a first-order one, while the AFM transition at T M = 37.1 K is a second-order phase transition. For the first-order structural and orbital transition, the enthalpy and entropy change are calculated, meanwhile, the derivative of pressure with respect to temperature d P /d T at T S is estimated by using the Clausius–Clapayron equation. For the second-order AFM transition, the analysis of the critical behavior estimates the width of the critical fluctuation region to be about 0.5 K, and also finds that the critical amplitude ratio deviates from the theoretical value of the 3D Heisenberg model, while the critical exponent α is close to that of 3D XY model. This kind of abnormal critical behavior might be attributed to the influences of spin–orbital coupling.
| 1 | |
| 2 | |
| 3 | |
| 4 | |
| 5 | |
| 6 | |
| 7 | |
| 8 | |
| 9 | |
| 10 | |
| 11 | |
| 12 | |
| 13 | |
| 14 | |
| 15 | |
| 16 | |
| 17 | |
| 18 | |
| 19 | |
| 20 | |
| 21 | |
| 22 | |
| 23 | |
| 24 | |
| 25 | |
| 26 | |
| 27 | |
| 28 | |
| 29 | |
| 30 | |
| 31 | |
| 32 |