Zhang Xiao-Jun, Chen Chang-Le. Phonon dispersion on Ag (100) surface: A modified analytic embedded atom method study. Chinese Physics B , 2016, 25(1): 016301
Permissions
Phonon dispersion on Ag (100) surface: A modified analytic embedded atom method study
Zhang Xiao-Jun 1, 2 , Chen Chang-Le 1, †,
Shaanxi Key Laboratory of Condensed Matter Structures and Properties, Northwestern Polytechnical University, Xi’an 710072, China
School of Science, Xi’an Polytechnic University, Xi’an 710048, China
Project supported by the National Natural Science Foundation of China (Grant Nos. 61471301 and 61078057), the Scientific Research Program Funded by Shaanxi Provincial Education Department, China (Grant No. 14JK1301), and the Specialized Research Fund for the Doctoral Program of Higher Education, China (Grant No. 20126102110045).
Abstract
Abstract
Within the harmonic approximation, the analytic expression of the dynamical matrix is derived based on the modified analytic embedded atom method (MAEAM) and the dynamics theory of surface lattice. The surface phonon dispersions along three major symmetry directions , and X̄ M̄ are calculated for the clean Ag (100) surface by using our derived formulas. We then discuss the polarization and localization of surface modes at points X̄ and M̄ by plotting the squared polarization vectors as a function of the layer index. The phonon frequencies of the surface modes calculated by MAEAM are compared with the available experimental and other theoretical data. It is found that the present results are generally in agreement with the referenced experimental or theoretical results, with a maximum deviation of 10.4%. The agreement shows that the modified analytic embedded atom method is a reasonable many-body potential model to quickly describe the surface lattice vibration. It also lays a significant foundation for studying the surface lattice vibration in other metals.
A detailed knowledge of the surface phonon dispersion arising from atomic vibrations in the vicinity of the surface is essential for studying the specific heat, thermal expansion, phase transition, and electron–phonon interaction. [ 1 – 3 ] Therefore, the surface phonon dispersion has been studied both experimentally and theoretically over the past decades. [ 4 – 7 ] A number of experimental techniques, such as the inelastic helium-atom scattering (HAS) [ 8 ] and the electron energy-loss spectroscopy (EELS), [ 9 ] have been applied to measuring the phonon frequencies versus wave vectors for clean surfaces under normal conditions of temperature and pressure. However, a detailed understanding of the surface lattice vibration relies not only on the phonon frequencies, but also on the phonon polarization, which demands an accurate theoretical description of the surface phonon dispersion. Significant progress in the numerical calculation of surface phonon dispersion and phonon polarization has been achieved by applying the manybody potential models to the surface dynamical problems. [ 10 ] The first-principles technique based on the density-functional theory is a reliable many-body model, which can provide accurate information about the surface lattice vibration without the need to resort to material-specific parameters. [ 11 ] However, owing to the computational complexity of the method, the results of the dispersion relation are usually restricted to high symmetry points in the Brillouin zone (frozen phonon method), and then the phonon dispersions along symmetry lines of the two-dimensional Brillouin zone (BZ) are obtained by fitting atomic force constants to the zone-edge frequencies. Still, the method requires considerable computer power and time to obtain the final results, especially for the lattice relaxation of a multi-layer slab and the interlayer force constants along symmetry lines. For the above reasons, some empirical many-body methods have been developed to investigate the surface phonon dispersion relation. [ 12 – 14 ] One of the empirical many-body models, namely, the modified analytic embedded atom method (MAEAM), has been proposed by Ouyang et al . [ 15 ] and Zhang et al . [ 16 ] based on the original embedded atom method (EAM). In the model, a modified term M ( P ) is added to the total energy expression for the EAM to describe the energy change due to the non-spherical distribution of electrons in the system. The model is successful in calculating bulk phonon dispersions of metals. [ 17 , 18 ] The aim of this paper is to use the MAEAM to predict the phonon dispersion relation for the Ag (100) surface along major symmetry directions with our derived dynamical matrix formulas and also to test the validity of the MAEAM for surface vibrations under normal conditions of temperature and pressure.
2. Modified analytical embedded atom method
In the MAEAM, the basic equations are given by [ 19 – 21 ]
where E t is the total energy of the atomic system; F ( ρ i ) is the embedding function denoting the energy of embed atom i transferring to host electrons of density ρ i , which is given by a linear superposition of the atomic electron densities f ( r i j ); ϕ ( r i j ) is the interaction potential between atoms i and j , and the modified term M ( P i ) is the energy that is derived from the non-spherical distribution of electrons P i and describes the deviation from the linear superposition of electronic density. The atomic electron density f ( r i j ), embedding function F ( ρ i ), pair potential ϕ ( r i j ), and modified term M ( P i ) take the following forms: [ 22 ]
where r 1e is the first nearest neighbor distance at equilibrium, ρ e and P e are the spherical electron density and the non-spherical electron density at equilibrium, respectively, parameter f e is taken to be 1 as done by Hu et al ., [ 23 ] and F 0 is the embedding energy at equilibrium, which can be obtained by the formula F 0 = E c − E 1v , with E c being the cohesion energy and E 1v the mono-vacancy formation energy. The model parameters for metal Ag, including F 0 , n , α , and k i ( i = 0–5) in the above equations, are listed in Table 1 .
The advantage of the model is that it carries ingredients of many-body interactions and the non-spherical distribution of electrons is considered in the calculations. In addition, the model indicates readily the difference between the atomic interaction in the body and the interaction near the surface. In this paper, the atomic electronic density is truncated between the sixth and the seventh neighbor distances, that is, r cf = r 6e + k cf ( r 7e − r 6e ), and the cut-off distance of pair potential r ce lies between the fifth and the sixth neighbor distances, where k cf is a model parameter needed to be fitted to obtain the atomic electronic density and its first and second derivatives.
Table 1.
Table 1.
Table 1.
Model parameters for Ag.
.
F 0 /eV
n
α /eV
k 0 /eV
k 1 /eV
k 2 /eV
k 3 /eV
k 4 /eV
k 5 /eV
1.85
0.82
–0.00017
0.28217
0.14745
–0.08033
0.00030
0.08466
–0.55494
Table 1.
Model parameters for Ag.
.
3. Surface lattice dynamics
For the Bravais crystals, the particles in a given layer are identical, the phonon frequency ω and the phonon polarization vector e of the vibrational mode of a slab satisfy the following equation in the harmonic approximation: [ 24 , 25 ]
where α , β = 1, 2, 3 refer to the Cartesian coordinates, l and l′ denote the l -th and the l′ -th atom layers, respectively, and q = ( q x , q y ) is the two-dimensional propagation vector, which is parallel to the surface plane. The elements of the dynamical matrix D αβ ( ll′ , q ) are given by
where M is the mass of the atom, Φ αβ ( il , jl′ ) is the atomic force constant, which represents the force in the α direction on the i -th atom in the l -th layer when the j -th atom in the l′ -th layer moves a unit distance in the β direction, and can be calculated by evaluating the second derivatives of the total energy of system E t with respect to the atom displacement
From Eqs. ( 1 ), ( 9 ), and ( 10 ), we can obtain the expression of the dynamical matrix. For convenience, we take the atom mass M to be 1, and then the dynamical matrix is expressed as
where
in which ρ m and P m ( m = l , l′ , l 0 ) are the spherical electron density and the non-spherical electron density on the m -th plane, respectively, r i j = r ( il , jl′ ) is the distance between the i -th atom in the l -th layer and the j -th atom in the l′ -th layer, the other distances such as r ik and r jk have the same meaning, and ( ′ ) and ( ″ ) represent the first and the second derivatives, respectively. In the calculation, k ( l 0 ) runs over all the atoms in the l 0 -th plane, and j ( l′ ) runs over all the atoms in the l′ -th plane. The phonon frequency ω and the polarization vector e can be obtained by determining the force constant and the dynamical matrix of the slab, then solving the following determinantal equation:
4. Computational details and results
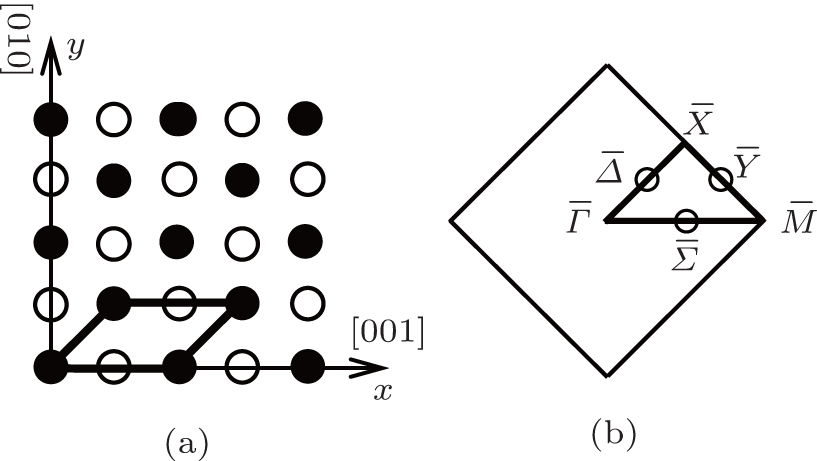
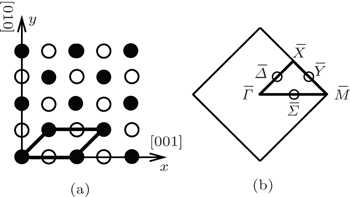
In the calculation of interlayer force constants and phonon dispersion relations, we use a slab model of the (100)-oriented plane of an fcc lattice. The real space unit cell of the (100) surface is shown in Fig. 1(a) , in which the x and y directions are along [001] and [010], respectively, the solid circles and open circles represent the first layer atoms and the second layer atoms, respectively, and the thick lines refer to the (1×1) unit cell. The first Brillouin zone for the (100) surface of the fcc crystal is depicted in Fig. 1(b) , with the notation defined by Allen et al . [ 24 ] Following the notation, the symmetrical points and lines in the two-dimensional Brillouin zone are labeled by barred letters to distinguish them from points in the threedimensional zone. The region enclosed by the thick lines is the irreducible element, which can be mapped into the rest of the BZ under the two-dimensional symmetry operations. Most of the calculations reported in this paper are for values of q lying along the boundaries of the irreducible element. In the calculation of the pair potential contributions to the force constants between planes, only atom j in the l′ -th layer, which separates from atom i by a distance shorter than the cut-off distance of interaction potential r ce , is considered. Analogously, to calculate the embedding function and the modified term contributions to the force constants, we take into account only the atom in the l′ -th layer which is located at a distance less than the cut-off distance of the atomic electronic density r cf from atom i .
Fig. 1. (a) Real and (b) reciprocal space unit cells of the fcc (100) surface.
The lattice relaxation is calculated for an Ag (100) slab with 31 atomic layers by minimizing the potential energy. The changes in interlayer spacing for the relaxed surface are found to be Δ 12 = −0.0364 Å and Δ 23 = −0.0102 Å. The calculated results in this work agree with the experimental data Δ 12 = ± 0.03 Å and Δ 23 = ± 0.03 Å obtained by the lowenergy electron diffraction (LEED), [ 26 ] though the latter are affected by a large experimental error. The only anomaly lies in the second layer which shows an inward movement. The phenomenon has not been observed in other theoretical calculations except for the original EAM developed by Foiles et al . [ 27 ] It is partly because neither the MAEAM nor the EAM model consider the formation of an electronic surface state, which can increase the charge density on the surface.
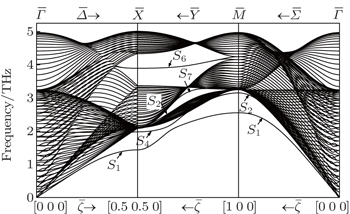
We perform a numerical calculation of the surface phonon dispersion on the relaxed Ag (001) surface along three major symmetry directions , and X̄ M̄ . The calculated phonon dispersion curves are shown in Fig. 2 , where the thick solid lines represent the surface modes, the thin solid lines refer to the bulk modes, and is the reduced wave number. The physical meaning of the notations in the figures including and can be found in Ref. [ 24 ]. From Fig. 2 , a number of features can be obtained. Firstly, the dispersion branch corresponding to mode S 4 is located mostly in bulk bands along the direction, which is identified as a surface mode by a comparison of its polarization direction with that of the bulk mode surrounding it. Secondly, each of the surface-mode branches is degenerated into two dispersion branches (i.e., double degeneracy) due to the considered slab having two surfaces. The degeneracy disappears for mode branch S 1 near long wavelength (about ) because of a stronger coupling between the two surfaces at low frequency. As the atomic layer of the slab increases, the degeneracy will move toward low frequency. Thirdly, near the point X̄ along the X̄ M̄ direction, the surface mode S 2 splits off from the bulk band edge, which is not seen in the other calculations of surface vibration to the best of our knowledge. Fourthly, the inspection of the polarization vectors of the vibration modes shows that there are a number of surface modes at point X̄ , which lie very slightly under the bulk band. So the modes are difficult to see and tag in Fig. 2 . An analogous situation exists at point M̄ and also at the bottleneck in the second bulk band along the X̄ M̄ direction. The modes have characteristics of surface mode, namely, the polarization vectors of the modes are large near the surface, and then show a rapid decrease with increasing atomic layer from the surface.
Fig. 2. Surface phonon dispersion curves for a 31-layer Ag slab with (100) face.
Some of these modes have also been detected experimentally in helium-atom scattering and electron energy-loss spectroscopy experiments. [ 28 , 29 ] These results are respectively shown by the open squares and closed circles in Fig. 3 , where the thick solid lines still represent the theoretical surface modes, and the dashed lines denote the bulk band edges (BBE). The Rayleigh modes S 1 along and S 4 along calculated in this paper are in good agreement with the EELS experimental results. Especially in ranges of along the direction and along the direction, the phonon frequencies reproduce very well the experimental results. The corresponding dispersion curves of the two modes are very similar to the HAS experimental dot curves, though the phonon frequencies in the present calculation are generally lower than the HAS experimental data. The maximum discrepancy between calculated and experimental frequencies is about 10.4%, which appears in mode S 4 at point X̄ . The discrepancy may result from that the present calculations are within harmonic approximation and do not take into account the electronic contribution to the dynamical matrices, whereas the measurements are obtained on conditions that the effects are not negligible. The surface modes S 2 , S 6 , and S 7 on the Ag (100) surface have not yet been identified for various reasons, [ 30 ] consequently, there are no corresponding experimental data for comparison. Fortunately, the surface modes on the Ag (100) surface have been calculated by the density functional perturbation theory (DFPT), [ 31 ] first-principles (FP) theory, [ 32 ] and the original EAM method [ 33 ] respectively. A comparison of the surface modes at X̄ and M̄ for Ag (100) obtained by several theoretical methods is given in Table 2 . We can see from Table 2 that the phonon frequencies of S 2 at X̄ and M̄ obtained by MAEAM are lower than those by other calculations with a maximum deviation of 0.33 THz, and the maximum deviation of mode S 6 at X̄ is 0.34 THz. On the whole, the present results are in good agreement with the FP values, and are slightly lower than the calculated data by DFPT and EAM.
Fig. 3. Comparisons between calculated and experimental phonon frequencies.
Table 2.
Table 2.
Table 2.
Comparison of surface phonon frequencies for Ag (100) at X̄ and M̄ obtained by different mehtods (in units of THz).
.
X̄
M̄
Method
S 1
S 2
S 4
S 6
S 1
S 2
1.44
2.12
1.97
3.89
2.55
3.15
MAEAM
1.54
2.36
2.17
4.23
2.78
3.45
DFPT
1.40
2.20
2.10
4.11
2.49
3.19
FP
1.55
2.35
2.10
3.95
2.78
3.48
EAM
Table 2.
Comparison of surface phonon frequencies for Ag (100) at X̄ and M̄ obtained by different mehtods (in units of THz).
.
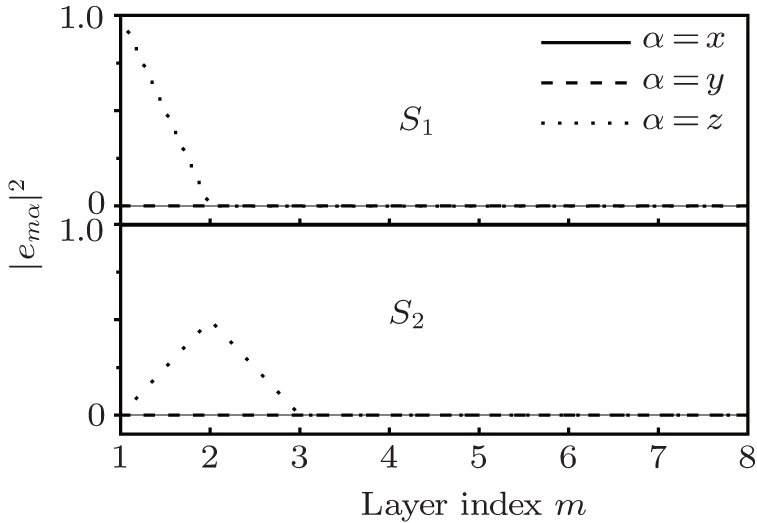
According to the theory of surface lattice dynamics, due to the reflection symmetry along and the surface modes are divided into two groups, one group of modes polarize strictly within a sagittal plane and the other group of modes polarize strictly perpendicular to the sagittal plane. [ 24 ] An inspection of the polarization vectors calculated by us shows that along the direction, the modes S 1 , S 2 , and S 6 all polarize in the xy plane, while the mode S 4 polarizes along the z direction. Along the direction, the modes S 1 and S 2 both polarize in the z direction. The polarization vectors of the surface modes S 1 , S 2 , S 4 , and S 6 at the X̄ point and S 1 , S 2 at the M̄ point are shown in Figs. 4 and 5 , respectively, in which the squared polarization vectors of the modes | e mα | 2 are plotted as a function of the layer index m , with m = 1 for the surface layer. It can be seen from Fig. 4 that modes S 1 and S 2 both polarize in the xy plane, and are localized on the first and the third layers, respectively, while mode S 4 is primarily a shear vertical mode, and is predominantly localized in the first layer. The mode S 6 is primarily a longitudinal mode, and primarily associated with the vibration parallel to the propagation direction. At the M̄ point, modes S 1 and S 2 are both shear vertical modes, which are localized on the first and second layers, respectively (see Fig. 5 ). Mode S 7 is localized primarily in the third layer, and polarizes along the z direction (it is not shown here).
Fig. 5. Polarizations of surface modes at point M̄ .
In addition, there are two special points in the two figures. First, the surface modes S 1 and S 2 are shear horizontal (SH) modes at X̄ point, however these modes become shear vertical (SV) modes at M̄ point. Going from X̄ to M̄ , the modes bear a change from SH to SV. The same result for mode S 1 was observed on the Ag (100) surface by first-principles calculation. [ 32 ] Second, at point X̄ , the modes S 1 and S 2 are concentrated almost entirely in the first and the third layers, respectively, and at point M̄ , the modes S 1 and S 2 are localized almost entirely on the first and the second layers, respectively. That is to say, at these points, the surface modes are “singlelayer” modes in which the first, second, or third layer vibrates almost independently of all other layers.
5. Conclusion
Under the present experimental conditions, the frequently-used experimental methods, such as the inelastic helium-atom scattering and the electron energy-loss spectroscopy, only identify a few surface modes. Therefore, it is particularly important to obtain the first hand theoretical data of the surface modes by means of computer calculation: they are used to further judge and guide the experiments. In this paper, with the harmonic approximation, the MAEAM is used to derive the expressions of the dynamical matrices of the surface lattice, and then the phonon dispersion relations along three major symmetry directions , and X̄ M̄ are obtained for an Ag (100) slab with 31 atomic layers. The calculated results are compared with the available experimental data and some theoretical results. The calculated results are generally consistent with the experimental and theoretical results. In addition, we discuss and analyze the polarizations and localizations of surface modes at points X̄ and M̄ .


 ]
]