


Effects of q -profiles of a weak magnetic shear on energetic ion excited q = 1 mode in tokamak plasmas
[Li Ze-Yu 1 , Wang Xian-Qu 2, †,  , Wang Xiao-Gang 3 ]
, Wang Xiao-Gang 3 ]
|
|


† Corresponding author. E-mail:
Project supported by the National Magnetic Confinement Fusion Science Program of China (Grant No. 2014GB107004) and the National Natural Science Foundation of China (Grant Nos. 11575014, 11375053, 11475058, and 11261140326).
In this paper, we study the effect of safety factor profiles, particularly with a very weak magnetic shear, on the m / n =1 mode excited by energetic ions in tokamak plasmas. It is found that the profile plays a significant role in the onset of the mode, and the thresholds for the instability are also derived. The numerical results for configurations with conventional or reversed non monotonic magnetic shears are discussed. The effects of radial location of rational surfaces, edge q value, and flatness of q -profile on the energetic ion excited mode are further analyzed in detail.
The effect of trapped energetic particles (EPs) on magnetohydrodynamics (MHD) modes has been comprehensively studied for decades. [ 1 – 4 ] The fishbone as an energetic particle mode (EPM) on the q = 1 rational surface, associated with the loss of fast ions, was first discovered in the poloidal divertor experiment (PDX) during high-beta operations with neutral beam injection (NBI). [ 1 ] This mode has a high frequency and a low frequency branch, corresponding to ω ≫ ω * and ω ∼ ω * respectively, [ 5 – 9 ] where ω * is the ion diamagnetic frequency. It was shown that the precession and diamagnetic drift frequencies of the fast ions play an important role in destabilizing the mode. [ 8 , 9 ]
For the conventional magnetic shear regime, when the frequency of the mode is close to the fast ion precession frequency, ω ∼ ω dh , fast ions can drive the instability significantly by Alfvén resonance. [ 2 , 5 ] The analytic study of this mode was first derived by Chen based on a generalized energy principle. [ 2 ] The dispersion relation of fishbone mode has been obtained as D ( ω ) = 0. If the mode frequency is close to ω * , the low-frequency fishbone mode can be excited by ion diamagnetic drift, corresponding to the diamagnetic fishbone mode. [ 8 ] On the other hand, fast electron-driven fishbone-like mode has been observed during electron cyclotron resonance heating (ECRH) in tokamak experiments, such as DIII-D, [ 10 ] HL-2A, [ 11 – 14 ] and EAST. [ 15 ] For a positive magnetic shear, the fishbone instability can be excited, depending on q ′ = d q /d r at q = 1 surface. [ 16 , 17 ] Therefore, the q -profile effect may play an important role in the dynamics of the mode.
On the other hand, for the reversed magnetic shear regimes, the conventional fishbone analysis may be invalid to explain the fast ion driven modes. [ 6 , 7 ] While q 0 , is close to unit, this mode has been observed with a non-monotonic q -profile in DIII-D, [ 10 ] NSTX, [ 18 ] and MAST. [ 19 ] The growth rate of the kink mode with the reversed magnetic shear given is also valid in q min > 1 and 
In this paper, we apply ITER-like parameters and study the linear stability of the modes with different q -profiles. Including the diamagnetic effect, the numerical result for the modes with special parameters setting is in good agreement with the prediction of the linear theory. In addition, we also study the reserved shear mode with q min > 1 and q min < 1, and the main parameters of MHD and fast ion are discussed.
This rest of this paper is organized as follows. In Section 2, we discuss the theoretical model and the dispersion relation of the mode. In Section 3, the effects of monotonic or nonmonotonic q -profile on the mode are shown by numerical analysis, respectively. Finally, the discussion and conclusion are presented in Section 4.
We first outline the previous analysis of the q = 1 mode in the weak magnetic shear regime with a monotonic or a nonmonotonic q -profile respectively. The MHD potential energy and the kinetic contribution of trapped fast ions of the m / n = 1/1 mode are written as [ 2 , 5 ]


The dispersion relation in this case can be written as [ 2 , 8 , 9 ]


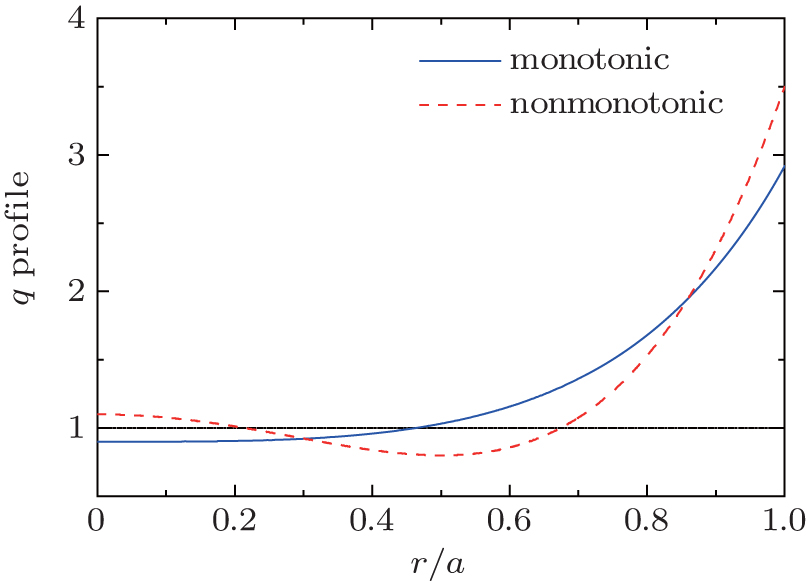 | Fig. 1. Two types of q -profiles in different magnetic shear regimes, the monotonic q ( r ) = q 0 (1 + 0.8 r α ) 2 with the positive magnetic shear (the blue solid), and the nonmonotonic q ( r ) = q min + q c (1 − ( r / r m ) α ) 2 with a reversed magnetic shear (the red dashed). |
For the purely growing mode, ω = i γ , in the δ Ŵ MHD = 0 case, the growth rate of the mode is


We assume that the q -profile is in the form of q ( r ) = q min + q c (1 − ( r / r m ) α ) 2 , where q ( r m ) = q min , as shown by the red dashed curve in Fig.


In the regime of q min < 1, Δ q < 0, there are double rational surfaces of q = 1. For flattened q -profiles with a finite Δ q , the rational surfaces are far away from q = 1 and both current driven and the coupling of the two surfaces are very weak. For flattened q -profiles with a finite Δ q , the rational surfaces are far away from each other and both current driven and the coupling of the two surfaces are very weak. Then without EPs, the MHD branch of the mode is stable. Nevertheless, for a very small |Δ q |, the two resonant surfaces can be very close to each other and the MHD branch of the mode may become unstable. The threshold Δ q can be given by 


Numerical results of energetic particles driven q = 1 mode are represented in this section. In Subsections 3.1 and 3.2 we show results for monotonic and nonmonotonic q -profiles respectively, with a weak magnetic shear. In the calculation, we change the parameters of the q -profile in order to discuss the influence of a certain q -profile. Other parameters applied are ITER design parameters, with the major radius of R = 6.2 m and the minor radius of a = 2 m, and thus the inversed aspect-ratio ∼ 0.3. For the toroidal magnetic field B T = 5.3 T and the density of plasma of n = 10 20 m −3 , [ 17 ] we get the Alfvén frequency ω A = V A / R 0 ≈ 1.3 × 10 6 s −1 . For trapped energetic particles with an energy of E m ∼ 1MeV, their toroidal precession frequency normalized by the Alfvén frequency is about ω dm ≈ 0.01 ω A . [ 17 ] For the ion diamagnetic effect, the typical ion diamagnetic frequency for ITER is about ω * ≈ 0.001 ω A . [ 17 ] The pressure profile we used in the numerical discussion is in a form of p ( r ) = p 0 (1 − r 2 ), and r is already normalized by minor radius. [ 20 ]
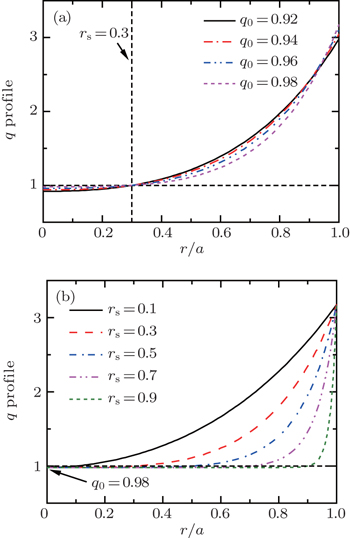
We first apply a monotonic q -profile in the form of q ( r ) = q 0 (1 + 0.8 r α ) 2 to approximate a profile of ITER plasmas. [ 17 ] There are two different ways to change the q -profile as shown in Fig.
 | Fig. 2. Profiles of q ( r ) = q 0 (1 + 0.8 r α ) 2 . (a) r s = 0.3 with q 0 varying from 0.92 to 0.98, and (b) q 0 = 0.98 with r s varying from 0.1 to 0.9. |
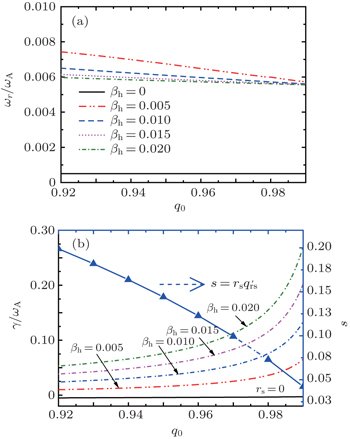
The mode frequency and growth rate as a function of q 0 are shown in Fig.
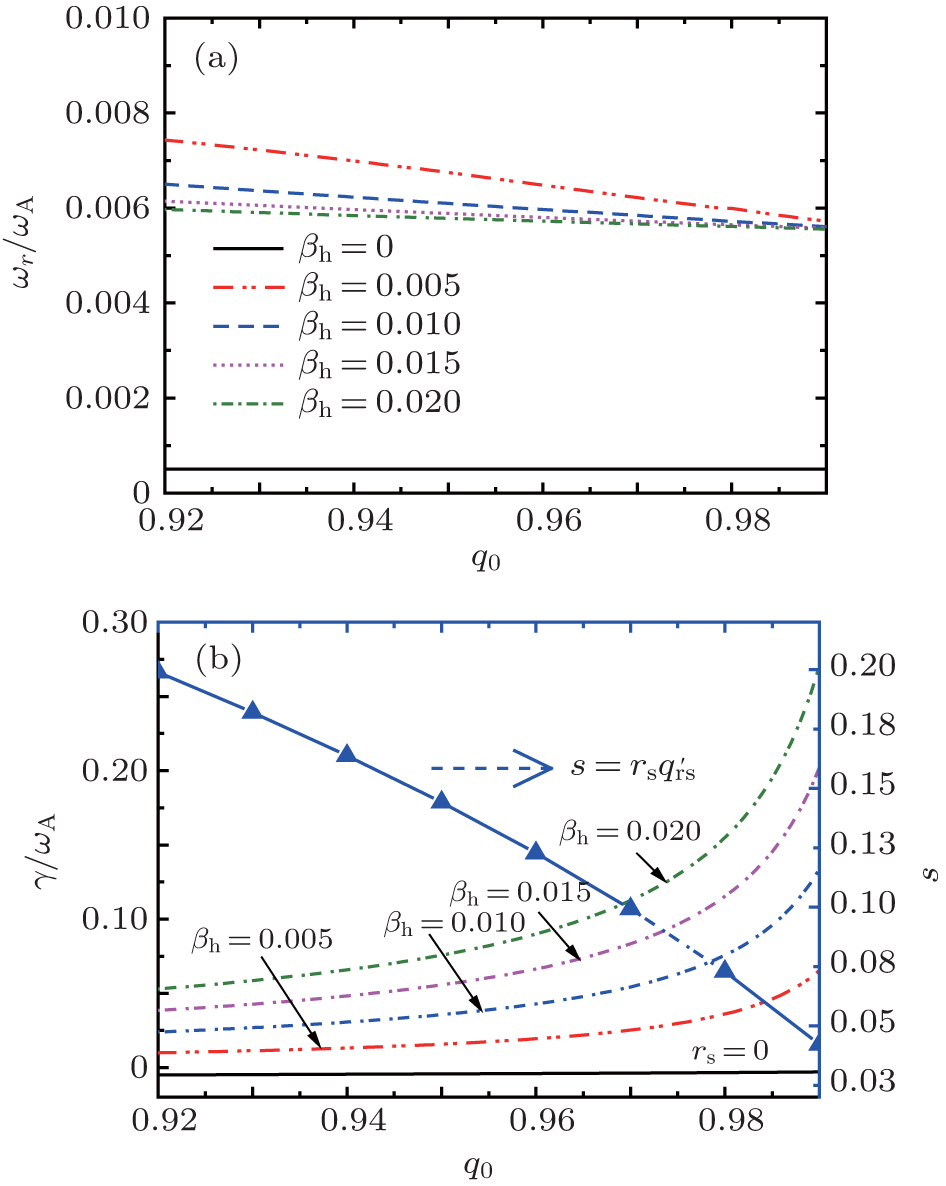 | Fig. 3. The mode frequency (a) and growth rate (b) as a function of q 0 . |
The mode frequency and growth rate as a function of q 0 are shown Fig. 
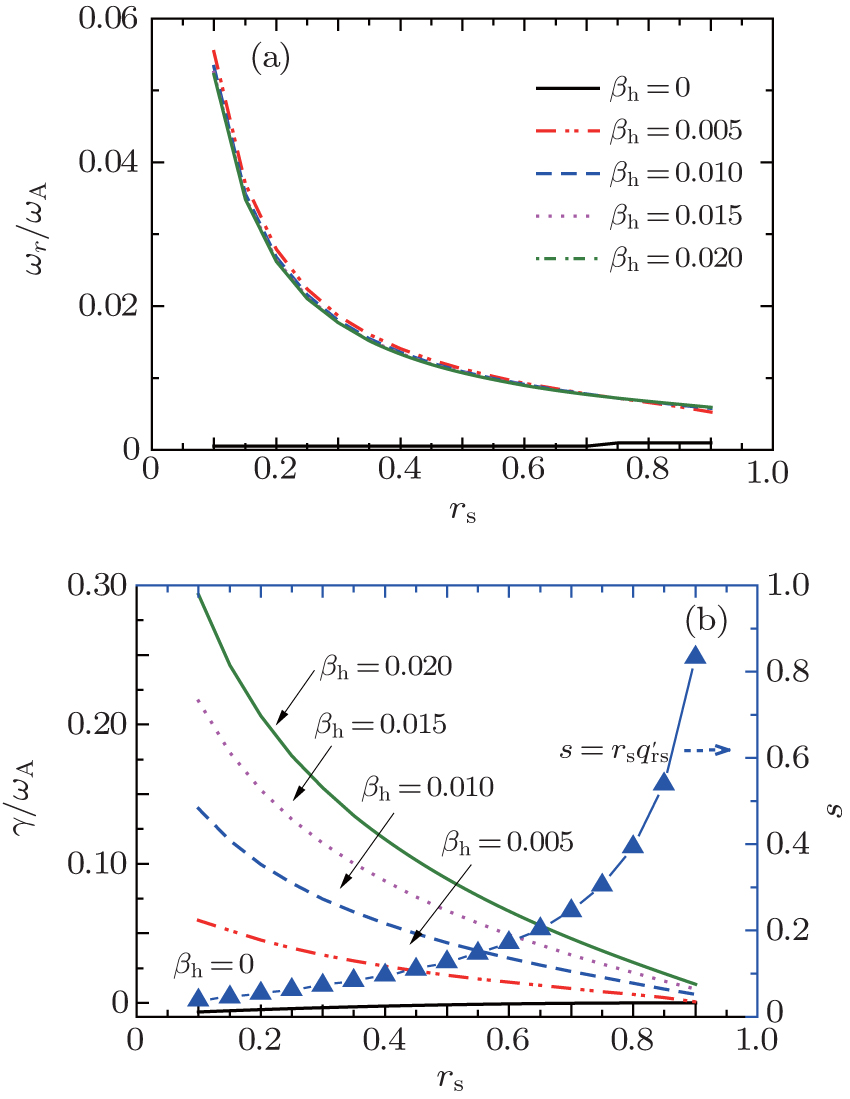 | Fig. 4. The mode frequency (a) and growth rate (b) as a function of r s . |
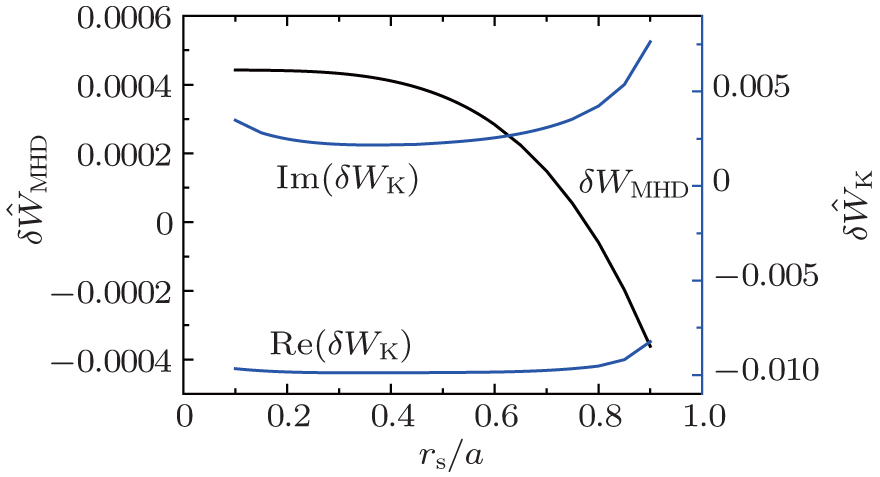 | Fig. 5. The MHD potential δ Ŵ MHD (black) and the energetic particle contribution δ Ŵ K (blue) as a function of r s . |
In this subsection, we further discuss effects of the q -profile with reversed shears. The equilibrium q -profile is chosen as q ( r ) = q min + q c (1 − ( r / r m ) α ) 2 . In this kind of profile, the safety factor reaches its minimum q min , at r = r m , and q 0 = q min + q c . We then explore the influence of such q -profile on the mode.
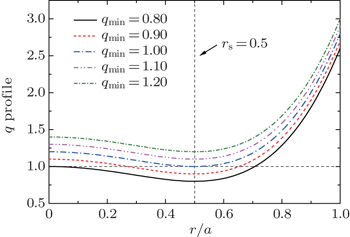
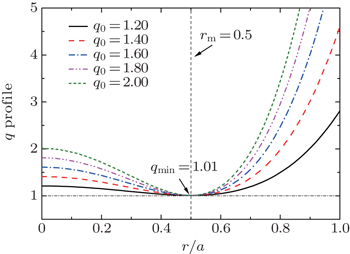
We lift the q -profile up entirely at first by changing q min from 0.80 to 1.20 and fixing other parameters as q c = 0.2, r m / a = 0.5, and α = 2 as plotted in Fig.
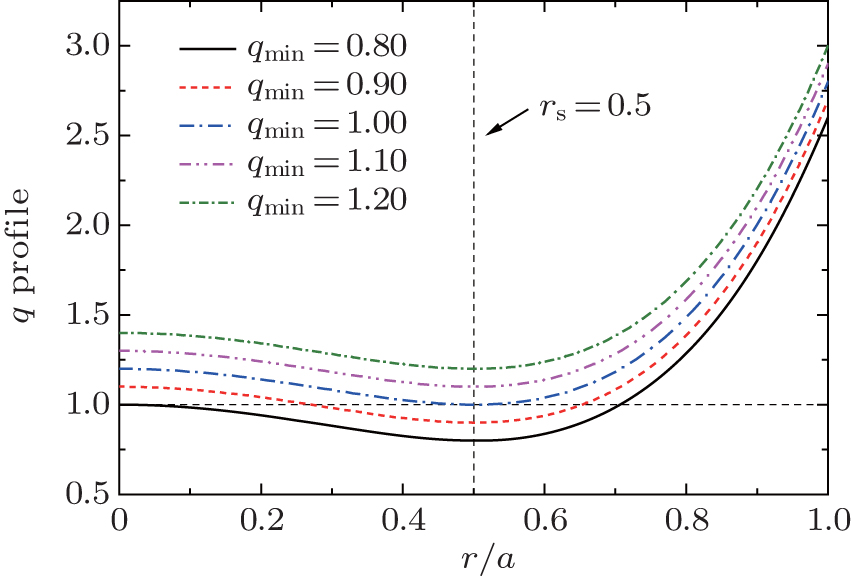 | Fig. 6. Profiles of q ( r ) = q min + q c (1 − ( r / r m ) α ) 2 with q c = 0.2, r m = 0.5, α = 2, and a changing q min from 0.80 to 1.20. |
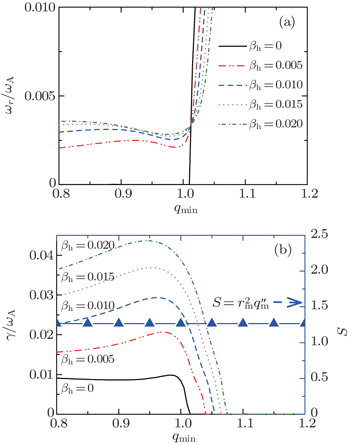
The mode frequency and growth rate are shown in Fig.
 | Fig. 7. The mode frequency (a) and growth rate (b) as a function of q min . |
Moreover, at r = r m , the safety factor reaches its minimum and the magnetic shear ŝ = rq ′/ q vanishes. We therefore introduce a modified magnetic shear by taking the second derivative of the safety factor function to estimate the magnetic field line bending effect as 
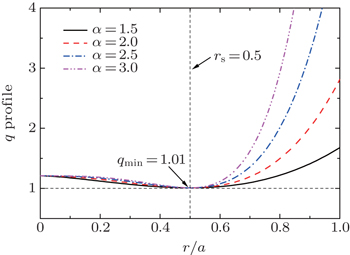
Thus we keep q min = 1.01, q c = 0.2, r m / a = 0.5, and vary the parameter α only, to focus on the effect of the profile shape on the mode, as shown in Fig.
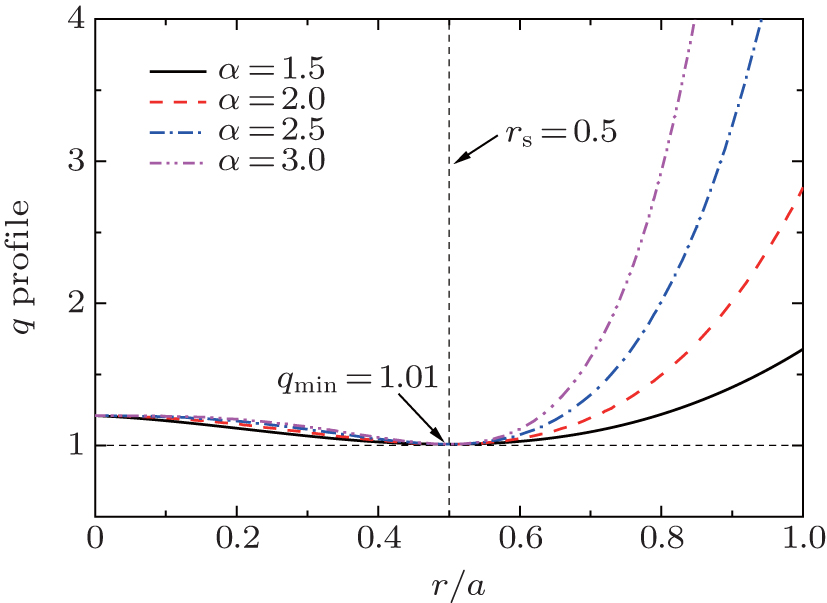 | Fig. 8. Profiles of q ( r ) = q min + q c (1 − ( r / r m ) α ) 2 with q c = 0.2, r m = 0.5, q min = 1.01, and a changing α from 1.5 to 3.0. |
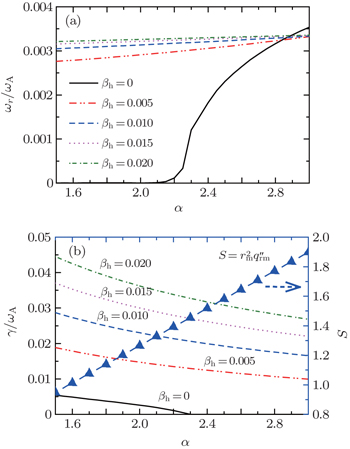
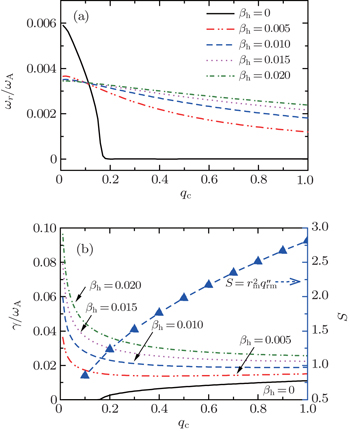
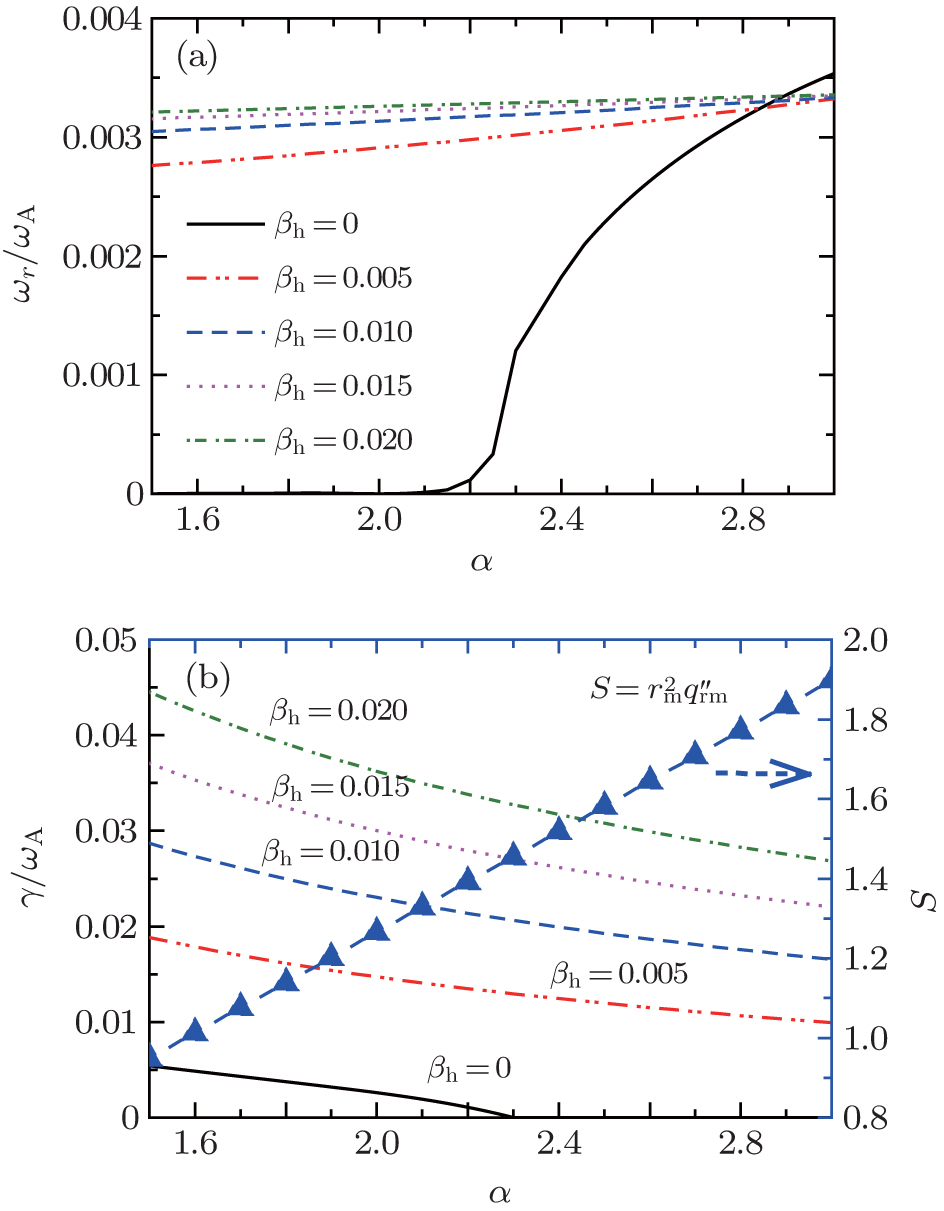 | Fig. 9. The mode frequency (a) and the growth rate (b) as a function of α . |
The magnetic field line bending effect influenced by the modified magnetic shear S is the main stabilizing mechanism of the mode. We see that S increases with α . Therefore, the mode growth rate of the EP branch falls as α increases.
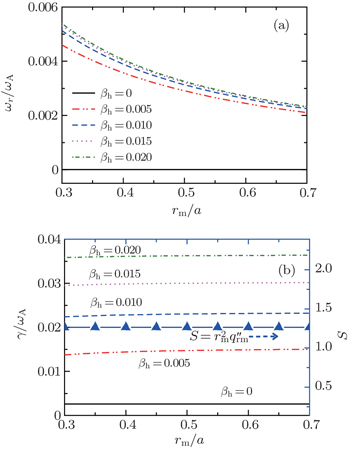
We then fix q c = 0.2, α = 2, and q min = 1.01, but only change r m from 0.3 to 0.7, as plotted in Fig.
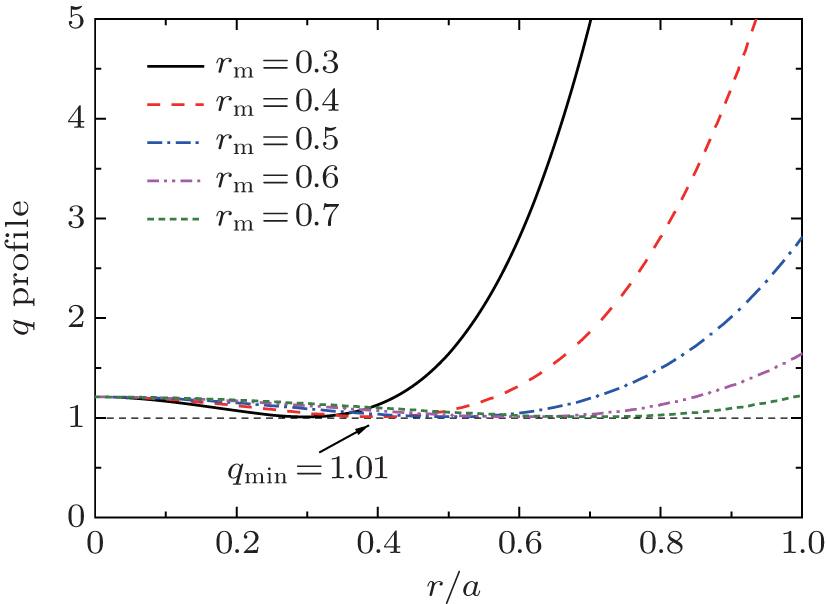 | Fig. 10. Profiles of q ( r ) = q min + q c (1 − ( r / r m ) α ) 2 with q c = 0.2, α = 2, q min = 1.01, and a changing r m from 0.3 to 0.7. |
 | Fig. 11. The mode frequency (a) and growth rate (b) as a function of r m . |
The q -profiles with q c changing but other parameters fixed are shown in Fig.
 | Fig. 12. Profiles of q ( r ) = q min + q c (1 − ( r / r m ) α ) 2 with r m = 0.5, α = 2, q min = 1.01, and a changing q c from 0 to 1.0. |
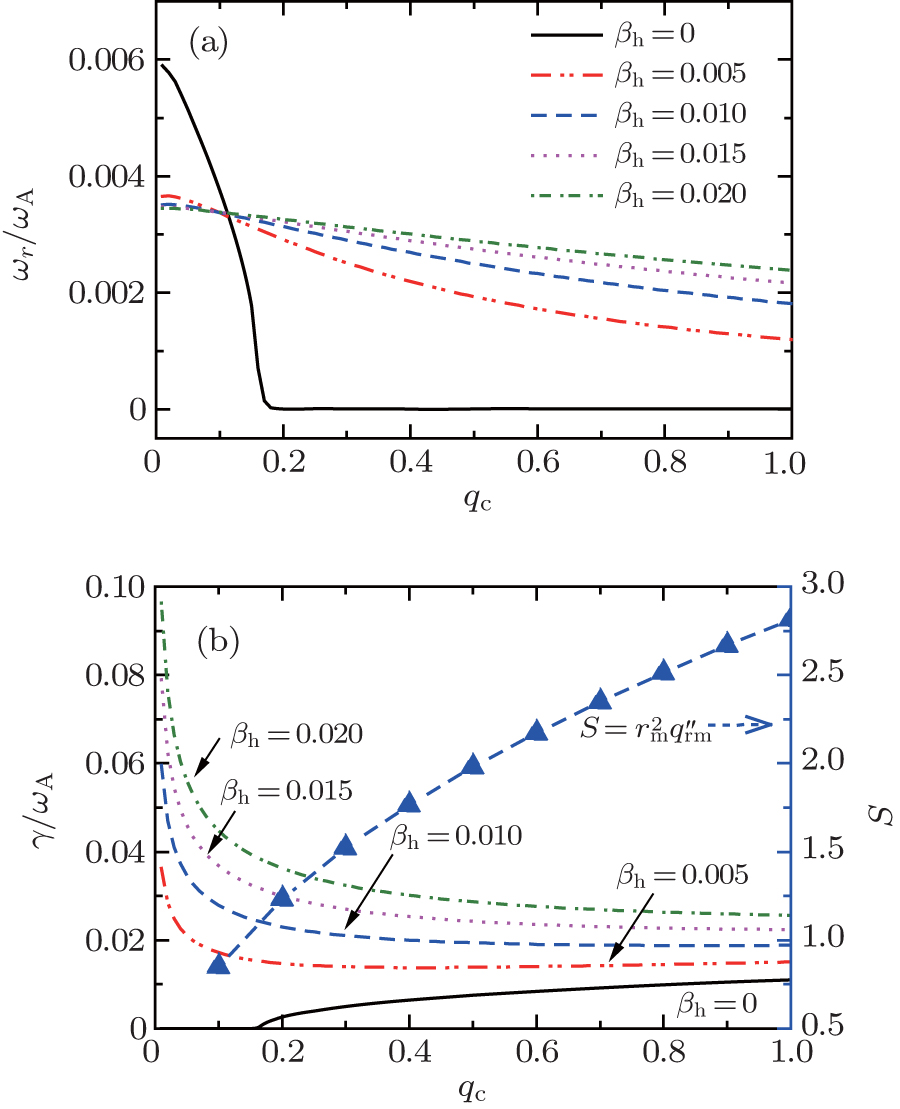 | Fig. 13. The mode frequency (a) and growth rate (b) as a function of q c . |
In this paper, we have studied the effect of q -profile on the linear stability of the q = 1 mode with different regimes of the magnetic shear. The dispersion relation of the mode is given by a modified fishbone model for both monotonic and nonmonotonic q -profiles. For ITER-like parameters, we calculated the dispersion relation of the mode and make a comparison with theory. It is found that the current profile, i.e., the q -profile, can significantly change the stability feature of the mode. The EP-dominant instability excited at the q = 1 surface is tested numerically. The non-resonant mode with q min > 1 due to the pure fast ion driven is also numerically studied for different types of q -profiles with key parameters varying respectively. It is found that there are two main factors influencing the instability significantly, the MHD potential energy and the magnetic shear. The MHD potential is affected by many factors, such as the central safety factor, the minimum safety factor, and the location of rational surface etc. As for the magnetic shear, it plays an important role in stabilizing both the MHD and the EP branches in the weak magnetic shear regime.
| 1 | |
| 2 | |
| 3 | |
| 4 | |
| 5 | |
| 6 | |
| 7 | |
| 8 | |
| 9 | |
| 10 | |
| 11 | |
| 12 | |
| 13 | |
| 14 | |
| 15 | |
| 16 | |
| 17 | |
| 18 | |
| 19 | |
| 20 | |
| 21 | |
| 22 | |
| 23 | |
| 24 | |
| 25 | |
| 26 |