

Predetermined control of turbulent boundary layer with a piezoelectric oscillator
[Zheng Xiao-Bo 1 , Jiang Nan 1, 2, †,  , Zhang Hao 1 ]
, Zhang Hao 1 ]
|
|


† Corresponding author. E-mail:
Project supported by the National Natural Science Foundation of China (Grant Nos. 11332006, 11272233, and 11411130150) and the National Basic Research Program of China (Grant Nos. 2012CB720101 and 2012CB720103).
With a piezoelectric (PZT) oscillator, the predetermined controls of the turbulent boundary layer (TBL) are effective in reducing the drag force. The stream-wise velocities in the TBL are accurately measured downstream of the oscillator driven by an adjustable power source. The mean velocity profiles in the inner and outer scales are reported and the skin friction stresses with different voltage parameters are compared. Reduction of integral spatial scales in the inner region below y + of 30 suggests that the oscillator at work breaks up the near-wall stream-wise vortices responsible for high skin friction. For the TBL at Re θ of 2183, the controls with a frequency of 160 Hz are superior among our experiments and a relative drag reduction rate of 26.83% is exciting. Wavelet analyses provide a reason why the controls with this special frequency perform best.
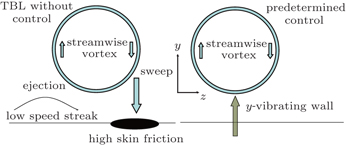
High skin friction generated by turbulent boundary layer (TBL) flow makes the drag reduction control a significant topic not only in fluid mechanics but also in other engineering areas. Coherent structure, i.e., multi-scale quasi-order spatiotemporal structure in a self-sustaining mechanism, plays a key role in the dynamics of the TBL. [ 1 – 6 ] Among them, stream-wise vortices near the wall are responsible for high skin friction regions underneath the TBL, [ 7 , 8 ] as shown in Fig.
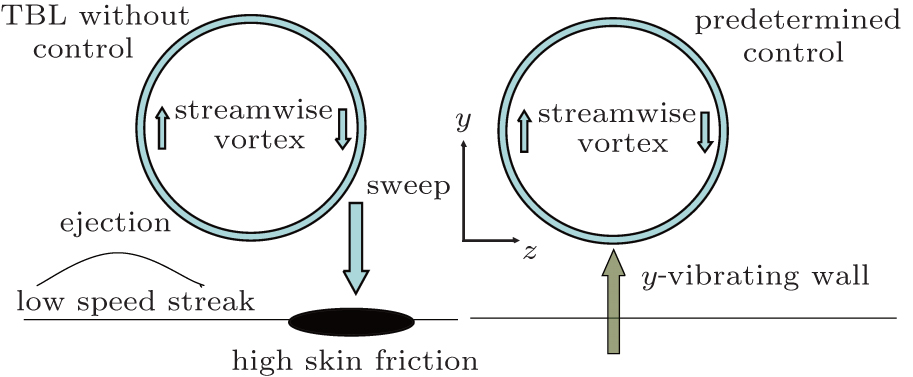 | Fig. 1. Schematic of predetermined control for drag reduction. |
Compared with passive methods, [ 13 – 18 ] the active control has a wide adaptability to complex flows and can amplify the control effectiveness with a small auxiliary energy input. [ 19 , 20 ] For the actual implementation, a predetermined method is more feasible than interactive control. [ 21 – 23 ] Because of its low power consumption, fast response and low cost, piezoelectric (PZT) material driving an oscillator with a forcing alternating voltage (AV) can be utilized as an actuator of predetermined control. [ 24 ]
In this paper, a rectangular PZT oscillator is applied. We elaborate the oscillator used and examine the effect of the varied AV amplitude and frequency. To characterize the control performance, the statistical magnitudes of the TBL, such as mean stream-wise velocities and skin friction stress, are reported. The reduction of integral spatial scale in the inner region of the TBL reflects the control influence on the stream-wise vortices near the wall. Wavelet analysis reveals on what scale these structures are and under what AV frequency the control can achieve a better drag reduction.
The experiments were conducted in an annular return wind tunnel. The TBL flow was developing along one side of a flat acrylic glass plate mounted vertically in the wind tunnel. Following the right-hand rule, the space coordinate system Oxyz is set with O as the origin at the leading edge of the plate, x as the stream-wise direction, y as the wall-normal direction, and z as the span-wise direction as shown in Fig.
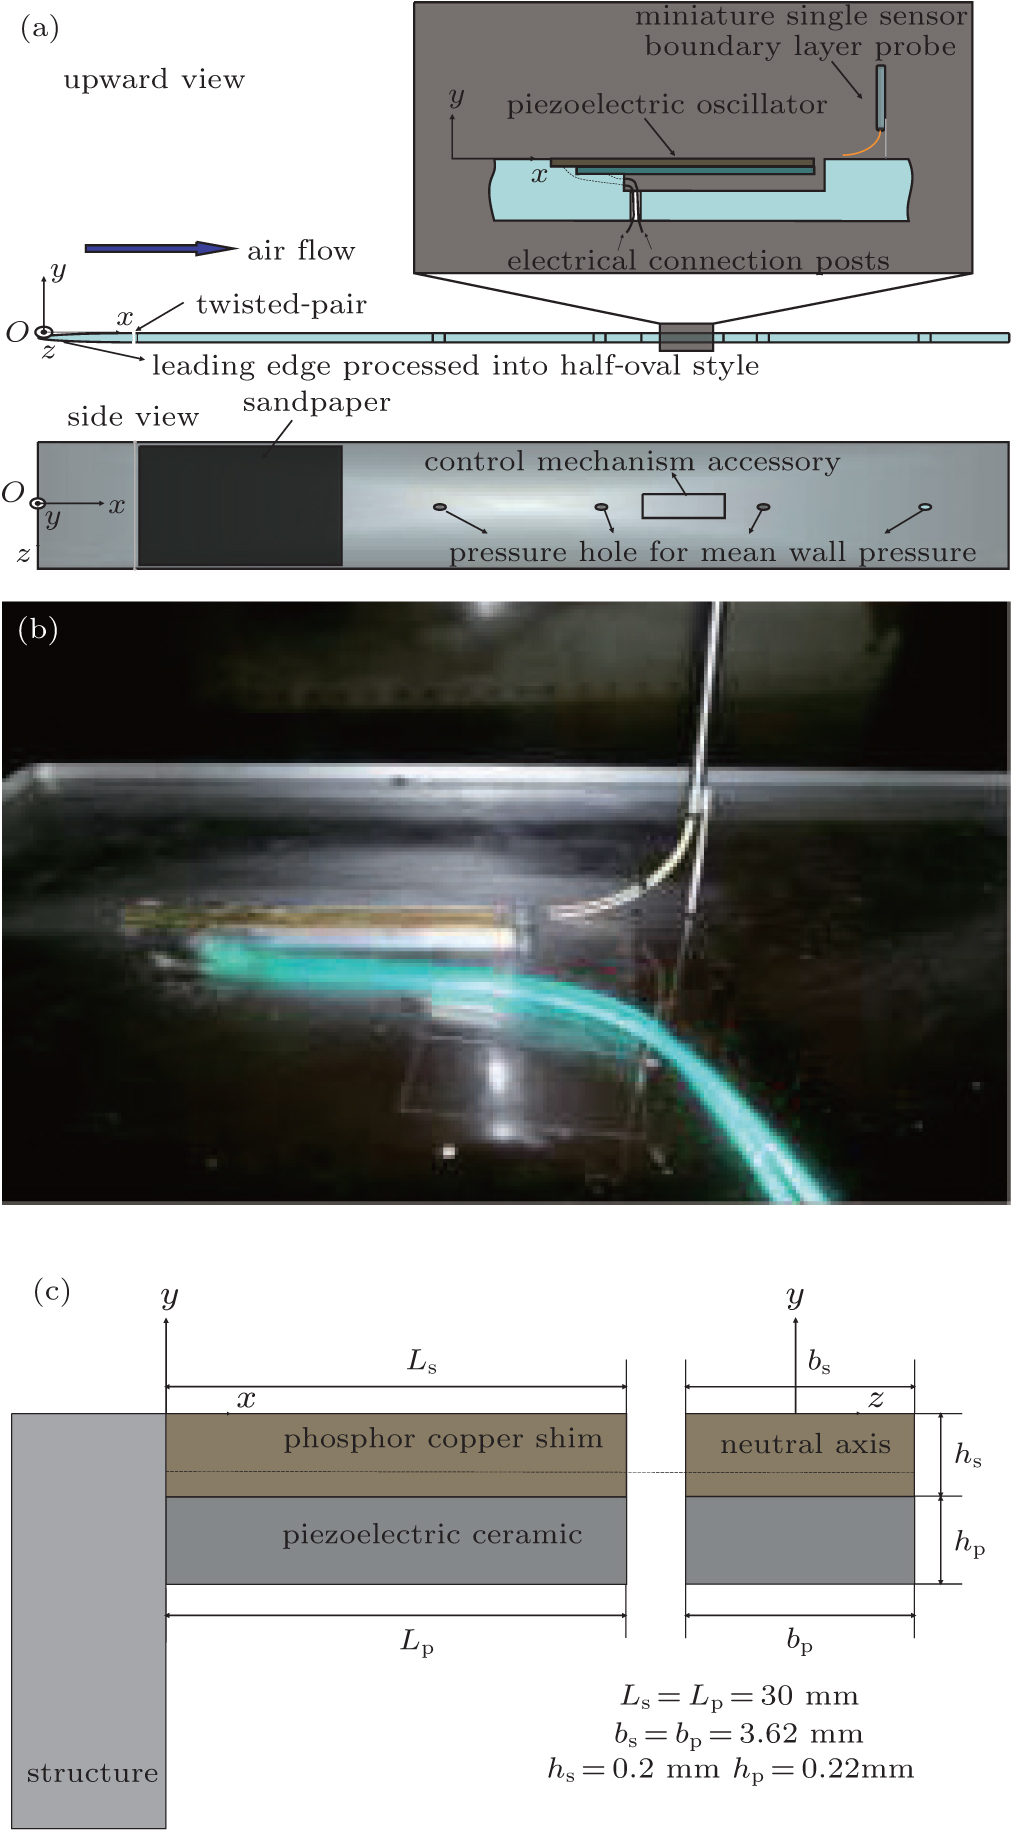 | Fig. 2. (a) Schematic of experiment set-up, (b) picture of PZT oscillator and miniature velocity probe, and (c) Euler–Bernoulli beam model of PZT oscillator. |
The control mechanism consisted of a cavity with the sizes of 32 mm × 5 mm × 5 mm and a PZT oscillator pasted firmly. The oscillator upper surface was kept flush with the flat plate. The effective length, total thickness, and the width of the oscillator were 30 mm, 0.42 mm, and 3.62 mm. The length and width were designed according to the size of the near-wall stream-wise vortex, a span-wise scale of O (100 ν / u τ ), and a stream-wise scale of O ( δ ) (both defined later). This unimorph configuration consisted of a piece of 220-μm-thick PZT-5H material and a 200-μm-thick phosphor-copper shim. The thickness of epoxy bond was negligible. To excite the PZT oscillator, we used a power source of YuanFang-GK10005 that supplies AV with adjustable frequency and amplitude in a wide range.
The PZT oscillator was modeled as a cantilever beam [ 26 ] as shown in Fig.
According to the basic geometrical information and material properties of the PZT oscillator (Table
| Table 1. Details of PZT oscillator materials. . |
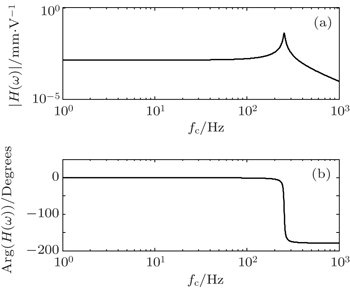
The first-order natural frequency f 1 is 254 Hz and the direct voltage (DV) gain coefficient H 0 , i.e., the tip displacement of the PZT oscillator actuated by a voltage of 1 V, is 0.0014 mm/V. These two parameters are both important for the second-order frequency response model which has been verified experimentally. [ 27 ] The model of AV gain coefficient H ( f ) can be expressed as

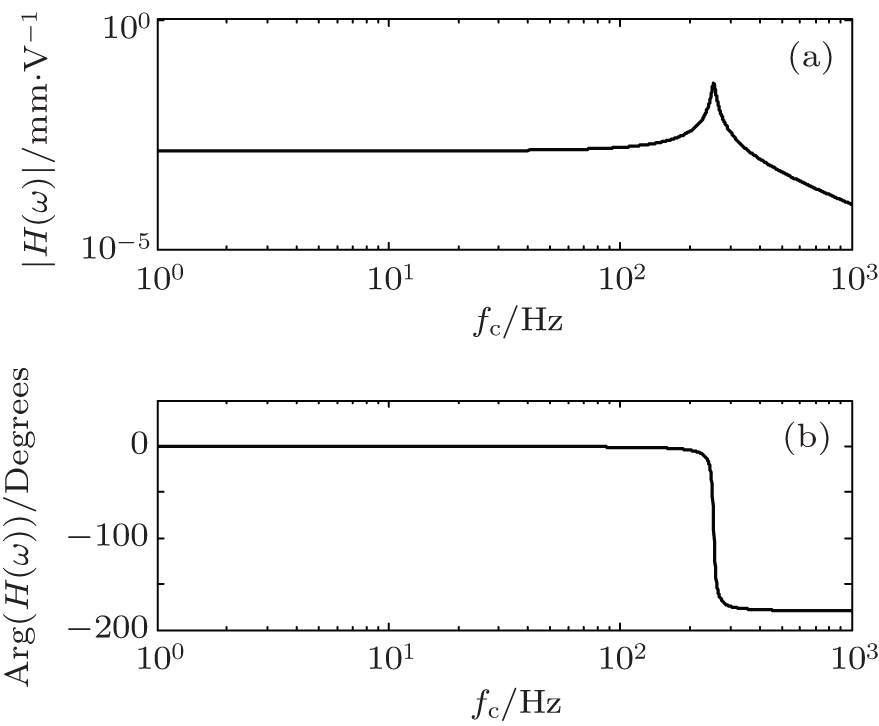 | Fig. 3. Frequency responses of PZT oscillator. (a) Amplitude–frequency curve, (b) phase–frequency curve. |
| Table 2. Drag reduction effect at x = 1002 mm. . |
Under most control conditions, the interference introduced by the PZT oscillator belongs to the category of the Hydrodynamic smooth, because their amplitudes are less than 7 wall units (1 wall unit = ν / u τ ) (∼0.257 mm). Although the amplitudes are a little bigger than the critical condition of the Hydrodynamic smooth when f c is set to be 240 Hz, the typical layered structure of the TBL is not altered, owing to the small size of the PZT oscillator compared with the whole flow field.
At x = 1002 mm, i.e., 2 mm downstream the end of the control mechanism, the stream-wise velocity components u in the TBL were accurately measured by the constant temperature anemometry of IFA-300 with a miniature boundary layer probe TSI-1621A-T1.5. The hot wire of this probe is made of tungsten (platinum coated) cylinder with a sensitive length of 1.25 mm and diameter of 4 μm. This probe was specially prepared for velocity measurement, which was located very close to the wall. [ 28 , 29 ] Before measurement, mean-flow calibration was employed twice and the error was 0.087% based on the fourth-order polynomial curve fitting. We set the sampling rate and low pass cut off frequency to be 100 kHz and 50 kHz, respectively. Time sequences of the stream-wise velocity signals at different wall-normal locations were finally achieved and each sequence consisted of 2 22 moments in about 42 s.
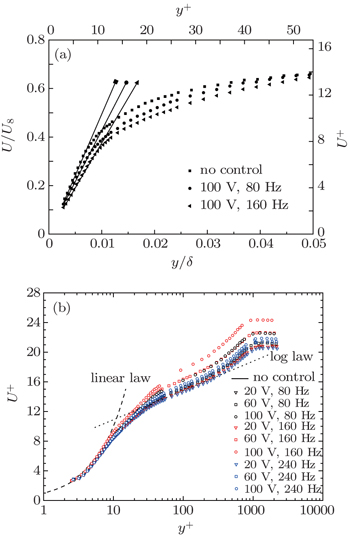
The free stream velocity U ∞ is 9.0 m/s and the TBL nominal thickness δ is 39.8 mm. Based on U ∞ and the momentum thickness θ , the Reynolds number Re θ is 2183. The outer scale mean velocity profile (scaled with δ and U ∞ ) is linear in the viscous sub-layer [ 30 , 31 ] as indicated in Fig.


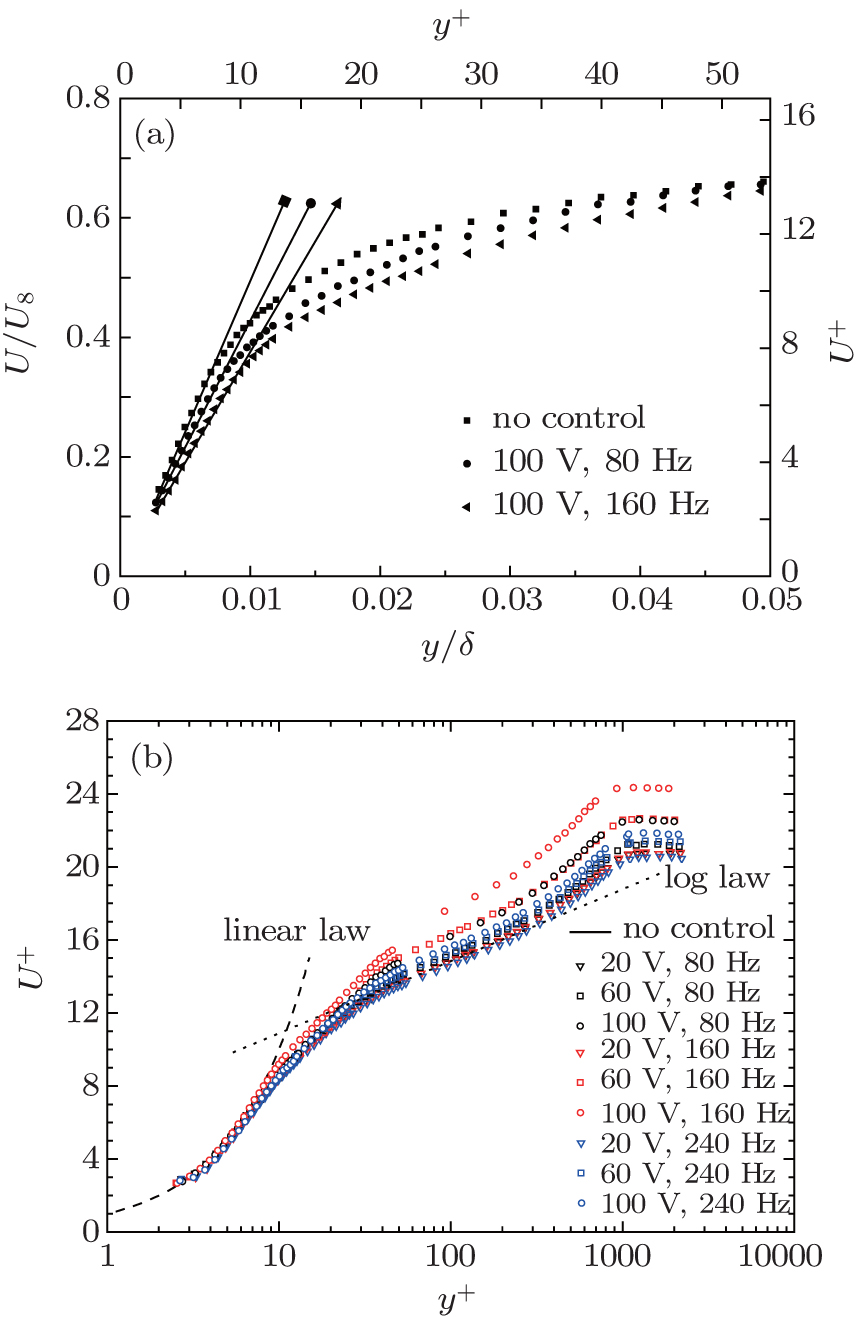 | Fig. 4. Mean velocity profiles of different control conditions in (a) outer and (b) inner scale units. |
Table 

Figure


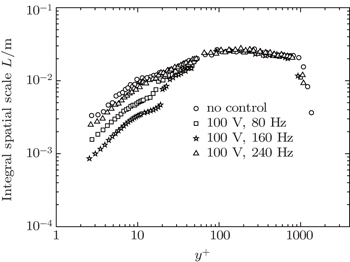
The integral spatial scale L reflects the spatial dimension of a turbulent structure in large scale with the same order of mean motion, [ 25 ] and is achieved by the auto-correlation analysis and Taylor’s frozen hypothesis as

 | Fig. 5. Profiles of integral special scale L . |
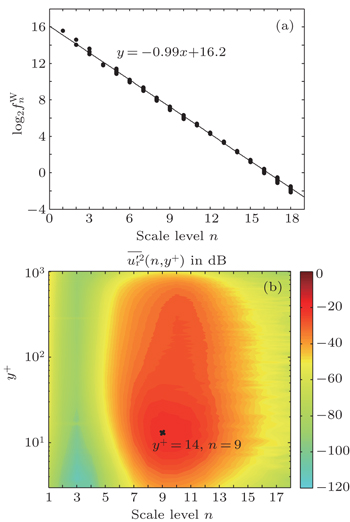
In order to detect the most energetic coherent components of TBL flow and reveal the control mechanism, Mallat pyramidal algorithm of the orthonormal discrete wavelet transform is accomplished with db5 wavelet. [ 35 , 36 ] The wavelet scale index n is linear with respect to logarithmic characteristic frequency 
 | Fig. 6. (a) Relationship between n and   |
The values of single-reconstructed velocity fluctuation 


The PZT oscillator controls of the TBL are effective in reducing the drag force, and the most relative drag reduction rate of 26.83% is noticeable. When the control frequency is fixed, the drag reduction effect is positively correlated with the tip amplitude of PZT oscillator which is proportional to the AV amplitude. The controls are superior when AV frequencies are set to be near the frequency corresponding to the scale of the near-wall coherent structure containing the most energy. Reduction of integral spatial scale in the inner region of y + < 30 suggests that the PZT oscillator at work breaks up the near-wall stream-wise vortices responsible for high skin friction. Because of the high electrical impedance of PZT oscillator under AV driving, the power consumptions of different control conditions are all less than 0.1 watt measured by a power meter built-in the power supply. In this light, the drag reduction performances of our control strategies are exciting.
| 1 | |
| 2 | |
| 3 | |
| 4 | |
| 5 | |
| 6 | |
| 7 | |
| 8 | |
| 9 | |
| 10 | |
| 11 | |
| 12 | |
| 13 | |
| 14 | |
| 15 | |
| 16 | |
| 17 | |
| 18 | |
| 19 | |
| 20 | |
| 21 | |
| 22 | |
| 23 | |
| 24 | |
| 25 | |
| 26 | |
| 27 | |
| 28 | |
| 29 | |
| 30 | |
| 31 | |
| 32 | |
| 33 | |
| 34 | |
| 35 | |
| 36 | |
| 37 |