


Brief overview of electrochemical potential in lithium ion batteries
[Gao Jian 1, 2 , Shi Si-Qi 3, 2 , Li Hong 1, †,  ]
]
]
|
|


† Corresponding author. E-mail:
Project supported by the National Natural Science Foundation of China (Grant Nos. 51325206 and 51372228), National Basic Research Program of China (Grant No. 2012CB932900), Shanghai Pujiang Program, China (Grant No. 14PJ1403900).
The physical fundamentals and influences upon electrode materials’ open-circuit voltage (OCV) and the spatial distribution of electrochemical potential in the full cell are briefly reviewed. We hope to illustrate that a better understanding of these scientific problems can help to develop and design high voltage cathodes and interfaces with low Ohmic drop. OCV is one of the main indices to evaluate the performance of lithium ion batteries (LIBs), and the enhancement of OCV shows promise as a way to increase the energy density. Besides, the severe potential drop at the interfaces indicates high resistance there, which is one of the key factors limiting power density.
Lithium ion batteries (LIBs) celebrated their twenty-fifth birthday this year, and among the most promising electrochemical cells which are expected to replace the traditional fossil fuels in transportation, as well as energy storage for intermittent renewable energy such as solar or wind power, to satisfy urgent environmental demands. In addition, they have been widely applied in portable consumer electronic products. Although LIBs have achieved the dominant position in cell markets as compared with lead-acid and Ni-MH cells, they are still restrained by insufficient energy density and power density, and are in urgent need of further guarantees of safety. This review will concentrate on how the above problems can be considered and dealt with from the aspect of electrochemical potential.
The first requirement, energy density, can be realized by developing novel electrode materials. Anodes (modified carbons are widely adopted) generally have higher capacities than common cathodes. The next-generation anode materials, lithium metal or silicon-(active metal) alloys, even represent better hope for quite great enhancement in capacity. As a result, the bottleneck of energy density always lies in the commercial cathodes such as LiCoO 2 , LiFePO 4 and LiMn 2 O 4 . Given the equation E = Vq , where E is energy, V is voltage, and q is the electronic charge quantity, there are two methods to improve the energy density, of which one is to enrich the Li content (Li-rich cathodes), and the other is to increase the output voltage (high-voltage cathodes). The latter is focused on for its relationship to the electrochemical potential problems. With the given composition and structure, the output voltage of a compound can be theoretically identified, making it possible to design cathode materials through calculations. Then the maintenance of framework structure to assure the reversibility is the only problem left to be taken into consideration for the practical cathodes, which can be investigated by the lithium (de)intercalation phase diagram, influenced by both thermodynamic and kinetic factors. However, the output voltage, which is determined by anode and cathode, also needs to be within the electrochemical windows of electrolyte to suppress the decomposition and side reaction at the interfaces. As a result, new developments in electrolytes and electrolytic additives are also in urgent demand to realize compatibility with the novel cathodes.
The second requirement, power density, is not related so directly to the electrochemical potential. However, the high-rate charge and discharge usually bring about side reactions and subsequent aging and capacity-fade at the interfaces, which can be attributed to kinetic stability problems influenced by the sharp potential drop across the interphases, where a high proportion of a full cell system’s resistance lies. In addition, the potential variation at the interface modulates the lithium diffusion mechanism there.
The safety issue, which is regarded as the third requirement, promises to be solved by the replacement of electrolytic solutions by solid-state electrolytes. However, the high solid–solid interface resistance is often the predominant limitation of actual LIBs’ performance. By now, the space charge layer of solid–solid interphases, which comprises the complicated problems such as chemical potential, electric potential as well as electrochemical potential, still remains unclear. Further understanding of solid–solid space charge layer and the electrochemical potential variation therein can contribute to the application of solid-state electrolytes and thus improve safety.
The problems related to electrochemical potential in LIBs are reviewed, including the output voltage of electrodes, the spatial distribution of electrochemical potential in the full cell and its possible effects on the performance. The relevant factors affecting the output voltage are presented. Then applications such as high-voltage cathodes, anodes and electrodes based on conversion reactions are summarized. Moreover, the reasons for discrepancies between calculated results and experiments are discussed, involving thermodynamic and kinetic factors, as well as the single electron approximation of Kohn–Sham equation within the density functional theory (DFT) framework.
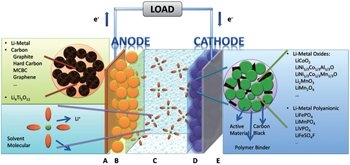
As shown in Fig.
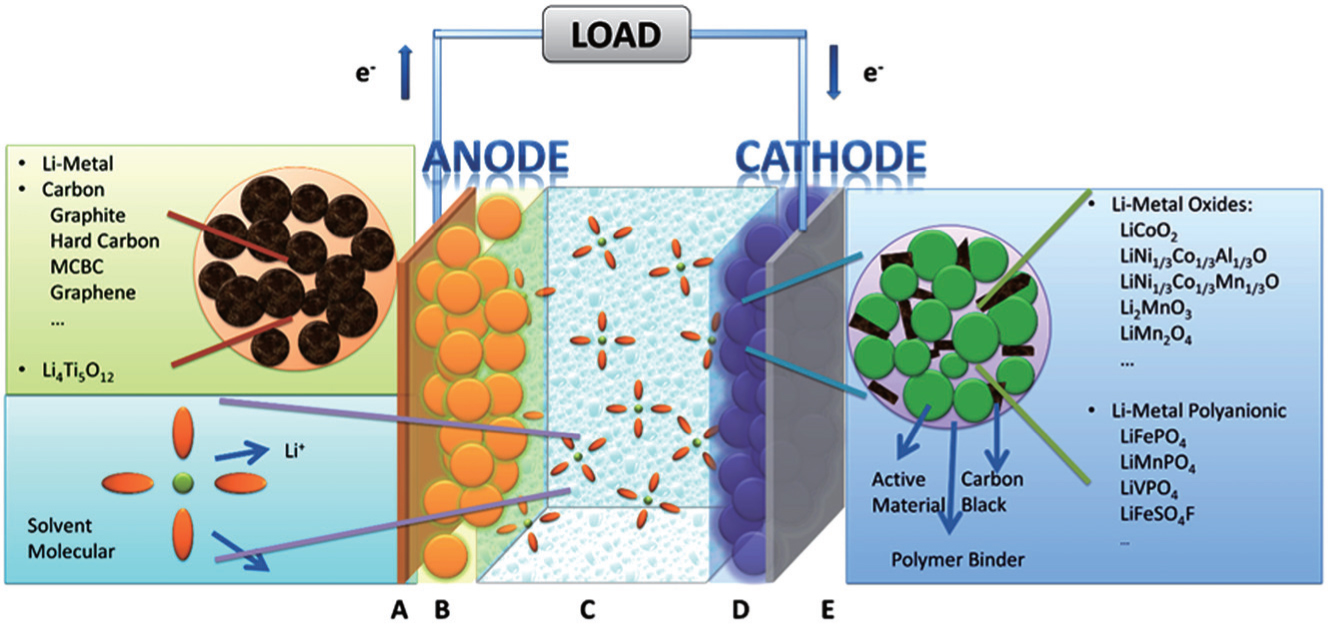 | Fig. 1. The hierarchical structure of lithium ion batteries. |
The most common sandwich structural cell contains cathode–electrolyte–anode. In the case of LIB with the organic electrolytic solution (including solvents and Li salts) as the electrolyte, the full sandwich cell is assembled by rolling, folding or stacking and placed within a hermetically sealed casing. Then the porous material lies naturally across the whole cell to guarantee the wettability of solid matrix of both electrodes and separator filled with electrolytic solution. Outside the porous sandwich is the current collector, usually Cu foil at the anode side and Al at the cathode side. The construction of each electrode begins with the active material powder of spherical or ellipsoid particles with diameters ranging from nanometers to micrometers. The powder is mixed with conductive additives and binders, and the completed mixture holds the liquid-filled pores throughout, referred to as “porous electrode”. For the porous electrode, the active material is at the core, which is chosen to drive the overall electrochemical reaction of the battery to produce the output electrical current, preserving structural stability during the Li + intercalation/deintercalation. In the case of polymer cells, only the electrolyte is replaced by solid/gel polymer by contrast.
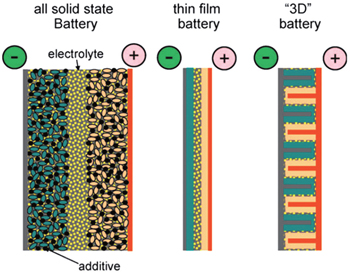
Inorganic all-solid-state batteries can also be fabricated into the sandwich structure, just similar to their counterparts with organic electrolytic solution, while the electrolytes of the former are made of inorganic ionic conductor ceramic pellets. Because there is no electrolytic solution to wet the electrodes, the active materials should be mixed with solid electrolytes together with conductive additives and binders instead. The alternative strategy to realize the all-solid-state battery is to adopt the thin film structure, where the cathode and electrolyte are deposited onto current collectors in sequence, and Li metal or Li alloys can be adhered as anode. Film all-solid-state batteries have advantages such as simple construction of structure, freedom from the binders and conductive additives, and the service life of as much as ten thousand cycles. [ 1 ] Besides the sandwich-structure and thin film batteries, three dimensional (3D) integrated all-solid-state batteries exist as promising candidates with higher energy density, for the significantly increased surface area. [ 2 ] Figure
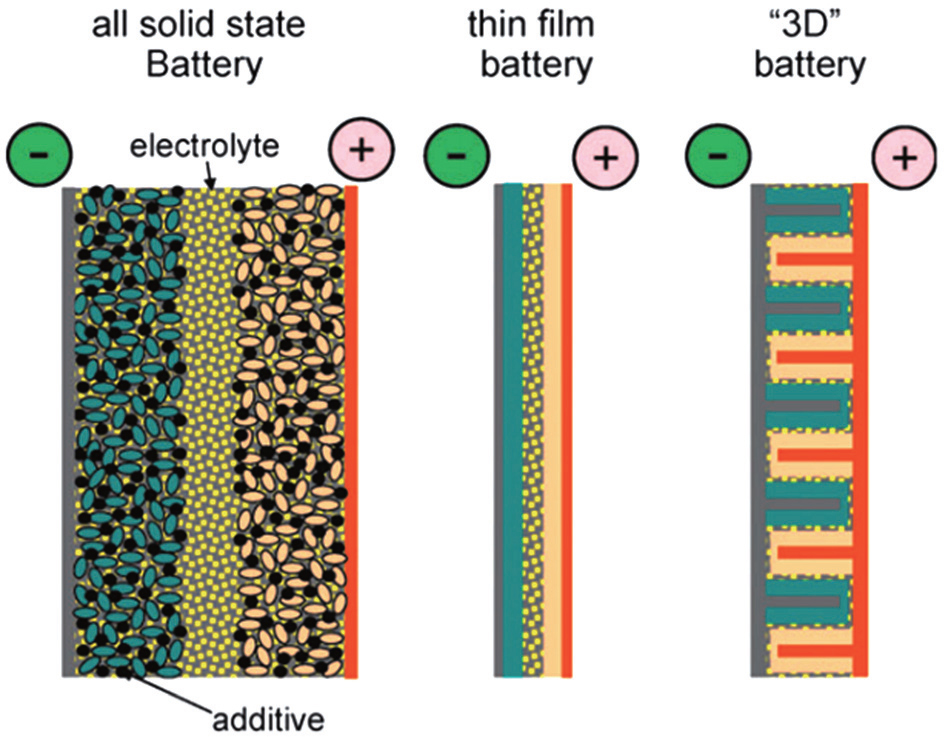 | Fig. 2. A schematic representation of different battery configurations using solid electrolytes. Current collectors are depicted in grey (positive) and brown (negative), and active materials in pink and green, respectively. [ 3 ] |
The principal operating mechanism of batteries is shown in Fig.
Only under the equilibrium state condition can the system be thermodynamically reversible, thus one thermodynamic parameter should be introduced if the thermodynamic aspects of electrochemical systems are of interest. When batteries doing electric work outside, electrons are powered by the potential difference, and the directional aspect should be assigned to this parameter to describe the reaction other than the physical system. This parameter can be fixed as electromotive force (EMF).
The reversibility can be reached by applying an infinite load resistance, then the potential difference between the ends of the battery’s cathode and anode is defined as open circuit voltage (OCV). The infinite load resistance assures finite current. Providing the zero current, the electrochemical system can be ensured of reversibility, then this potential difference is equal to EMF, with the positive or negative value indicating the actual reaction direction. OCV is an observable parameter used more commonly than EMF in LIB investigations. However, every process in practice occurs at finite rates with finite current (nonzero), so the internal resistance cannot be neglected. As a result, this so-called “OCV”, which is usually misused in experiments by ignoring the sufficient load resistance, is not exact and actually lower in value than theoretical OCV, or to say, EMF. The OCV is bound up with SOC, and usually decreases accompanied by the discharge process.
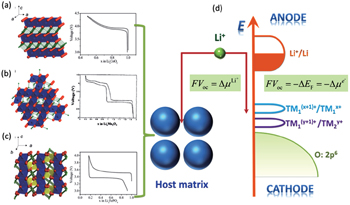
Theoretically, given the basic assumption of electrical neutrality in the electrode particles, which is guaranteed by the small sizes of particles and dispersed connective conductive additives, we can calculate the OCV/EMF (in the following sections, only the term OCV is used habitually) from the perspectives of both Fermi energy level and Gibbs free energy respectively, arriving at the same conclusion, as shown in Fig.
 | Fig. 3. Crystalline structures and voltage–composition curves of (a) layered-LiCoO 2 ; (b) spinel–LiMn 2 O 4 ; (c) olivine–LiFePO 4 . [ 4 ] (d) Open circuit voltage: from the aspect of Fermi energy level or electrochemical potential of Li (adapted from Ref. [ 5 ]). |
Fermi energy level refers to the energy when the electron occupation probability equals 0.5 in the electronic energy level (Fermi–Dirac distribution). As the distribution is similar to a step function, it can be approximately considered that electrons mainly fill the energy levels below Fermi energy level at the finite temperature, while levels above are unoccupied. Then the levels in the vicinity occupied by the probability ranging from 0 to 1 are called “transition state”. The lithium ion batteries referred to as “rocking chair” batteries, electrolytes play only the role of transporting lithium ions and are not involved in the electrochemical reaction. Ideally, during the discharge process, only the electrodes are taking part in the redox reaction, enabling electrons to flow through the external circuit in the direction from anodes with higher Fermi energy to cathode material with a lower one. Therefore, the open-circuit voltage of the cell system satisfies

At the cathodes, the charge–discharge’s reversibility is realized by applying the transition metals to the Li-(de)intercalating materials, which enables itself to be stable within a wide range of Li concentration. The electronic configuration of the transition metal ion in cathode is 3 d 4 s , therefore the losing or gaining of electrons in d -electron manifold corresponds to the oxidation and reduction of transition metal. Electrons in 3 d -electron manifold display the localization character and have a narrow energy band due to the strong charge density Coulomb interaction. When the d -energy band is close to the p -energy band, covalent electrons mix with each other, which delocalizes electrons and broadens the band structure, causing the Fermi energy level to move into the conduction band. When electrons from an anode with higher Fermi energy level fill into a cathode with lower Fermi energy level, only the electrons near the Fermi energy level change state rather than filled or empty additional band. The electrons’ transfer at only the Fermi energy level will not lead to an obvious changing in the OCV voltage profile as the SOC evolves. In fact, the obvious change of voltage profile to the “S” type is based on alteration of the configuration of the crystal lattice, accompanied by a consequent shift of electronic structure. For materials with electron localization, the Fermi energy level lies between the valence and conduction bands. Taking the discharge process of the battery with Li anode and LiFePO 4 cathode as an example, while electrons are flowing out of the anode to fill the cathode, they occupy the additional empty band (Fe 3+ ) which was originally the valence band, because the conduction band is filled in Fe 2+ . From the perspective of real space, electrons are localized to the single Fe 3+ , contributing to the formation of Fe 2+ , and attracting the neighboring unstable Li + to form LiFePO 4 . Note that the electrons hop in (Li)FePO 4 as “small polarons”, arising from the fine tuning of the surrounding crystal lattices. The propulsion of phase interface is driven by the stress field, which brings out the so-called two-phase reaction, exhibiting an “L” type voltage profile and a stable OCV during this discharge process. Since LiFePO 4 and FePO 4 hold a certain degree of reduced miscibility gaps arising from the dynamics factors, a limited solid solution occurs, and thus appears the delocalization of electrons to some extent. As shown in experimental results, both side knees of the “L” type voltage profile will end up with a limited range of “S” type curve. Next the physics meanings of different types of voltage profiles is demonstrated in detail from the aspect of Gibbs free energy.
At the anodes, the various analysis methods should be taken to match the specific reaction mechanisms during the charge/discharge process, such as alloying reaction (e.g., Li, C, Si, and so on, summarized in Ref. [ 6 ]), (de)lithiation reaction (Li 4 Ti 5 O 12 ), [ 7 ] conversion reaction (defined as that there exists at least two products). [ 8 , 9 ] (i) Li anode: The Li metal anode contains a large number of itinerant electrons near the Fermi surface, and will not experience a phase transition during the charge/discharge process; thus the Fermi energy level keeps unchanged unless considering the morphology factors. (ii) Li binary alloy anode: The binary system usually experiences a series of phase transitions when Li is in the alloy, indicating the discontinuous changes of Fermi energy level. The phase diagrams and voltage profiles of Li–C and Li–Si are illustrated in Refs. [ 10 ]–[ 12 ] respectively as examples. The most common carbon-based graphite anode with high electrical conductivity keeps structural stability during staged phase transition cycles. However, the silicon-based anode usually endures the high volume expansion, resulting in great changes in morphology and the totally different actual voltage profile from the theoretical data. [ 12 ] (iii) The (de)lithiation-based anode: Its reaction mechanism is quite similar to that of cathodes mentioned above, and Li 4 Ti 5 O 12 will be illustrated from aspect of Gibbs free energy in the next section. (iv) Conversion reaction-based anode: In addition to complicated multi-electron transfer, great changes of morphology contribute to the modulation of voltage profile, called the kinetic hysteresis effect.
To maintain the electrical neutrality, the injections and ejections of electrons and ions from electrodes must appear simultaneously, with the differences of Fermi energy levels and chemical potentials respectively as the driving forces, and the latter can be deduced from relative Gibbs free energies of reactants and products. So the relationship between Fermi energy level and Gibbs free energy is as follows: At the isothermal–isobaric process in the cells, the maximum electrical work generated by the electrode reaction is equal to non-volume work generated by the change of the reaction system, namely the change of molar free energy ( Δ r G ).
The theoretical electric potential is defined by OCV as V OC , and the work done by the cell system to surrounding environment is nFV OC ; thus the change of the Gibbs free energy can be defined as the negative value of the output work in thermodynamics, therefore,

In order to quantitatively study the dependence of Gibbs free energy and the resulting Li chemical potential on the Li + concentration, we first suppose a simple mechanical mixture of two pure components, where the Gibbs free energy of the mixture reads G M = X A G A + X B G B . According to Gibbs’ phase rule, in a system where two phases coexist, with fixed temperature and pressure, the system has no degrees of freedom, which leads to a constant chemical potential and the linear Gibbs free energy G M , as shown by the green line in Figs.
 | Fig. 4. Free-energy-composition diagrams for (a) ideal solution, (b) and (c) regular solutions, and (d) incomplete solid solution. |
When the solid solution reaction occurs in the electrodes, it will exhibit a smoothly sloping voltage curve as shown in Fig.

When, however, Li insertion is accompanied by a first-order phase transformation from a Li-poor phase α to a Li-rich phase β , there are two local minima (assuming the host maintains the same crystal structure), as shown in Fig.
 | Fig. 5. Voltage curves are linearly related to the slope of the free energy of the electrode material. If the electrode host material forms a solid solution with Li as panel (a), it will exhibit a smooth sloping voltage curve as illustrated in panel (b). If, however, Li insertion is accompanied by a first-order phase transformation from a Li poor phase, α , to Li rich phase, β , it will have a free energy curve as illustrated in panel (c), and resulting in a plateau in the voltage curve as illustrated in panel (d). Steps in the voltage profile appear if an intermediate phase is stable as in panels (e) and (f). [ 14 ] |
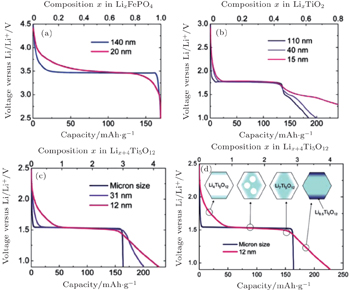
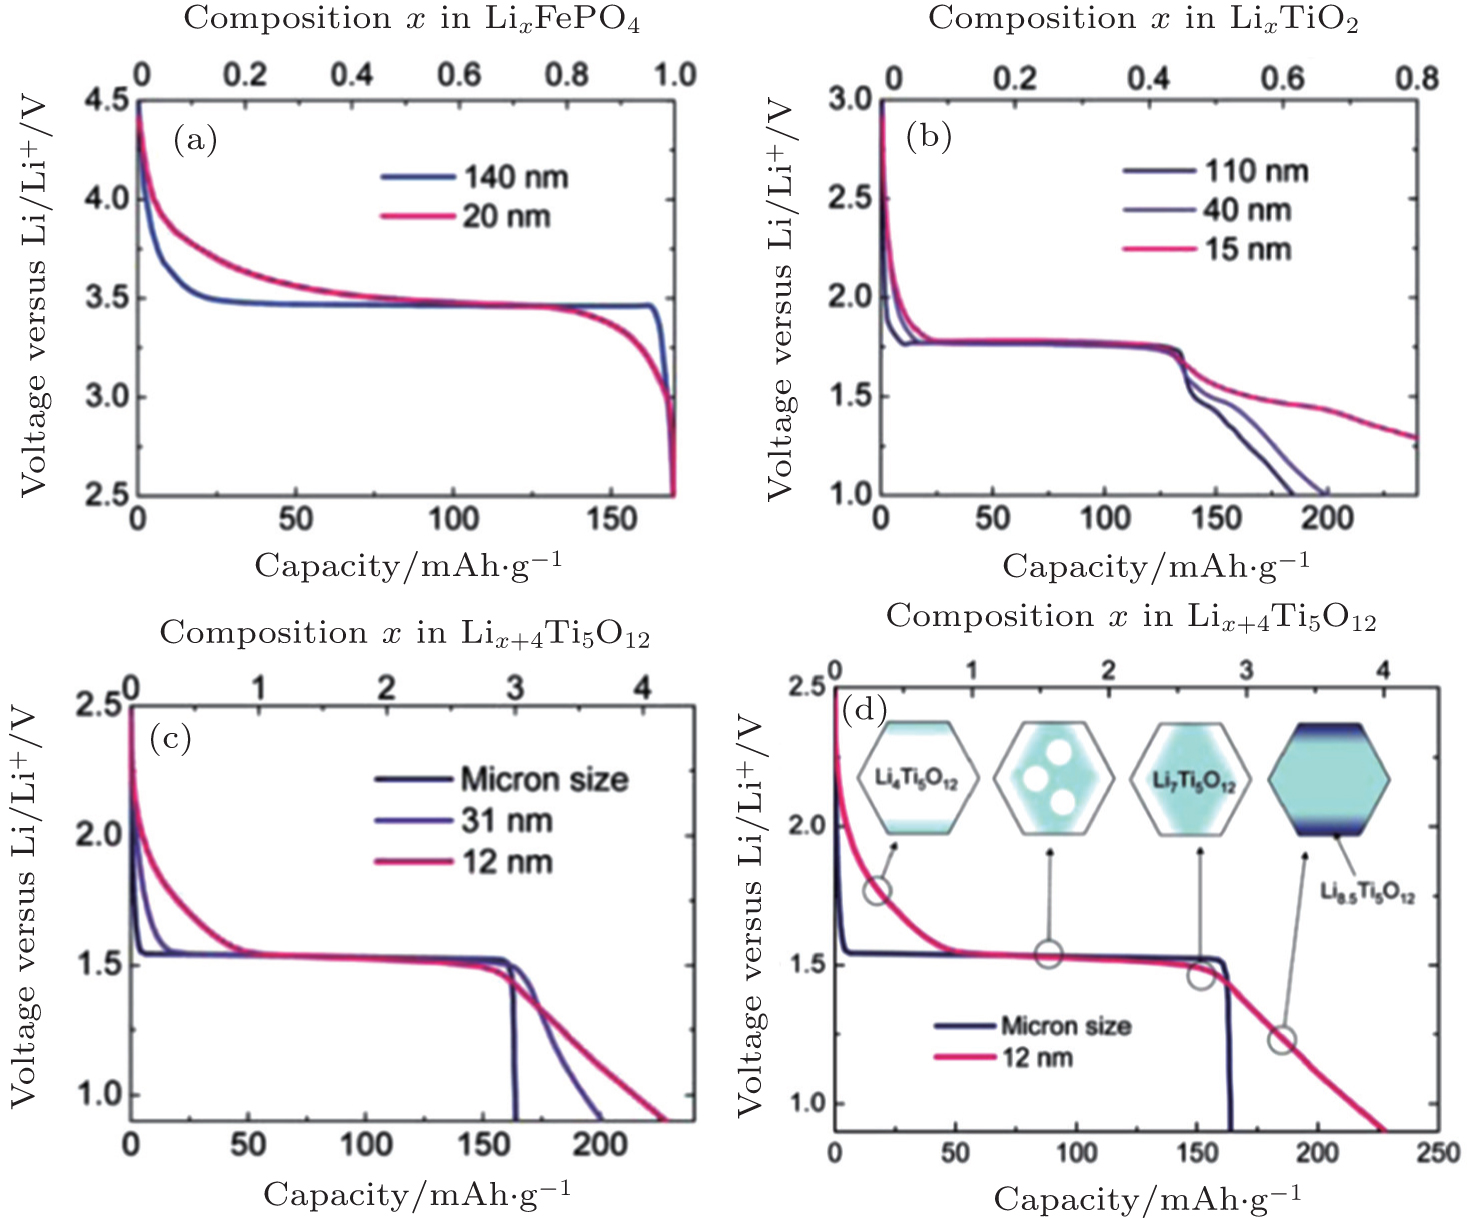 | Fig. 6. Voltage profiles of different particle sizes for Li x FePO 4 (a), anatase Li x TiO 2 (b), and spinel Li x +4 Ti 5 O 12 ((c) and (d)). [ 7 ] |
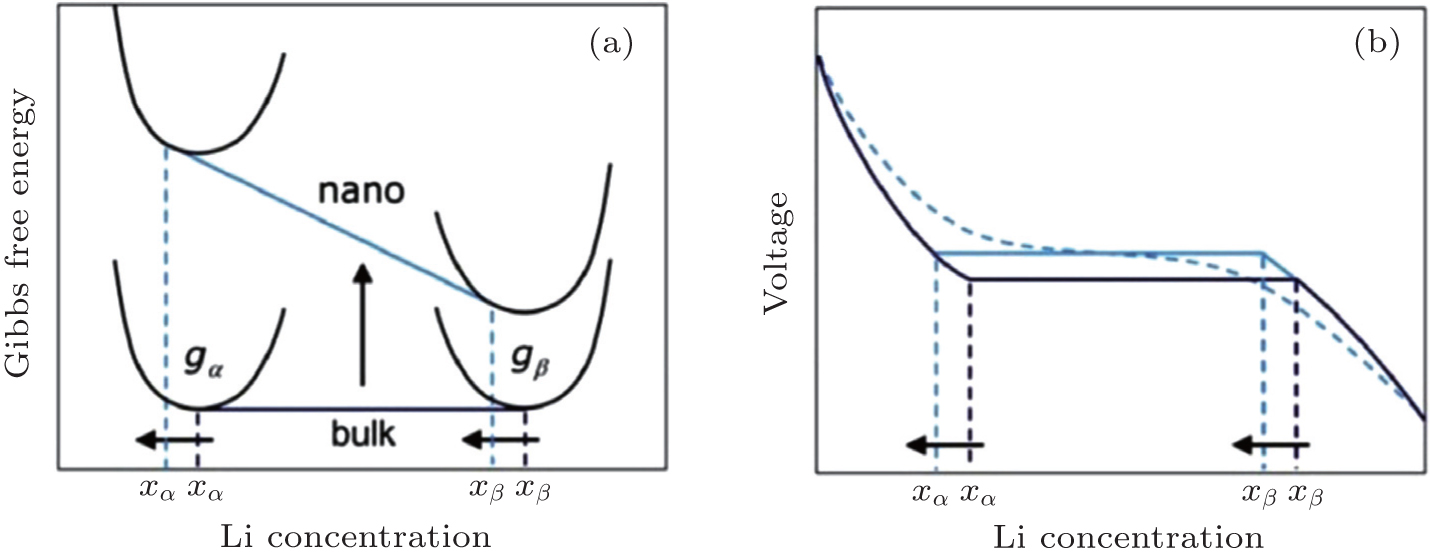 | Fig. 7. Schematic of the impact of the surface energy on the Gibbs free energy (a) and voltage (b) profile of an insertion material exhibiting a first-order phase transition upon (de)lithiation. A difference in surface energy leads to a different free energy that scales with the particle surface area. The consequences are a change in the chemical potential and hence in voltage plateau and a shift in the solubility limits. A distribution in particle sizes leads to a distribution of voltages as shown by the dotted voltage profile. [ 7 ] |
When an intermediate phase is stable with lower Gibbs free energy, as shown in Figs.
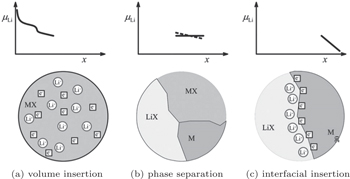
In LIBs, certain ranges of the voltage profile (especially for the low voltage sides) often appear as capacitor behavior. Significantly different from typical voltage profiles for the insertion reaction in Fig.
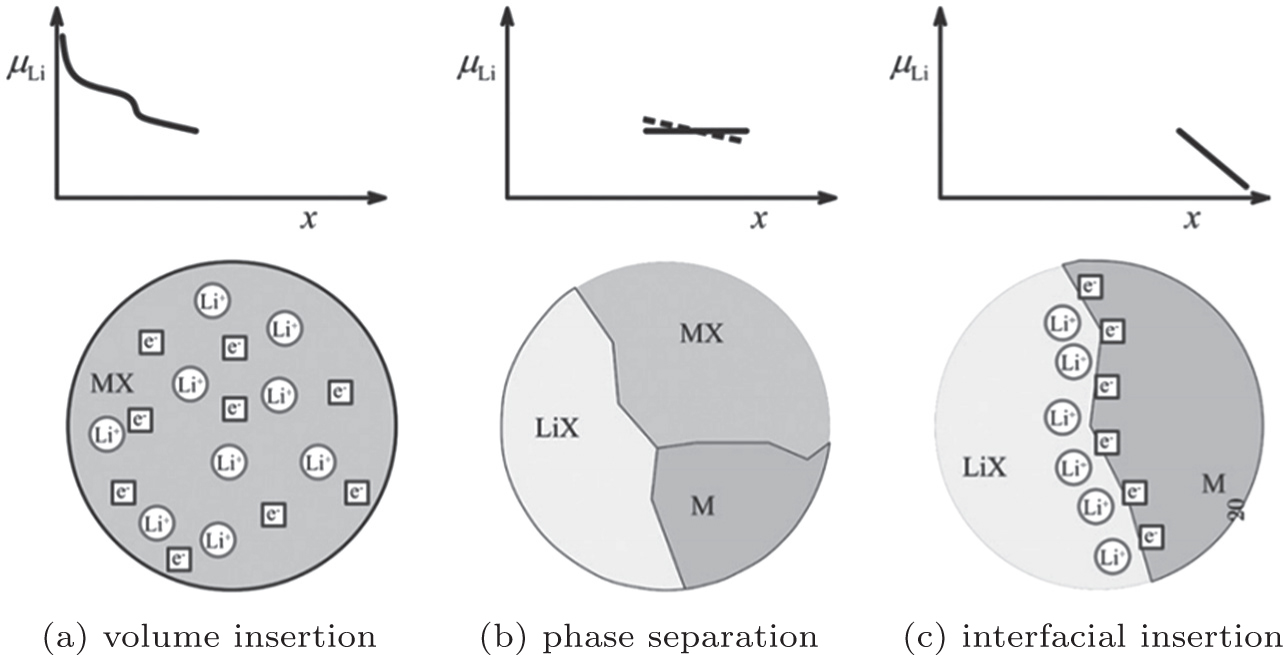 | Fig. 8. Sequence of three different stages of Li storage. Insertion in the bulk of MX (a). If the solubility limit is exceeded, a heterogeneous solid-state reaction characterized by phase separation occurs (b). Finally, the interfacial charging takes place (c). [ 23 ] |
In order to improve the performance of LIBs, it is necessary to balance the various processes and interactions occurring in electrodes and electrolytes. The temporal–spatial dependent potential in cells is determined together by the Li ions transport in electrodes and electrolytes respectively, as well as by the complicated coupled electrochemical reactions at the interfaces between the electrode and electrolyte. Thermodynamics determines the maximum of power, while the mutual effect of dynamics and mass transfer deviate the system from the ideal thermodynamic equilibrium, influencing the performance and cell lifetime. Since multiple transport phenomena are all based on the charges and masses flow, the operating mechanism can be understood from the aspects of electric potential, chemical potential and electrochemical potential. In this way, the limiting factors and their effects on the cell performance can be found to help design batteries with higher capacity, higher power, and longer cycle life.
In the batteries, the flows of multiple species and positive/negative charges are often coupled together according to the Onsager relation, and the mass-charge coupled transport is driven by the concentration related chemical potential (neutral atoms, atomic groups, or vacancies etc.) and electronic potential (electrons or holes). When the electron distribution is considered in the atomic scale, electrons can depart from neutral atoms, for example, the electrons (e) and lithium ions (Li + ) can be thought about separately for lithium atoms, then atomic groups or vacancies are left behind (the other charged parts), and they will all re-distribute in the electric field. Then the electric potential describes the gradient distribution of all nonneutral particles, including electrons/holes, nonneutral ions/ionic groups and nonneutral vacancies). In addition, the flow of nonneutral ions, ionic groups or nonneutral vacancies driven by both chemical and electric potential simultaneously, that is, they are actually driven by the electrochemical potential.
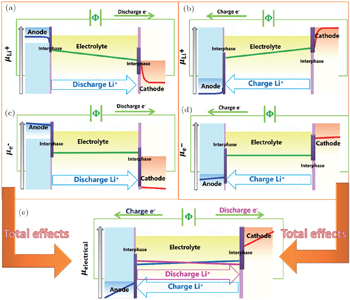
The operating mechanism in batteries is influenced by coupled electrical and chemical factors, and the whole circuit is powered by the cooperative motion of Li ions and electrons: in the external circuit, the charge transfer is driven by electric potential and mediated through electrons, while in the internal circuit driven by chemical potential through Li ions. However, the charge and mass transfer across the interfaces between electrode and electrolyte is usually of greatest importance in the cells, which is elaborated in the other issue of this series. Simplifying the complicated interphases as the step potential drop because of the existence of space charge layer, the distribution of Li + chemical potential as well as electronic potential are shown in Fig.
 | Fig. 9. The distribution of lithium chemical potential and electric potential for the whole circuit. (a) The distribution of Li + chemical potential during the discharge process; (b) the distribution of Li + chemical potential during the charge process, the contribution of which is opposite to the actual electric potential for the negative charge it has; (c) the distribution of electronic (e − ) potential during the discharge process; (d) the distribution of electronic potential during the charge process; (e) the total electric potential distribution of both e − and Li + simultaneously. |
Figures
Figures
The total effect resulting from hysteresis is shown in Fig.
As discussed above, when the current flows through the circuit, the internal resistance in the battery will cause an Ohmic drop, which results in energy loss, also called Ohmic loss. Many factors contribute to the Ohmic drop, including imperfect contact between electrode slurry and metal current collector, welding spot between current collector and external circuit, potential drop on porous electrode with the certain thickness and accordingly the certain resistance, potential drop on the electrolytes (especially for solid electrolytes), and so on. Besides, side reactions often enhance the internal resistance of cell, such as the formation of solid electrolyte interphase (SEI), which is also ascribed to aging.
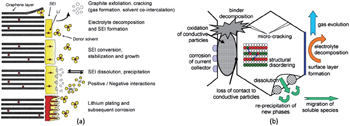
Another topic with regard to potential is the “overpotential” phenomenon, which is caused by the kinetics of the charge and mass transfer with the response frequencies of 1 kHz and 10 Hz, respectively. [ 27 ] The Butler–Volmer model has been widely accepted recently to interpret overpotential. [ 28 ] Besides, other complicated side reactions near or of the electrodes, as shown in Fig.
 | Fig. 10. (a) Changes at the anode/electrolyte interface; (b) overview of basic ageing mechanisms of cathode materials. [ 29 ] |
In the following subsections, the factors with less influence on potential distribution, such as separator and current collector, are not focused on. Only the electrode, electrolyte and their interfaces are involved.
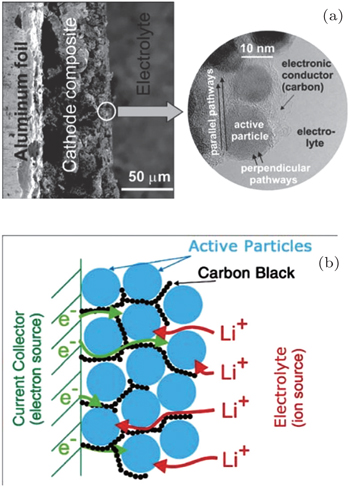
Porous electrodes are often designed to be applied to LIBs, and usually contain active materials with sizes ranging from micrometers to nanometers and the conductive additives for lowering the resistance, which are mixed and then spliced by binders as a unit, and electrolyte with high ionic conductivity filled into the particles’ skeleton to promote ion diffusion, resulting in a so-called porous electrode shown in Fig.
 | Fig. 11. Typical Li ion battery porous electrode. (a) Low magnification (on left) and high magnification (inset on the right). (b) Schematics showing the main phases constituting a modern insertion cathode and its role in transport. The polymeric binder is not shown (its effect on the transport is thought to be marginal). [ 31 ] |
Fine single active particles with size of nanometers to micrometers and the continuous conductive additive ensure high electronic conductivity, so that the active particle surfaces can be seen as an electronic equipotential body. Therefore, the ion transport inside the particle is driven only by the Li concentration gradient (i.e., chemical potential). With high ionic conductivity, the electrolyte can be treated as the equipotential surface of Li + chemical potential, despite the complicated interfaces’ space charge layer. Then the Li ion diffusion rate within the active particle becomes the limiting factor of the total diffusion time.
The advantages of small sizes for the active particles are as follows: (i) The diffusion path and grain boundary resistance of every single particle are both reduced to lower the Ohmic drop on the electrode; (ii) In the case of the Li ion transport in the solid host, assuming the diffusion time τ , the diffusion length L , and the diffusion coefficient D , the relationship among them is: τ = L 2 /2 D , which indicates that a shorter diffusion path can reduce the diffusion time of Li + and improve the kinetics performance; (iii) As for a fixed total volume of battery pole piece, the smaller size of single particles means a larger reaction area, which can reduce the operating current density per unit area and improve the cathode/anode reaction rate with the given rated current, so as to ameliorate the charge transfer polarization; (iv) Reducing the particle sizes into the order of magnitude of nanometers is a common method to increase the solid solution limit, while simultaneously introducing more defects such as vacancies or interstitials to improve the intrinsic Li ion mobility in the materials. However, nanocrystallization causes some problems, for example: (i) High porosity leads to a suppression of the compact density thus the energy density; (ii) Surface effects predominate over the intrinsic bulk features, which turns the interface resistance into the main limiting factor of the rate performance; (iii) The side effects near the surface increase; (iv) A contact problem appears between the active particles and the conductive additives. Moreover, when the particles size decreases to the order of magnitude of nanometer, other unknown effects may occur, for example: Will the reconstruction of the surface crystal and electronic structures due to the nanocrystallization have the influence the cell performance? Will the nanoscale interface bring about the pseudocapacitive effect or not? What is the formation mechanism of coexistence and segregation of nanoscale phase, or of heterogeneous interface and space charge layer? These are all problems left to be solved.
Given that the size effects are usually accompanied by the interface effects, the problem of the charge and mass transfer across the active particles and electrolytes will be discussed in Section 4.4.
Table

| Table 1. Relationship between the diffusion coefficient and the particle size. . |
It can be obtained: 10 2 s (1.7 min)∼36 C; 10 4 s (2.7 h) ∼ 0.36 C. The rate performance between these two points can satisfy the demands of most energy storage devices, so the relationship between the diffusion coefficient and particle size is of importance, as shown in the red and blue square frame. For example, for a particle with a size of about 10 μm, with the requirement for the charge and discharge rate as 1 C, the diffusion coefficient must reach as high as 3 × 10 −9 cm 2 /s.
High power density requires fast lithium ion transport. It can be seen from the porous electrode model that lithium ion diffusion path is very short within the electrode particles, resulting in generally small resistance of the battery pole pieces. Therefore, for the traditional battery structure, the potential drop usually lies in the electrolyte section. The high charge and discharge rate usually leads to the energy loss occurring in multiple regions of the cell, among which the significant energy loss and heat generation are usually located on electrolyte.
Electrolyte is the electronic insulator for LIBs, thus only the transport of ions and ionic groups is driven by electrochemical potential. Apart from the interfacial region concerning the space charge layer, it can be considered that the large proportion of the region maintains local charge neutrality. Supposing the thermodynamic equilibrium conditions, the spatial distribution of the lithium concentration is uniform, leading to the equivalent chemical potential everywhere. As a result, the electrochemical potential is equal to the electric potential within the electrolyte. The overall potential drop between the two ends can be simply considered as the Ohmic drop. In comparison with the fluid and mobile electrolytic solution without a boundary, in the case of solid electrolyte with the stable configuration, the strong restrictions of lattices or skeletons may lead to long-range interaction, which can hardly be explained by the general space charge layer model in liquid solution without the specific crystal structure and interacting forces from skeletons. In addition, the Li ion mobility of the solid electrolyte is 1 and electronic conductivity is extremely low. Therefore, a natural question is that as compared with the solvation of Li ions in the electrolytic solution, how can the solid electrolyte maintain the electroneutrality under lattice restriction conditions? To the best of our knowledge, there is little literature presenting investigations of the mass-charge transport model specialized for the crystalline solid electrolytes, which may depart from the ideal crystal structure with defects and charges.
Providing the two assumptions, i.e., electroneutrality and continuously changing potential, on which the whole discussion is based, a lot of important thermodynamics and kinetics features are focused on the surfaces and interfaces. For example, when overpotential exists, the partial energy dissipates in the form of heat during the charge/discharge process, and the extent of overpotential is related to the charge/discharge rate. The challenging problems about the interfaces that remain to be solved include: (i) the non-linear phenomena resulting from ultrafast charge/discharge, (ii) the space charge layers with distinct characteristics under various conditions, (iii) the pseudo-capacitance effect, (iv) the spatial and temporal scales of the studied objects, (v) the complex side effects and aging mechanism near the interfaces, including the growth of SEI layers, the decomposition of electrolytes, the formation of Li dendrites, the precipitation of transition metals, the existence of the separated interphase between the solid electrolyte and electrode, and so on.
There has been lots of research on the space charge layer in the electrolytic solution. Owing to the difficulties lying in experiments, the establishment of theoretical models and reasonable simulations becomes markedly important. To balance the requirements of accuracy and practicability, the Gouy–Chapman–Stern model is most widely accepted and adopted so far. Based on the space charge layer model and considering the finite rate, the Butler–Volmer model can be used to explain the kinetics factors such as the overpotential, the transfer of species and charge, the irreversible side effects, and so on, which are caused by the difference between the oxidation and reduction rates under the nonequilibrium condition. In addition, the Poisson–Nernst–Planck equation (including modified forms of the PNP equation, [ 32 , 33 ] ) the classical continuous ion transport model, can be applied to simulate the linear/nonlinear response with the temporal–spatial parameters, to obtain the spatial distribution of the electric potential, charge density and the salt concentration in the electrolytic solution. [ 34 – 36 ] The macroscopic continuous model on electric-chemical potential of the solid–liquid interface has been widely studied, including the model based on equilibrium thermodynamics, [ 37 ] non-equilibrium thermodynamics, [ 38 ] thermal fluctuations, [ 39 ] and so on. For the interface between the specific active particle and solvent, both of which have distinct surface structures and chemical properties, the specific theory and simulation at the smaller atoms/molecules scales should be applied to describe the interaction potential among atoms and the electronic structure. For the more complicated phenomena occurring in the practical applications, including the porous electrode geometry, the small-size effect at the nanometer scale, the wettability of electrolytic solution and the influence of the interfacial strong field effect, more accurate models concerning the quantum and atomistic scales are in demand, followed by the difficulty in balancing the calculation cost and accuracy. Note that unlike the periodic structure of crystalline, the disordered interphases need to be simulated by covering larger structurally spatial scales, while electrode kinetics needs to be simulated by covering wider temporal scales. In addition, in order to predict the materials properties and then realize rational materials design, linking up the simulations at different scales is still a long-term challenge, as well as verifying the theoretical results with relevant experiments.
In the case of electrolytic solution, the investigation of interface is usually based on at least one of two assumptions: [ 37 – 39 ] dilute solution hypothesis and local electroneutrality hypothesis. However, the case is different for the solid electrolyte: (i) The dilute solution model does not work for the strong interaction among mobile carriers and between mobile carriers and lattices; (ii) Thermal fluctuation cannot be ignored for the lattice effects; (iii) Given that the chemical potential is almost equivalent all through the inner bulk of the solid electrolytes (which is equal to the charge/discharge current multiplied by the resistance), the chemical potential difference between anode and cathode (which is the so-called OCV when the current approaches 0) drops mainly on the interfaces and causes a sharp concentration change. In this way, the Debye screening length, which is the spatial scale of the space charge layer treated within the classical Debye–Hückel theory, is hard to estimate for the solid materials with the strong interaction and intrinsic lattice stability; (iv) It is a challenge to establish the evolution model of the solid–solid space charge layer, and even the interphases, because of the lack of reliable experimental data and phenomena for establishing the reasonable models. Therefore, the need is most urgent to develop novel characterization techniques combined with multi-scale theoretical models and simulation methods.
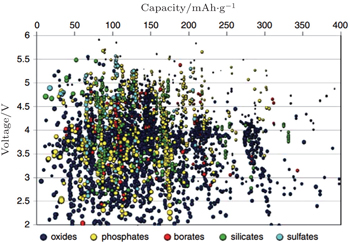
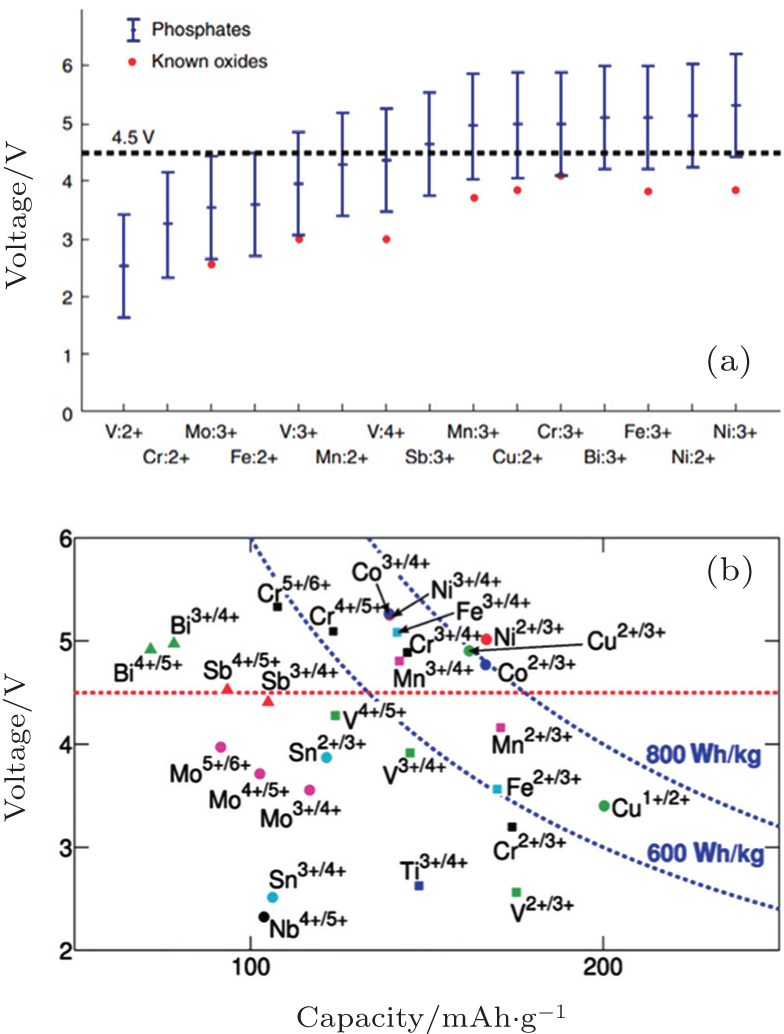
Based on the theoretical derivation above, the OCV of the electrode material can be obtained from the thermodynamics calculation. One available method is to solve the many-body Schrödinger equation with the approximation of density functional theory (DFT) using the electron density as the functional of the ground state energy, aiming at “the energy required to bring all constituent electrons and nuclei together from infinite distance.” [ 4 ] Combined with the Nernst equation, the reaction energy with Li can be obtained. The DFT calculations are scalable when compared with experiments, and can realize the fast “mapping” of the certain properties of a series of compositions in the phase diagram. The finiteness of Inorganic Crystal Structure Database and Powder Diffraction Database enables enumerative investigations. When making use of the “elemental substitution” or “machine learning” method, [ 41 , 42 ] novel materials and compositions outside the original databases can be built up and studied. So far, applying the high-throughput calculation to screen the high-performance Li ion battery materials has been an important part of the Materials Genome Initiative (MGI). The Li + intercalation potential is one of the most easily calculated properties, and Fig.
 | Fig. 12. Calculated lithium insertion voltage versus theoretical capacity for several thousand compounds. These compounds have to be further screened on other properties such as Li mobility, electron mobility, stability, and safety before they can be considered reasonable candidates for new battery materials. [ 40 ] |
One of the most important missions for the high-throughput calculation is effective data mining to get the relationship between the crystal structure, composite elements and Li + intercalation potential, which is one of the most important scientific bases for screening the possible electrode materials. As shown in Fig.
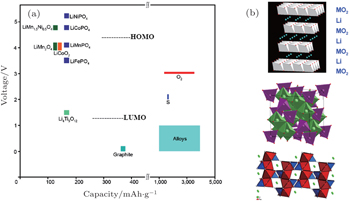
 | Fig. 13. Voltage versus capacity of insertion-compound electrodes (a), and of lithium-alloy anodes and sulfur or oxygen cathodes (b) for a lithium-ion battery. The LUMO and HOMO are for organic liquid-carbonate electrolytes. Oxide structures (top to bottom) are layered LiMO 2 , spinel Li[M 2 ]O 4 , and olivine LiMPO 4 . [ 43 ] |
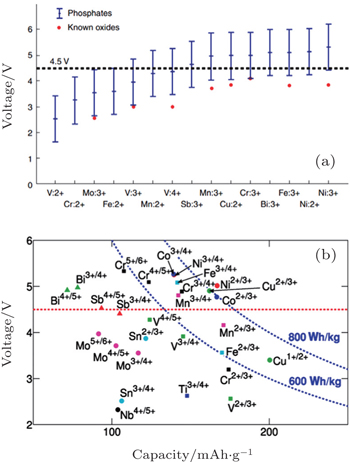
I view of the Fermi energy level explanation of OCV, during the Li + (de)intercalation, the accompanying electron transfer often occurs in 3d atomic orbits of transition metals. As a result, transition metals have an important effect on theoretical Li + intercalation potential. Early investigations indicate that for the layered structure, the materials on the right side of periodic table of elements provide a wider energy gap and higher intercalation potential, [ 55 ] Al substituted for Co can enhance the intercalation potential. [ 56 , 57 ] Early DFT studies based on the single electron approximation without the correction of additional interactions led to a narrower energy gap, which is not quantitatively accurate. However, the qualitative trend of the relationship between intercalation potential and transition metal is offered. Thanks to the correction of calculation methods (including + U and HSE, to will be discussed below), the accuracy of calculated intercalation potential is greatly improved. In addition, a tremendous amount of information can be derived from the high-throughput calculation, and even from the accessional new data produced by systematic replacement of elements mapped in the periodic table. As an example, figure
 | Fig. 14. (a) About 450 phosphate compounds, from those in Fig. |
For LiMn 2 O 4 with the spinel structure, Mn 3+ :Mn 4+ = 1 : 1. The electron configuration of 
| Table 3. Electrochemical data for spinel cathode materials. [ 50 ] . |
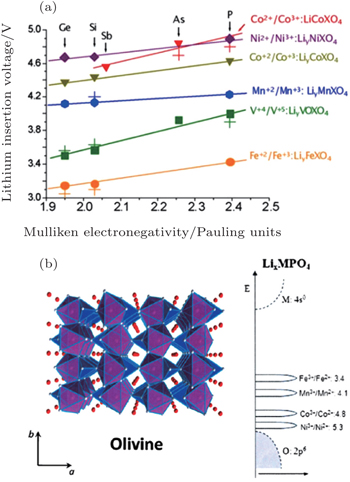
For the electrodes, (poly)anions can modulate the redox potentials for transition metals, which has been investigated in NASICON [ 67 ] andolivine systems (shown in Fig.
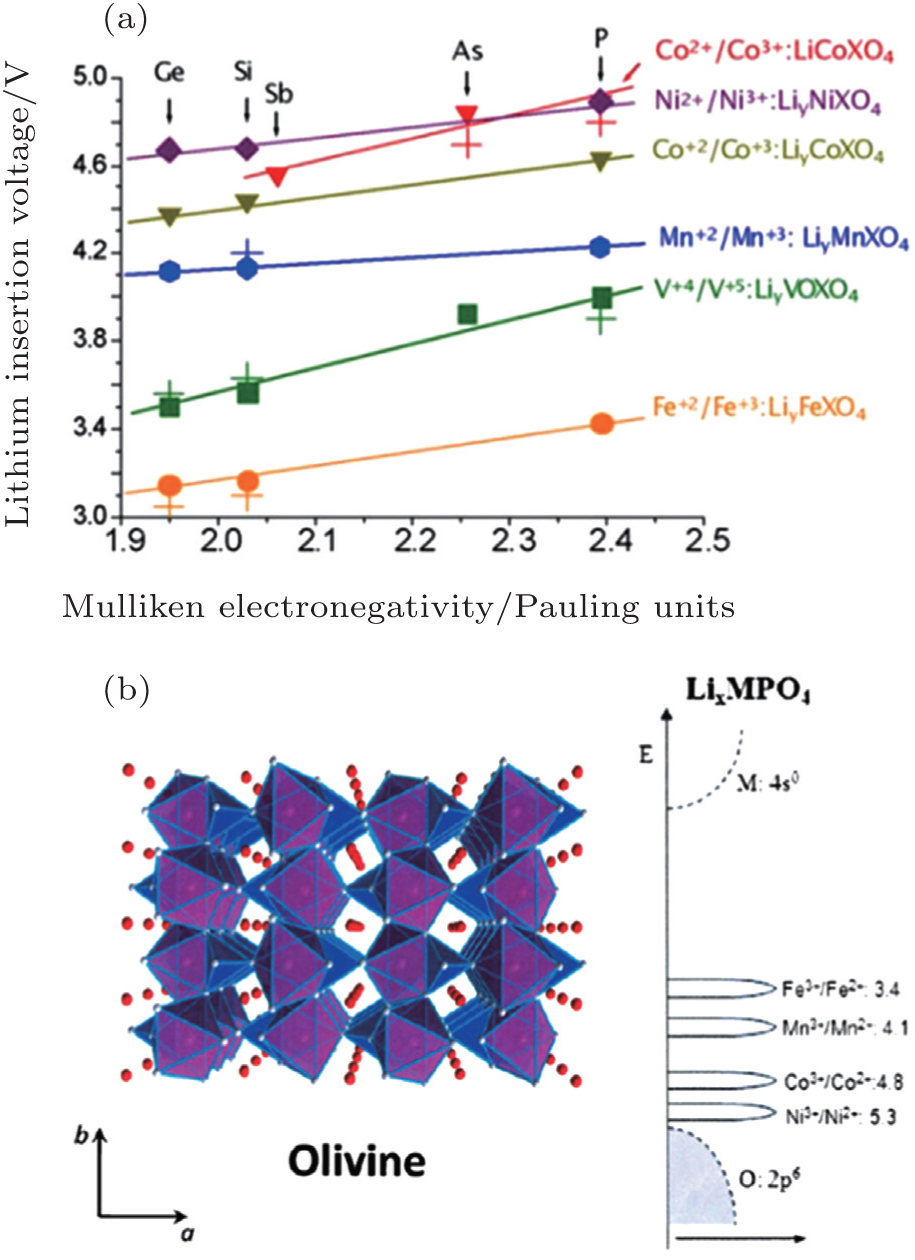 | Fig. 15. (a) Calculated and experimental (crosses) lithium insertion voltage for olivine polyoxianionic compounds versus the X Mulliken electronegativity. The lines show the fit to respective linear functions; [ 66 ] (b) the structure of the ordered olivine. [ 46 ] |
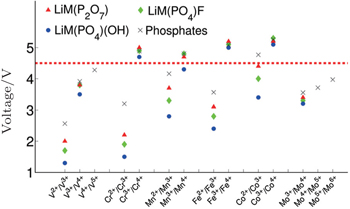
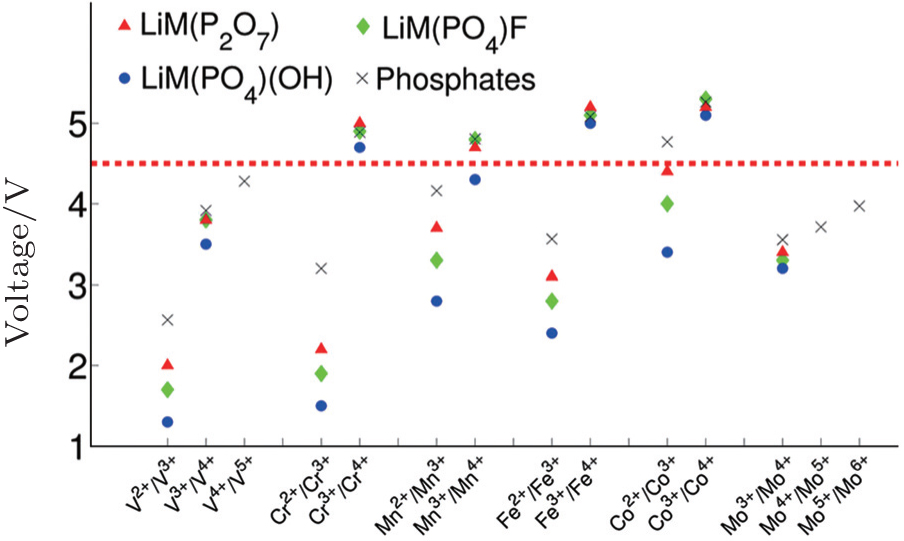 | Fig. 16. Computed voltages for different redox couples active in various phosphate and multielectron phosphate cathodes. [ 53 ] |
 | Fig. 17. (a) Representation of the tavorite structural arrangement and (b) overview of corresponding Li x M PO 4 Y compositions and redox voltages. [ 49 ] |
Figure
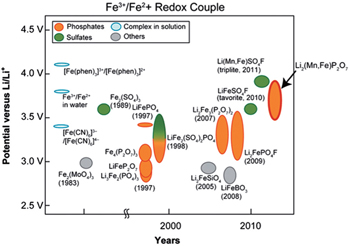
 | Fig. 18. Historical diagram comparing the potential of Fe 3+ /Fe 2+ redox couple (versus Li + /Li 0 ) of various Fe-based (phosphates, sulphates, complexes and others) cathode materials. The Mn-substituted Li 2 (Fe 1− x Mn x P 2 O 7 binary pyrophosphate shows the highest Fe 3+ /Fe 2+ redox potential, close to 4 V and similar to that of Li(Fe 1− x Mn x )SO 4 F. [ 68 , 69 ] |
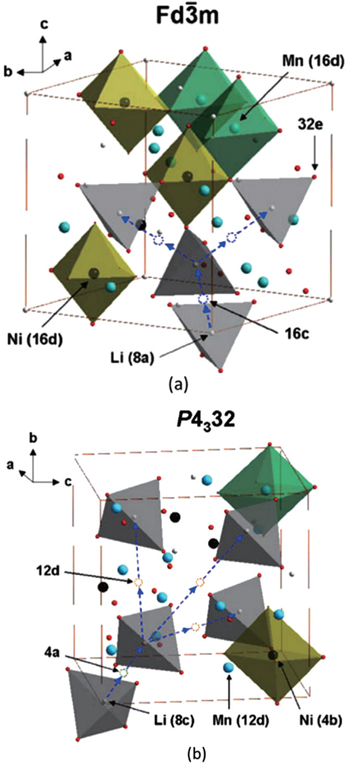
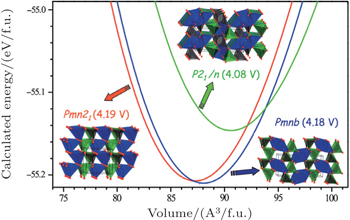
There are two kinds of crystal structures with different order degree in LiNi 0.5 Mn 1.5 O 4 , corresponding to the 

 | Fig. 19. The structures of LiNi 0.5 Mn 1.5 O 4 with the (a) |
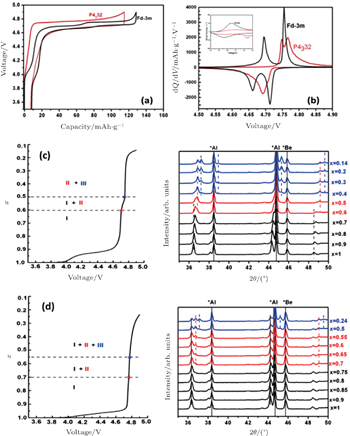
 | Fig. 20. (a) Charge/discharge curves, (b) the corresponding differential capacity versus voltage curves of LiNi 0.5 Mn 1.5 O 4 with the |
Generally speaking, the cathode materials with discharge voltage higher than 4.5 V are called the high voltage cathode materials, and they mainly include the spinel, olivine and other polyanionic salts (including −O, −F, −OH substitutions). Examples are shown in Table
The external limiting factor is the highest occupied molecular orbitals (HOMO) of the electrolyte, as shown in Fig.
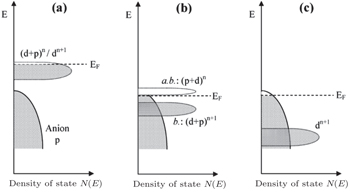
The inner limiting factor lies in the fact that the transition metal elements of the cathodes in the charged state reach a higher valence and exhibit strong oxidizability. As shown from Figs.
 | Fig. 22. Schematic representation of a slightly oxidized redox couple for different positions relative to the top of the anion p bands. (a) Itinerant versus polaronic character of hole states of a couple on the approach to the top of the anion p band, (b) pinned couple with predominantly antibonding (a.b.) anion p hole states and predominantly cationd bonding (b.) states, and (c) couple too far below top of anion p band for significant cation d character in hole states. [ 44 ] |
When the layered cathodes Li[Ni x Co y ]O 2 are highly charged, the O 2 p -orbital usually tends to lose electrons rather than the transition metal 3 d -orbital. In other words, the O 2− is oxidized by the high-valent transition metals [ 75 ] and may be released in the form of O 2 , [ 76 , 77 ] making the lattice structure lose its stability and causing safety problems. Manganese doping can lower the energy level of O 2 p -orbital and enhance the thermal stability, at the cost of the capacity decreasing. [ 77 ] Apart from the instability arising from O 2 evolution, other problems related to the layered cathodes and their promising solutions are summed up in Fig.
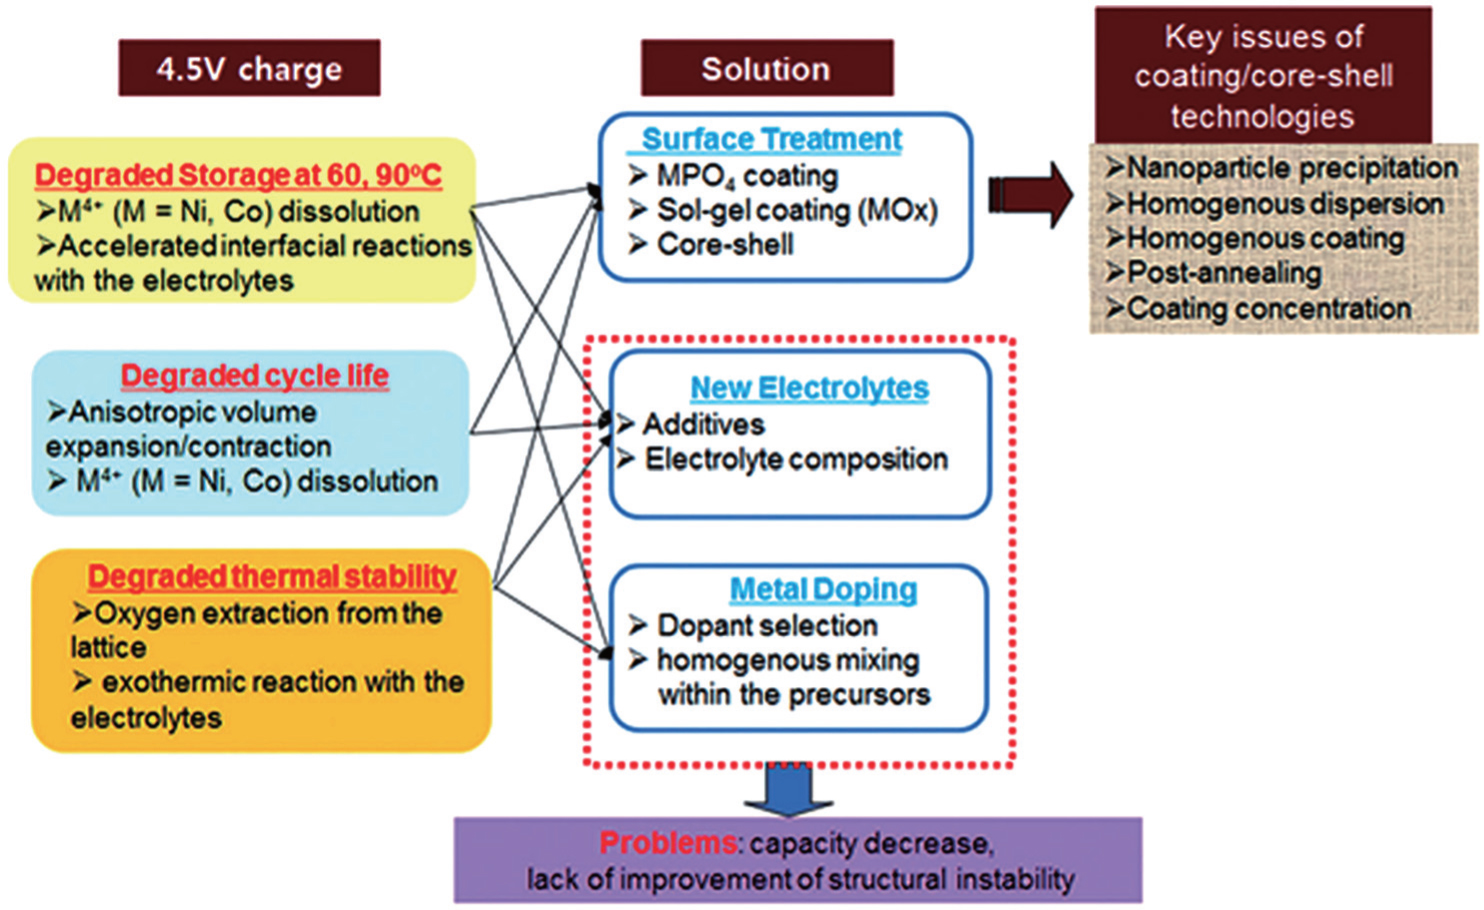 | Fig. 23. Problems and their solutions for cathode materials under increasing operating voltages and temperatures. [ 74 ] |
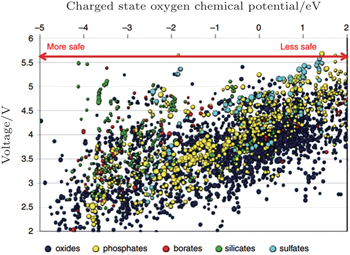
The more fundamental method to improve stability is to screen for novel materials with the proper structures and compositions that promise higher thermal stability. For example, the spinel structure material Li[Ni 0.5 Mn 1.5 ]O 4 has higher thermal stability than the layered materials. Figure
 | Fig. 24. Oxygen chemical potentials at which the charged state of thousands of cathode materials decompose versus their Li intercalation voltage. A more negative chemical potential indicates that the material can better withstand a reducing environment (higher temperature) and hence is safer. [ 40 ] |
Since OCV is the difference between the anodic and cathodic Li ion chemical potentials, or from the other aspect, between their electronic Fermi energy levels (i.e., their electric potentials), higher OCV can theoretically be obtained by lowering the (de)lithiation potential of the anode. Given that Li metal has the most negative standard electrode potential among the metals, it can be applied as the anode with the lowest potential for Li secondary batteries, as shown in Table
Usually, ethylene carbonate (EC) can be added to the electrolyte to form a stable SEI layer during the initial cycles. Thanks to the additives, graphite with the potential of 0.2 V can be applied as the anode for the batteries, with low irreversible capacity loss. In addition, the not too low potential also avoids the Li plating. With other advantages, such as the low cost and plentiful raw materials, high specific (2.5 times more than LiCoO 2 ) and volumetric (nearly equal to LiCoO 2 ) capacities, low voltage hysteresis, good rate capability, good thermal stability (providing the not too large surface), low volume expansion during lithiation, long cycle life, high Coulombic efficiency (CE), good electronic conductivity, good compaction performance, and so on, graphite anodes are called “miracles”. [ 6 ]
In order to obtain the higher capacity, Li alloy anodes (including metal oxides sharing the same mechanism with alloys) are widely investigated. [ 6 ] Since their Fermi energy levels are less than 1 eV versus Li metal, it is a challenge to enable the formation of SEI layer at the initial cycles (the better solution is to complete the formation of SEL layer before the batteries are assembled) and handle the capacity loss. In addition, the volume expansion during the lithiation (charge) process is usually a serious problem. Moreover, for the Li alloy anodes with low potential, Li plating on the surface of SEI layers should be avoided because it can bring about the safety issues, lead to the continuous growth of SEI layers and capacity loss.
The problems related to the low potential anodes can be solved by the application of electrolytes with a wider electrochemical window and higher stability. Another solution is to take advantage of anodes with potential higher than 1 V, such as Li 4 Ti 5 O 12 , so that the electrolyte decomposition and the SEI layer growth can be prevented within the operating voltage. In addition, the higher potential avoids Li plating, has the zero-strain property, and high rate capability.
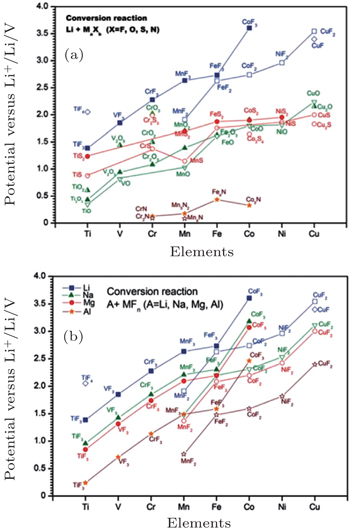
For the traditional electrodes based on the intercalation reaction (e.g., LiCoO 2 and LiMn 2 O 4 ) or phase transition (e.g., LiFePO 4 and Li 4 Ti 5 O 12 ), [ 9 ] the specific capacity is usually restricted by the electron exchange capacity on the 3 d -orbital of transition metals. In 2000, Poizot et al. found the novel reversible Li storage mechanism in the transition metal oxides, [ 78 ] followed by the discovery of abundant transition metal sulfides, fluorides, nitrides and phosphides with the similar mechanism, [ 8 , 79 – 87 ] which reads: MX +Li↔Li X + M ( X = O, S, F, N, P, Se; M = Ti, V, Cr, Mn, Fe, Co, Ni, Cu, Zn, Sn, Sb, Ru, Mo), called the conversion reaction. Based on this mechanism, there can be more than one oxidation state of the transition metal’s redox couples, and the Li storage capacity can be increased to 400–1100 mAh/g. The average OCV (AOCV) can be calculated from the thermodynamic data once the cathode and anode are chosen. [ 8 , 80 ] In 2011, Zu and Li calculated the AOCVs of the binary transition metal compounds with different anions ( X = F − , O 2− , S 2− , N 3− ), versus the various metallic anodes (Li, Na, Mg, Al), as shown in Fig.
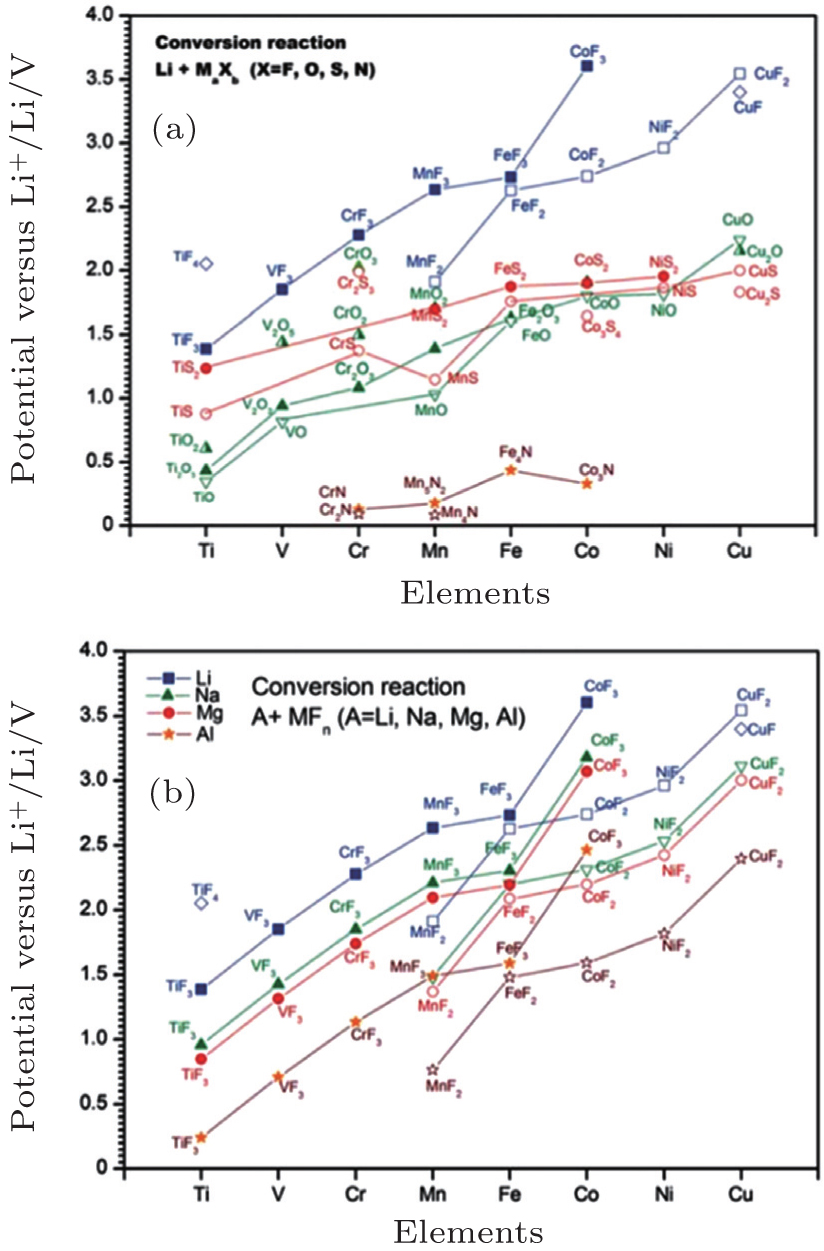 | Fig. 25. Calculated EMF values ( V ) of conversion reactions between (a) selected binary transition metal compounds and lithium, (b) selected binary transitional metal fluorides and Li, Na, Mg, or Al. [ 9 ] |
As reviewed in Section 3, the OCV can be calculated from the aspect of electronic Fermi energy level or the Li chemical potential. As for the Fermi energy level aspect, the problems concerning the electronic structure are as follows: [ 4 ] (i) The actual energy band is not exactly derived from the rigid band model, and the Li insertion during the discharge has an impact on the crystalline structure and thus on the electronic structure of the host matrix. (ii) The electrons may not totally transfer to or from the host matrix; instead, they may interact with Li + , or to say, electrons may not completely delocalize from Li atoms. (iii) The electrons may also not only transfer to the expected transition metal’s redox couples, as shown in Fig.
A more practical method is to calculate the total free energies of both host compound and Li metal, as explained in Eq. (

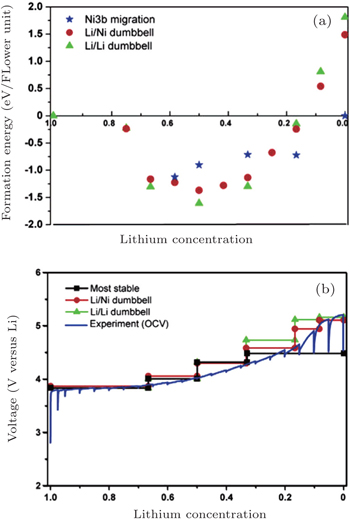
DFT calculation can be applied to investigate the periodic crystals with high accuracy, although for the electrodes in reality at the specific SOC, the Li ions and vacancies are usually distributed in a certain random degree. For the partially disordered crystals, the long- or short-range order of Li ions will make a difference to the actual voltage profile, so, only the SOC with the well-known Li ions distribution can be calculated. Even with the help of cluster expansion, only a few states can be established, and their free energies at 0 K have been calculated, as shown in Fig.
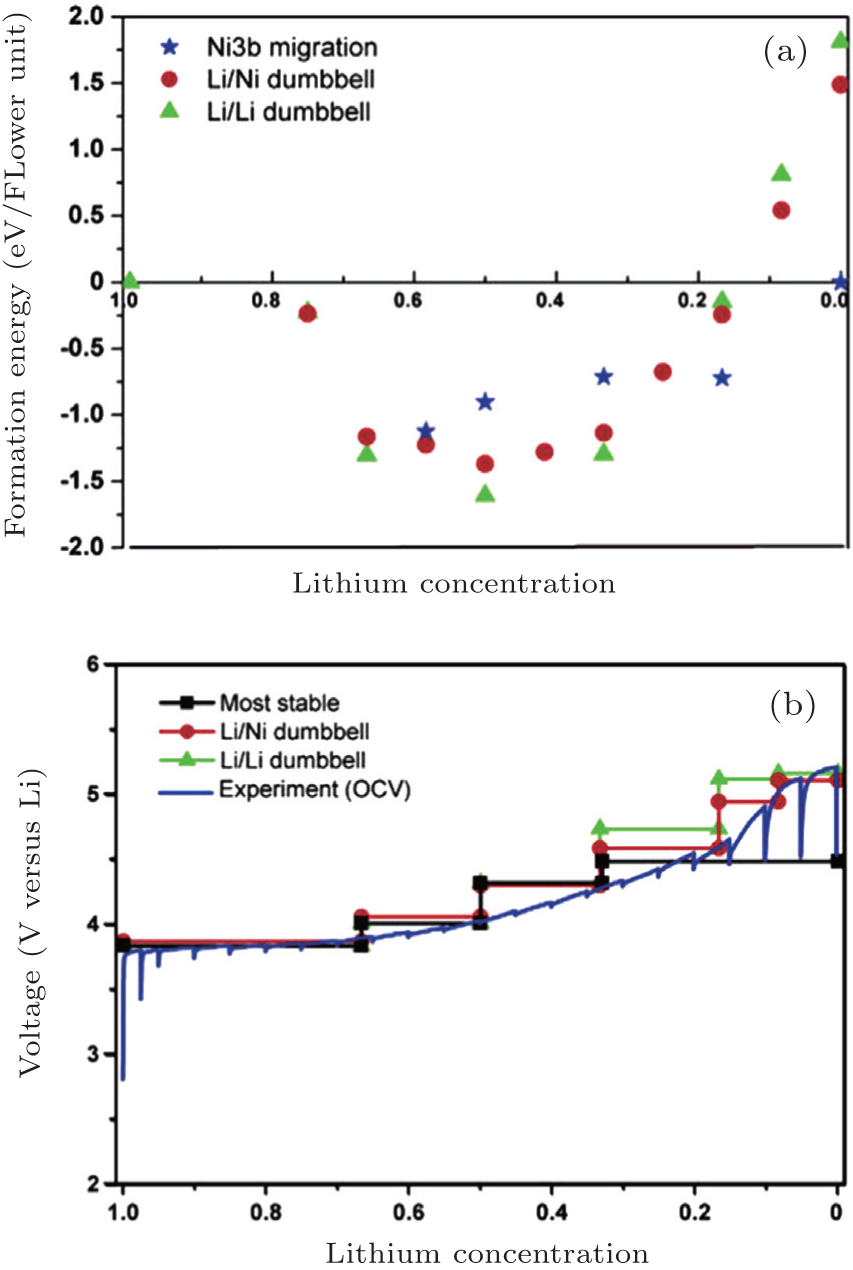 | Fig. 26. For LiNi 0.5 Mn 0.5 O 2 : (a) formation energy as a function of Li concentration of structures with three different lithium/nickel configurations. (b) Comparison between the calculated and experimental voltage curves. [ 88 ] |
At finite temperature above 0 K, entropy should be accounted for, as shown in Fig.
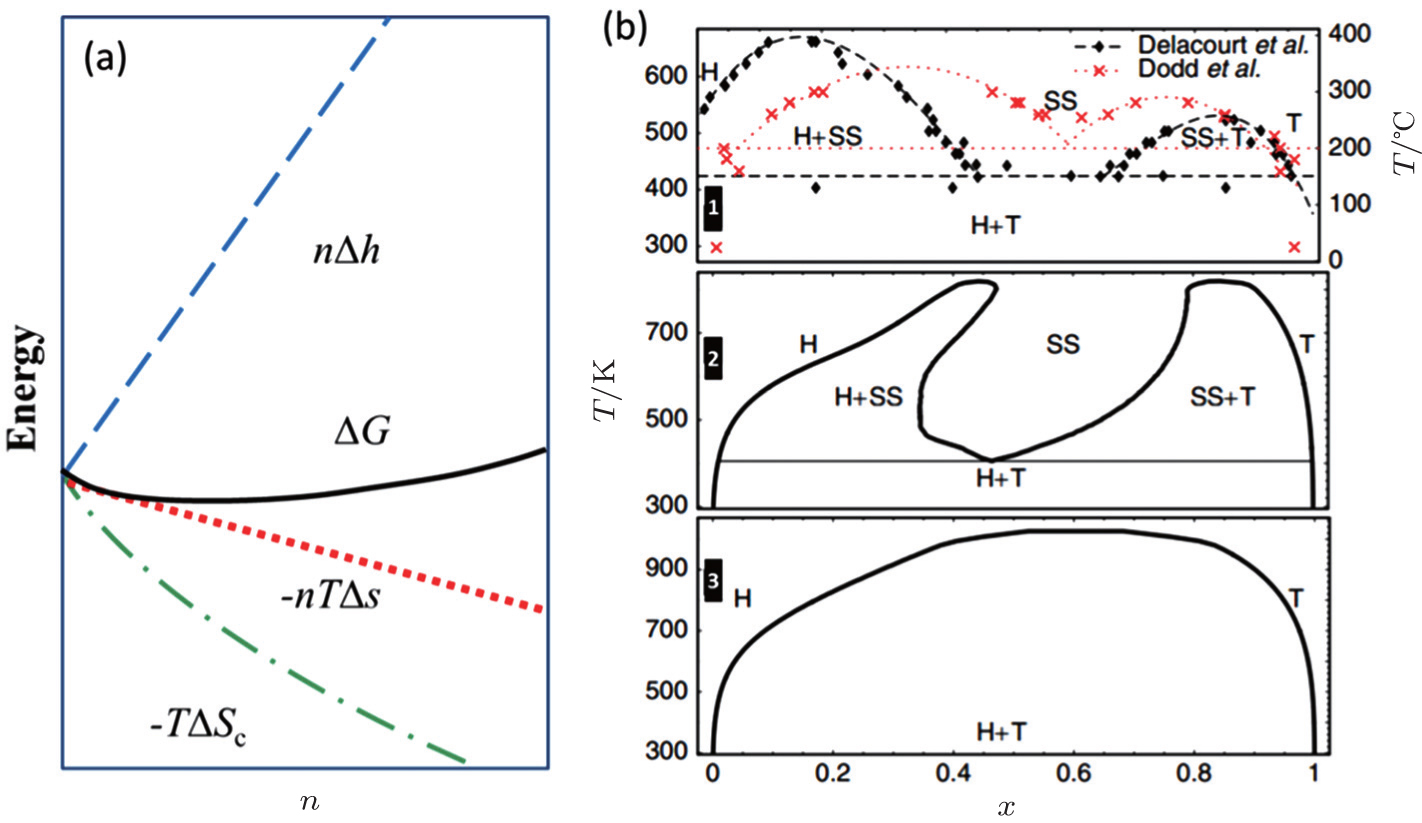 | Fig. 27. (a) The deviation from ideal crystallographic structure contributed by finite temperature induced entropy changing; (b) Li x FePO 4 phase diagram: experimental phase boundary data (top panel) taken from Delacourt et al. [ 89 ] and from Dodd et al. ; [ 90 ] calculated (middle panel) with both Li and electron degrees of freedom and (bottom panel) with explicit Li only. [ 91 ] |
An obvious hysteresis usually occurs in the conversion reaction, which can be ascribed to kinetics, including the simultaneous displacement of inserted Li ions and host matrix ions both, and the existence of nano-particles with the large specific surface areas after the initial cycles. [ 78 , 80 , 92 ] Besides, Li-storage obeying the conversion mechanism is often accompanied by complicated phenomena such as phase separation and interphase Li storage, rather than merely Li insertion, as shown in Fig.
As for Li x FeF 3 , [ 93 ] the voltage profile is shown in green line in Fig.
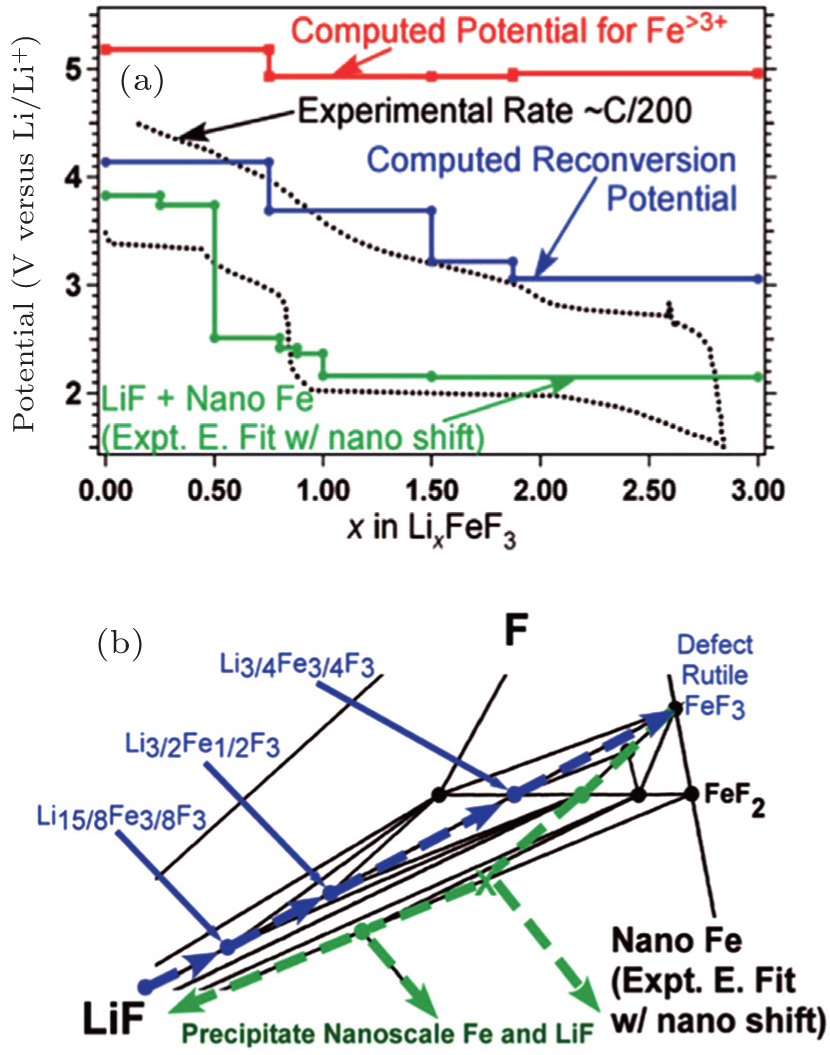 | Fig. 28. (a) The voltage profile for iron fluoride reconversion during charging (blue, solid line) as compared with the voltage profile for iron fluoride conversion when accounting for the energy of GGA computed nanoscale Fe (green, solid line) and the experimental profile (black, dotted line). The potentials required to form phases with Fe > 3 + during reconversion (red, solid line) are also presented. (b) The corresponding reaction path is highlighted for discharge (green, dashed arrows) and charge (blue, dashed arrows). [ 93 ] |
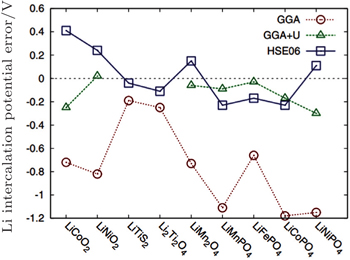
With the local density approximation (LDA) and the generalized gradient approximation (GGA) of exchange–correlation potential within the DFT framework, [ 95 – 97 ] early computational studies of cathodes usually underestimated the band gaps, corresponding to the underestimation of the theoretical OCV. This is due to the self-interaction error, and can be explained from the nature of Kohn–Sham formulation, in which the energy is obtained by solving the one-electron equation written as

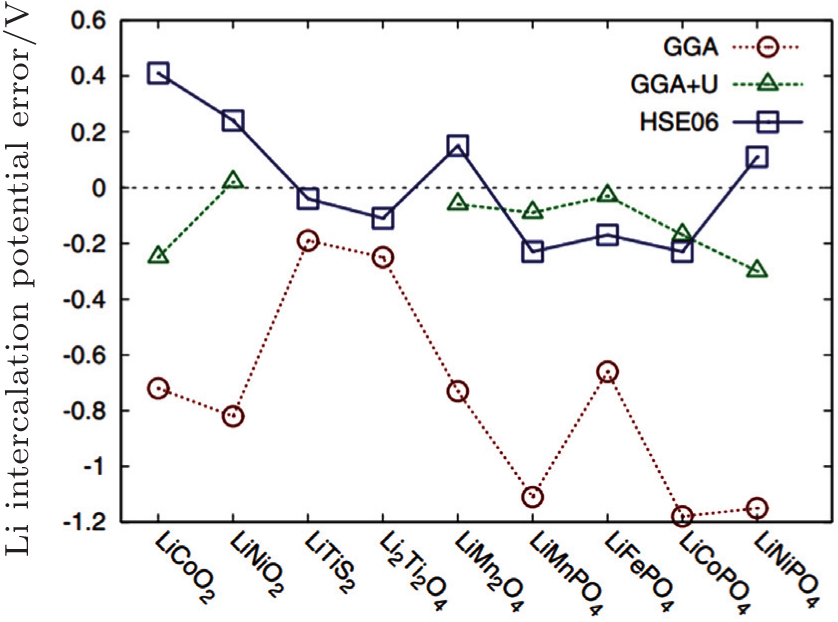 | Fig. 29. Error in calculated Li-insertion voltages for a series of cathode materials using the standard GGA, GGA + U, and HSE approximation. [ 99 ] |
The shortcoming of the above method lies in the adjustable parameter U – J , which should be provided by referring to the experiments or other separate calculations. Another method to correct the potential calculation is to mix exact Hatree–Fock (HF) exchange energy with DFT to get rid of other parameters, called the hybrid functional. However, the exact exchange introduced by HF method is nonlocal, which increases the calculation costs greatly (for 50–100 times more calculating time). Since the exchange interaction involves long- and short-range, Heyd–Scuseria–Ernzerhof (HSE) introduces the HF exchange only to the short range part, which can give the result in accordance with the experiment within the acceptable calculation costs as shown in Fig.
This review introduces the relationship among the electric potential, chemical potential, electrochemical potential, and the Fermi energy level in lithium ion batteries, as well as the relationship between the OCV and the structure, as well as the potential distribution all through the whole cell. A better understanding of the above scientific problems contributes to developing and designing high voltage cathodes, to designing interfaces to reduce the Ohmic drop of the internal circuit, to mitigating the heat generation during operation to prolong service life, to improving the rate performance, to retarding the interfacial ageing, to prolonging cycle life at a high rate, and so on. The internal circuit’s potential usually drops at the interfaces, determining the output voltage and power density and structural stability, although it is still a great challenge to investigate the thermodynamic and kinetic processes at the interfaces either experimentally or theoretically.
| 1 | |
| 2 | |
| 3 | |
| 4 | |
| 5 | |
| 6 | |
| 7 | |
| 8 | |
| 9 | |
| 10 | |
| 11 | |
| 12 | |
| 13 | |
| 14 | |
| 15 | |
| 16 | |
| 17 | |
| 18 | |
| 19 | |
| 20 | |
| 21 | |
| 22 | |
| 23 | |
| 24 | |
| 25 | |
| 26 | |
| 27 | |
| 28 | |
| 29 | |
| 30 | |
| 31 | |
| 32 | |
| 33 | |
| 34 | |
| 35 | |
| 36 | |
| 37 | |
| 38 | |
| 39 | |
| 40 | |
| 41 | |
| 42 | |
| 43 | |
| 44 | |
| 45 | |
| 46 | |
| 47 | |
| 48 | |
| 49 | |
| 50 | |
| 51 | |
| 52 | |
| 53 | |
| 54 | |
| 55 | |
| 56 | |
| 57 | |
| 58 | |
| 59 | |
| 60 | |
| 61 | |
| 62 | |
| 63 | |
| 64 | |
| 65 | |
| 66 | |
| 67 | |
| 68 | |
| 69 | |
| 70 | |
| 71 | |
| 72 | |
| 73 | |
| 74 | |
| 75 | |
| 76 | |
| 77 | |
| 78 | |
| 79 | |
| 80 | |
| 81 | |
| 82 | |
| 83 | |
| 84 | |
| 85 | |
| 86 | |
| 87 | |
| 88 | |
| 89 | |
| 90 | |
| 91 | |
| 92 | |
| 93 | |
| 94 | |
| 95 | |
| 96 | |
| 97 | |
| 98 | |
| 99 |