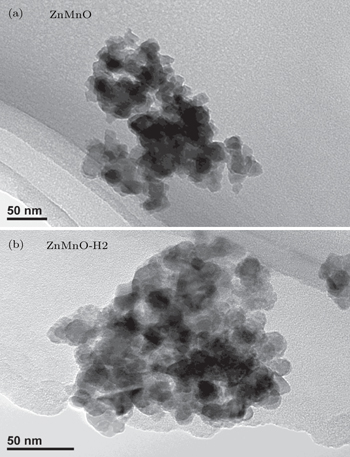
3.1. Characterization of the coordination environment Figure 1 shows x-ray diffraction (XRD) patterns of ZnMnO, ZnMnO-H1, and ZnMnO-H2. All the diffraction peaks could be attributed to pure ZnO with a wurtzite structure. No secondary phase is detectable within the resolution of XRD. Figure 2 shows the TEM images of ZnMnO and ZnMnO-H2. There is no obvious variation between these two samples, which indicates that annealing under H2/Ar atmosphere has no effect on the morphology of ZnMnO.
Figure 3 shows the normalized Mn K -edge XANES spectra of ZnMnO, ZnMnO-H1, ZnMnO-H2, MnO, Mn 2 O 3 , and ZnO reference samples. For comparison between Zn and Mn XANES spectra, the energy is rescaled to the respective absorption K -edges calculated from the first derivative of the XANES signal. [ 24 ] The Mn K -edge energy is used to characterize the average Mn oxidation state. The main edge energy shifts toward lower energy from ZnMnO to ZnMnO-H2, indicating a decrease in the oxidation state with increasing the value of H 2 /Ar. The peaks with positions marked by the dotted lines for our samples are the characteristic peaks of MnO and Mn 2 O 3 , which reveal that Mn oxidation states range between Mn 2+ and Mn 3+ . The valence of Mn in the un-hydrogenated sample is about +3, and ZnMnO-H2 mainly presents Mn 2+ oxidation states, while in ZnMnO-H1, Mn ions are found to be in a mixed valence state of Mn 2+ and Mn 3+ . Furthermore, the difference between the Mn K -edge features of ZnMnO and the Zn K -edge features of ZnO at 10–70 eV indicates that the chemical environment of Mn in ZnMnO is different from that of Zn in ZnO. It implies that the Mn 3+ ions do not substitute for Zn in the ZnMnO sample. When annealing in H 2 /Ar, the similar features at about 10–70 eV between the Mn K -edge of ZnMnO-H1 and the Zn K -edge of ZnO reveal that the chemical environment of some Mn is the same as that of Zn in ZnO. This means that part of the Mn 3+ ions have substituted for Zn 2+ in ZnO. With increasing the value of H 2 /Ar, the features in the post-edge region between the Mn K -edge of ZnMnO-H2 and the Zn K -edge of ZnO are almost the same, which reveals that most of the Mn ions have substituted for Zn.
Figure 4 shows the Mn K -edge Fourier transforms of the k 3 χ ( k ) functions of the EXAFS spectra. For comparison, the Mn K -edges of MnO, Mn 2 O 3 , and MnOOH, as well as Zn K -edge of pure ZnO, are presented along with those of the ZnMnO samples. Here, P 1 (1.41 Å) and P 3 (2.41 Å) are attributed to the first Mn–O and the second Mn–Mn coordination shells of MnO 6 in MnOOH, [ 25 ] respectively. P 2 (1.55 Å) and P 4 (2.93 Å) respectively represent the first Zn–O and the second Zn–Zn shells in ZnO. The coordination of Mn in Mn-doped ZnO turn into a four Mn–O bonded Mn 2+ O 4 tetrahedron while Mn substitutes for Zn. In ZnMnO nanocrystals, there are two peaks located at 1.41 Å and 2.41 Å, which means that the coordination environment of Mn mainly performs as the MnO 6 octahedral configuration. In the ZnMnO-H2 sample, two peaks at 1.55 Å and 2.93 Å indicate that Mn ions are demanded by MnO 4 tetrahedral configuration. In the ZnMnO-H1 sample, three main coordination peaks are found as shown in Fig. 4 . Peak A between peak P 1 and P 2 corresponds to the Mn–O coordination. The other two coexisting peaks, B and C appearing at the positions of P 3 and P 4 , represent the Mn–Mn coordination in MnO 6 and the Mn–Mn(Zn) coordination in MnO 4 , respectively. These illustrate that there are two different configurations of Mn in ZnMnO-H1 nanocrystal. As shown in the inset of Fig. 4 , the calculated areas of peaks B and C according to the Gauss fitting are explained as being due to the fact that the content ratio between MnO 4 and MnO 6 in ZnMnO-H1 is about 4:1.
Figure 5 shows the room-temperature Raman spectra of our samples. Compared with the spectrum of pure ZnO that we synthesized, we observe six modes at about 99.4, 332.3, 384.4, 438.6, 484.5, and 579.9 cm −1 corresponding to  , 2- E 2 (M),
  ,
,  , an interface or surface phonon mode (SPM), and
  mode, respectively. [ 26 ] Two additional modes at about 526.9 cm −1 and 665.1 cm −1 are denoted as AM1 and AM2. AM1 is assigned to the mode due to Mn 2+ dissolved in the ZnO lattice. [ 27 , 28 ] The origin of AM2 is still under intense debate. Samanta et al. [ 29 ] and Cong et al. [ 30 ] attributed it to the second phases ZnMn 2 O 4 and ZnMnO 3 , respectively. Yet there are no second phases in our samples. In the literature, this mode is reported in the Raman spectra of Mn 2 O 3 [ 31 ] and MnOOH. [ 32 ] As with our samples, the coordination environments of Mn in ZnMn 2 O 4 , ZnMnO 3 , Mn 2 O 3 , and MnOOH are also in the form of a MnO 6 octahedron. As a result, we attribute AM2 to a mode arising from MnO 6 octahedral coordination. As shown in Fig. 5 , the decreasing of the intensity of AM2 results from the decreasing of the concentration of MnO 6 octahedron with increasing the value of H 2 :Ar, which is consistent with the EXAFS spectra.
There are two main positions of Mn in the ZnO lattice after doping. One is interstitial, with the Mn ions forming the MnO 6 octahedral configuration as shown in Fig. 6(a) ; the other is Mn substitution for Zn, forming the MnO 4 tetrahedral configuration (Fig. 6(b) ). The different Mn oxidation states and local environments of our samples are shown in Table 1 . As mentioned above, the coordination of Mn in the as-prepared ZnMnO is primarily that in MnO 6 , which means that most Mn ions are in interstitial sites in the ZnO lattice. In ZnMnO-H2, the coordination of most Mn ions are those in MnO 4 , which is similar to the coordinates of ZnO 4 in ZnO. This reveals that most Mn ions substitute for Zn ions in the ZnO lattice. From the above analysis, we can conclude that hydrogen annealing can control the coordination environment of Mn in the ZnO lattice, i.e., it changes from Mn 3+ O 6 octahedral coordination to Mn 2+ O 4 tetrahedral coordination. As we discussed octylamine treatment of Mn-doped ZnO, [ 18 ] the estimated donor binding energy of an impurity ( E B ) can be expressed as

Here, the dielectric constant, ε , and the charge of the electron, e , are all constant. So E B only depends on the value of the Bohr radius of the donor, a d . In the as-prepared sample, the donor binding energy of the impurity is induced by Mn 3+ , in which there are four electrons in the d-shell. When the sample is annealed in hydrogen, H can offer an electron to the Mn 3+ ion and form a covalent bond with it. The hybridization between Mn and H would enhance the value of a d . According to Eq. ( 1 ), E B would decrease with increasing the value of H 2 :Ar, which induces a transformation of the Mn 3+ O 6 octahedron into Mn 2+ O 4 tetrahedron.
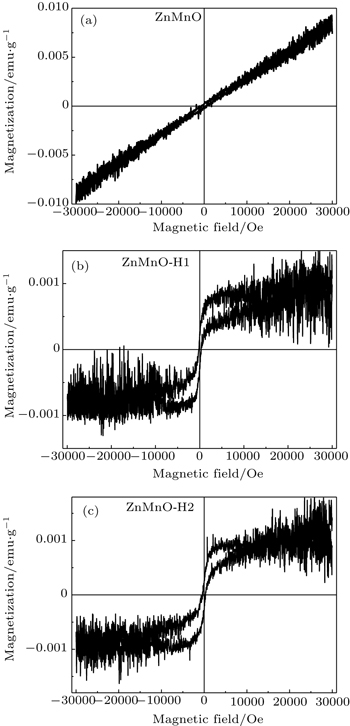
3.2. Magnetic properties Figures 7(a) – 7(c) demonstrate the curves of RT magnetization versus field ( M – H ). The as-prepared nanocrystal exhibits RT paramagnetism (PM), while the sample annealed in H 2 /Ar atmosphere is ferromagnetic (FM). The values of saturation magnetization ( M S ) of ZnMnO-H1 and ZnMnO-H2 are 0.008 and 0.01 emu/g, respectively. Our previous work [ 33 ] shows that the as-prepared Mn-doped ZnO nanocrystal is antiferromagnetic, and the Neel temperature is below RT. As a result, ZnMnO shows PM at RT. In addition, there is a similar variation between M S and the content of Mn 2+ O 4 tetrahedron, together with the H 2 content as shown in Table 1 . This results in the fact that RT ferromagnetism is related to the Mn 2+ O 4 tetrahedral coordination and H in a ZnO lattice.
Table 1.
Table 1.
 Table 1. Valence, main state of Mn in the ZnO lattice, the local coordination of Mn, and RT magnetic property in ZnMnO, ZnMnO-H1, and ZnMnO-H2. . | Samples | Valence | State of Mn in ZnO | Local coordination | RT magnetic property |
|---|
| ZnMnO | +3 | interstitial | MnO 6 | PM | | ZnMnO-H1 | +3& + 2 | interstitial & substitution | MnO 6 & MnO 4 | FM (0.008 emu/g) | | ZnMnO-H2 | +2 | substitution | MnO 4 | FM (0.01 emu/g) |
| Table 1. Valence, main state of Mn in the ZnO lattice, the local coordination of Mn, and RT magnetic property in ZnMnO, ZnMnO-H1, and ZnMnO-H2. . |
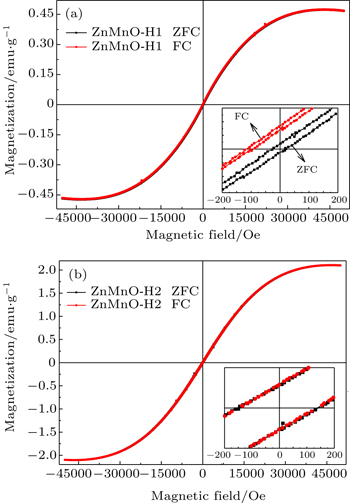
We also measure M – H curves of ZnMnO-H1 and ZnMnO-H2 at 5 K after cooling from 350 K in 0 and 1000 Oe fields. The loops of zero-field cooling (ZFC) and field cooling (FC) hysteresis are shown in Figs. 8(a) and 8(b) . All the samples are ferromagnetic, and the values of M S are 0.472, and 2.104 emu/g, respectively. In the ZnMnO-H1 sample as plotted in the enlargement near the low-field region in Fig. 8(a) , the hysteresis loop maintains good central symmetry in the ZFC process but displays negative exchange bias behavior in the FC, with the exchange bias field being about 70 Oe in the FC process. As is well known, the exchange bias phenomenon is generally ascribed to the exchange coupling at the interface between the ferromagnetic layer and the antiferromagnetic layer. [ 34 ] It is also reported that there is exchange bias in a single-phase magnet, such as Ru 0.25 Cr 0.75 O, [ 35 ] YbFe 2 O 4 . [ 36 ] As a result, the exchange bias behavior observed at 5 K proves that the system must contain at least two exchange-coupled states, such as antiferromagnetic phase and ferromagnetic coupling. The structural results testify that both Mn 3+ O 6 octahedron and Mn 2+ O 4 tetrahedron exist in the ZnMnO-H1 sample. There is no exchange bias phenomenon in ZnMnO-H2 (Fig. 8(b) ), in which Mn ions mainly exist in the form of Mn 2+ O 4 tetrahedron. Combining the above results and analysis, we believe that antiferromagnetic coupling is induced by Mn 3+ O 6 octahedral coordination, while ferromagnetic coupling is due to Mn 2+ O 4 tetrahedral coordination and some H-related structures. [ 23 ]
Figures 9(a) – 9(c) show the variations of magnetization with temperature ( M – T curve) of ZnMnO, measured in a temperature range from 5 K to 350 K in a magnetic field of 1000 Oe. In order to further investigate the phase transition, we calculate the inverse magnetic susceptibility as a function of temperature (1/ χ – T curve) from M – T data. There are magnetic phase transitions at about 100 K in all samples. Martínez et al. [ 37 ] considered it as an AFM–PM phase transition. Linear fitting of the 1/ χ – T curve from 5 K to 250 K is carried out in these three samples, and the fitting formulas are χ = 0.71/( T + 39.9), χ = 0.86/( T + 124.5), and χ = 0.9/( T + 34.2), respectively. According to the Curie–Weiss formula, χ = C 0 /( T + θ 0 ), we can obtain the value of the Curie–Weiss temperature, θ 0 , and the Curie constant, C 0 , as shown in Table 2 . The negative value of θ 0 verifies the existence of antiferromagnetic coupling in each of our three samples. The antiferromagnetic behavior could be assigned to the magnetic interaction between trivalent Mn ions in Mn 3+ O 6 octahedral coordination. The Curie constant can be given as

where
g is the Lande factor,
S is the spin quantum number,
μ B is the Bohr magneton,
k B is the Boltzman constant, and
n is the number of cation sites per unit volume. The exchange integral between the nearest neighbors
J can be explained as

where
z is the number of nearest-neighbor cations in the case of the wurtzite structure, and
θ 0 is the Curie–Weiss temperature. According to Eqs. (
2 ) and (
3 ),
J can be obtained from
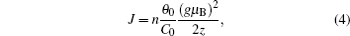
where (
gμ B )
2 /2
z is constant. So the value of
J only depends on the value of
nθ 0 /
C 0 , with
θ 0 and
C 0 being evaluated from the extrapolation line, and
n being in direct proportion to the number of Mn
3+ . Table
2 summarizes the values of
θ 0 ,
C 0 ,
n , and
J . As the density of Mn
3+ O
6 octahedron decreases, the magnitude of
J decreases. This confirms the strong antiferromagnetic exchange coupling in the as-prepared sample and the weak antiferromagnetic coupling in the hydrogen annealed samples. This calculated result provides further evidence to support our hypothesis that antiferromagnetic coupling originates from the Mn
3+ O
6 octahedron.
There is other magnetic phase transition at about 250 K in both hydrogen annealed samples as displayed in Figs. 9(b) and 9(c) . We consider this as an FM–PM transition because the 1/ χ – T curve is similar to the scenario in the schematic diagram of the FM–PM phase transition. Annealing in H 2 is an effective method to enhance M S in ZnCoO [ 20 ] or ZnMnO [ 23 ] nanocrystal. Also, this FM–PM phase transition only appears in the annealed sample but not the as-prepared sample, which makes us propose that the ferromagnetic behavior below 250 K could be attributed to some H-related configurations in the hydrogen annealed samples.
Table 2.
Table 2.
Table 2. Values of θ 0 , C 0 , θ 0 / C 0 , n , and J . . | Samples | θ 0 /K | C 0 /g·K·emu −1 | ( θ 0 / C 0 )/emu·g −1 | n /arb. units | J /arb. unit |
|---|
| ZnMnO | −39.9 | 0.71 | −56.2 | ∼1 | ∼ −56 | | ZnMnO-H1 | −124.5 | 0.86 | −144.8 | ∼0.2 | ∼ −29 | | ZnMnO-H2 | −34.2 | 0.9 | −38 | ≪0.1 | ≪ −3.8 |
| Table 2. Values of θ 0 , C 0 , θ 0 / C 0 , n , and J . . |
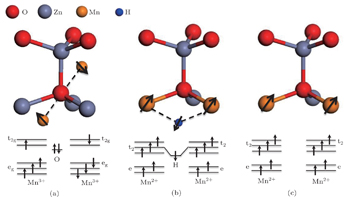
In order to establish the relationship between the magnetic coupling and the coordination environment of Mn in the ZnO lattice, crystal lattice and energy level diagrams of a Mn 3+ O 6 octahedron at an interstitial site and a Mn 2+ O 4 tetrahedron at a substitutional site are given in Fig. 10 . In the as-prepared sample (Fig. 10(a) ), the neighboring Mn ions in the Mn 3+ O 6 octahedron form a Mn 3+ –O 2− –Mn 3+ complex with a bond angle of 180°. According to the superexchange interaction, [ 38 ] one p electron of the O atom would couple with the e g orbital of Mn 3+ . In addition, this electron in the p orbital of the O atom must be antiparallel to the e g orbital, which makes the two neighboring Mn 3+ ions antiparallel. Thus, the system exhibits antiferromagnetic behavior. It also explains why most researchers have observed antiferromagnetic behavior in Mn-dopant ZnO. When the nanocrystal is annealed under H 2 , many interstitial H (H i ) atoms are incorporated into the nanocrystal. We hold the opinion that the substitutional Mn (Mn 2+ O 4 tetrahedron) and H i would form a Mn–H–Mn bridge structure. A similar structure has been reported by Park et al. [ 39 ] through electron paramagnetic resonance and nuclear magnetic resonance spectra. In this case, the spins of the two neighboring substitutional Mn ions become parallel via the H i mediator, as shown in Fig. 10(b) . This Mn–H–Mn bridge structure leads to the enhancement of ferromagnetic coupling in hydrogen annealed nanocrystals, as we have observed in hydrogen annealed Co-doped ZnO nanocrystals. [ 20 ] Another reason which gives rise to FM may originate from ferromagnetic coupling to the exchange interaction between two neighboring Mn 2+ ions. In Fig. 10(c) , the bond angle of Mn 2+ –O 2− –Mn 2+ is 120° and the distance between Mn ions decreases when Mn ions substitute for Zn ions. Consequently, the neighboring Mn 2+ ions can couple with each other and a parallel ferromagnetic coupling is produced between the two neighboring Mn 2+ ions. Our results clearly point out the relationship between the magnetic properties and the coordination environment of Mn in the ZnO lattice. This relationship may provide a new perspective for understanding the current controversial experimental results in transition metal doped DMSs. It should be seriously taken into account in future DMS studies.


 , Xu Huai-Zhe 1, ‡,