Uncovering the underlying physical mechanisms of biological systems via quantification of landscape and flux
Xu Li1, †,  , Chu Xiakun1, Yan Zhiqiang1, Zheng Xiliang1, Zhang Kun1, Zhang Feng1, Yan Han1, Wu Wei1, Wang Jin1, 2, ‡,
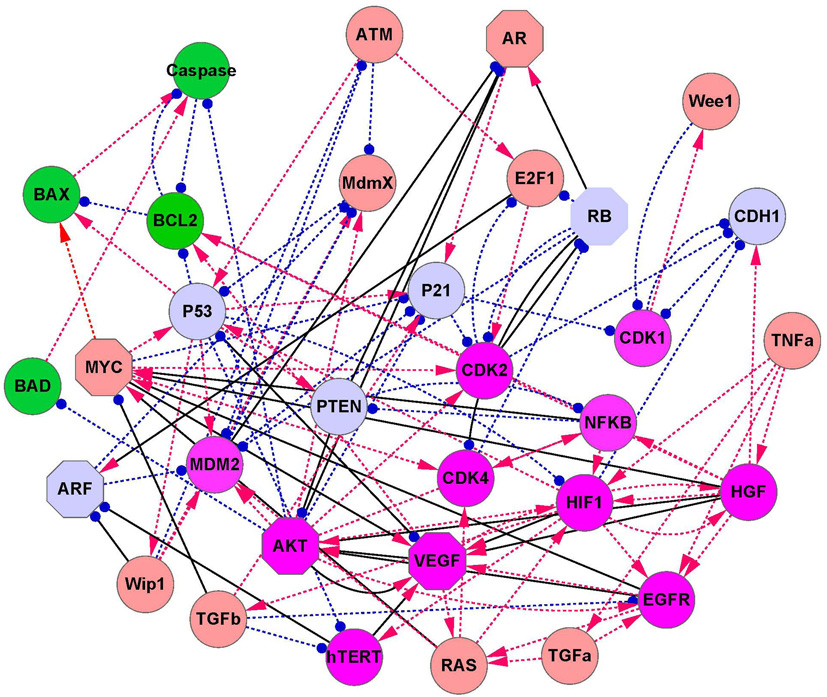
, Chu Xiakun1, Yan Zhiqiang1, Zheng Xiliang1, Zhang Kun1, Zhang Feng1, Yan Han1, Wu Wei1, Wang Jin1, 2, ‡, The diagram of the cancer network which has 32 nodes and 111 edges. Red arrows denote activation while blue end points represent repression. Green nodes represent apoptosis marker genes; magenta nodes represent cancer marker genes; and light blue represent nodes tumor repressor marker genes. The brown nodes represent other genes. The solid black lines denote the key links, while the octagon nodes denote key genes found by the method of global sensitivity analysis.[