Li-ion batteries: Phase transition
Hou Peiyu1, Chu Geng2, Gao Jian2, Zhang Yantao1, Zhang Lianqi1, †, 
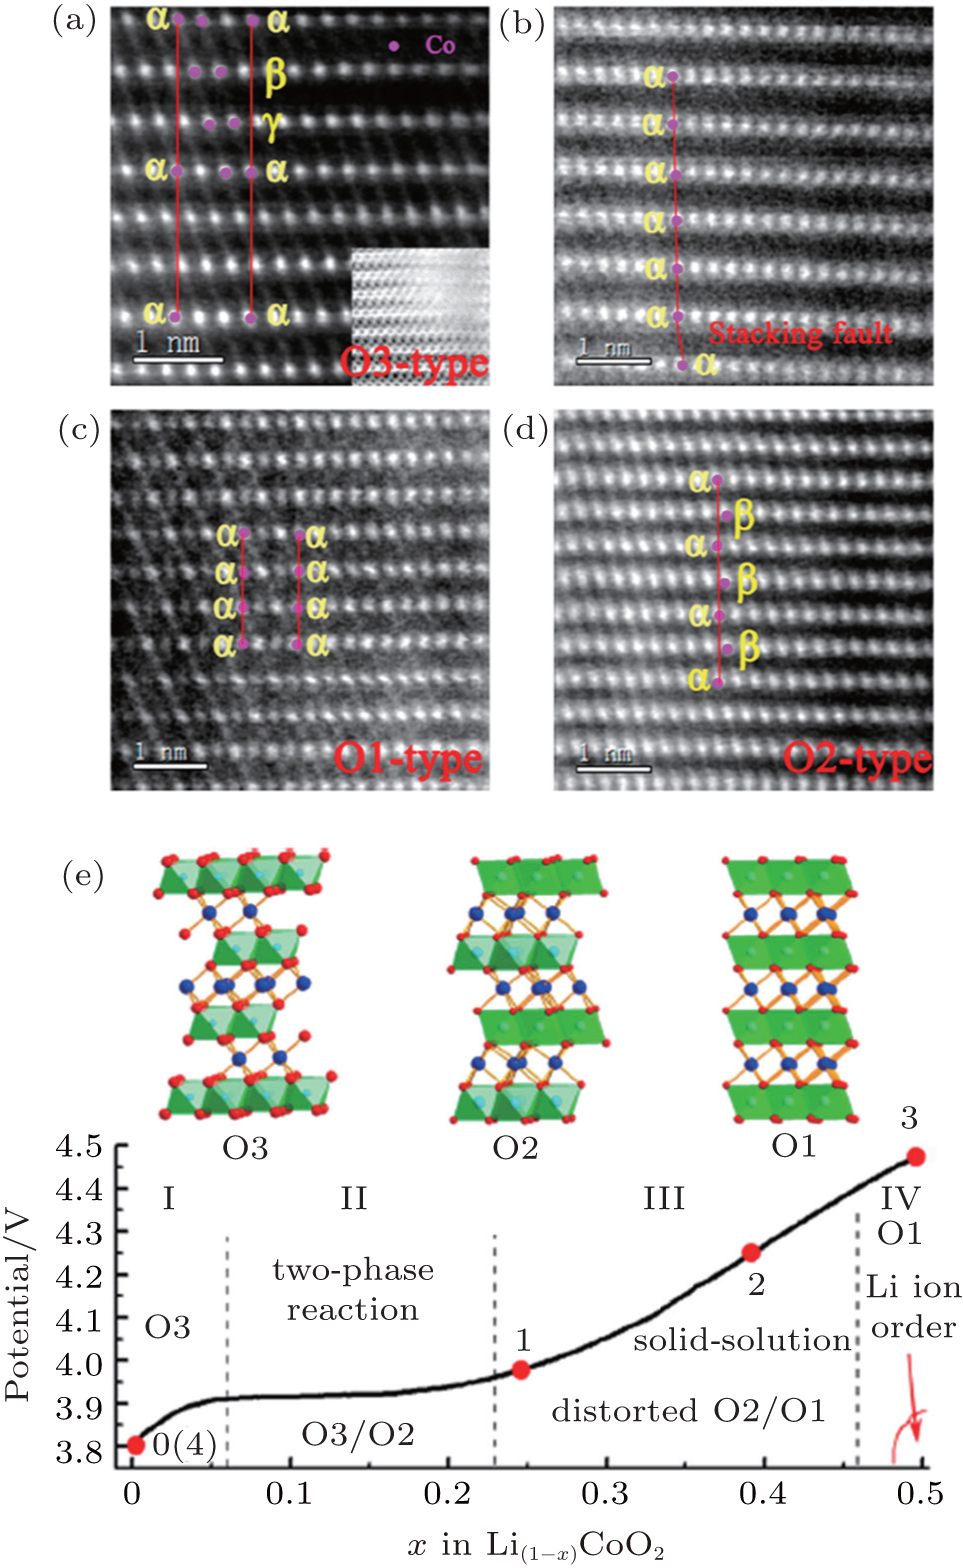
STEM-HAADF images of surface structure: (a) pristine LiCoO2, (b) LiCoO2charged to 4.2 V, (c) charged to 4.5 V, and (d) discharged to 3.0 V at the [010] zone axis. (e) Phase diagram of Li