Trukhanov Alex, Panina Larisa, Trukhanov Sergei, Turchenko Vitalii, Salem Mohamed. Evolution of structure and physical properties in Al-substituted Ba-hexaferrites. Chinese Physics B , 2016, 25(1): 016102
Permissions
Evolution of structure and physical properties in Al-substituted Ba-hexaferrites
Trukhanov Alex 1, 2, †, , Panina Larisa 1 , Trukhanov Sergei 2 , Turchenko Vitalii 3 , Salem Mohamed 1
National University of Science and Technology MISiS, 119049, Moscow, Leninsky Prospekt, 4, Russia
SSPA Scientific and Practical Materials Research Centre of NAS of Belarus, 220072 RB, Minsk, 19 P. Brovki Str., Russia
Joint Institute for Nuclear Research, 141980, Dubna, 6 Joliot-Curie Street, Russia
Project supported by the Ministry of Education and Science of the Russian Federation in the framework of Increase Competitiveness Program of NUST “MISiS” (Grant No. K4-2015-040). L. Panina acknowledges support under the Russian Federation State contract for organizing a scientific work.
Abstract
Abstract
The investigations of the crystal and magnetic structures of the BaFe 12− x Al x O 19 ( x = 0.1–1.2) solid solutions have been performed with powder neutron diffractometry. Magnetic properties of the BaFe 12− x Al x O 19 ( x = 0.1–1.2) solid solutions have been measured by vibration sample magnetometry at different temperatures under different magnetic fields. The atomic coordinates and lattice parameters have been Rietveld refined. The invar effect is observed in low temperature range (from 4.2 K to 150 K). It is explained by the thermal oscillation anharmonicity of atoms. The increase of microstress with decreasing temperature is found from Rietveld refinement. The Curie temperature and the change of total magnetic moment per formula unit are found for all compositions of the BaFe 12− x Al x O 19 ( x = 0.1–1.2) solid solutions. The magnetic structure model is proposed. The most likely reasons and the mechanism of magnetic structure formation are discussed.
The barium and strontium hexaferrites and the solid solutions on their base doped with Al 3+ , Sc 3+ , In 3+ , La 3+ , Co 2+ , and Ga 3+ ions [ 1 – 4 ] attract much attention [ 5 – 7 ] due to their unique physical properties. They provide a wide range of potential applications, such as multiple-state memory elements, novel memory media, transducers, and new functional sensors. It is interesting that the materials in which ferroelectricity and ferromagnetism coexist are rare [ 8 ] and mostly provide rather weak ferromagnetism. Because the multiferroism at room temperature is an essential issue for the realization of multiferroic devices that exploit the coupling between ferroelectric and ferromagnetic orders at ambient conditions, BiFeO 3 , [ 9 ] together with recently investigated LuFe 2 O 4 , [ 10 ] Pb 2 Fe 2 O 5 , [ 11 ] and PbFe 12 O 19 , [ 12 ] are currently considered to be promising candidates for device applications. The perovskite BiFeO 3 [ 9 ] shows weak magnetism, which somehow limits its practical application. Therefore, preparation of a material in which large ferroelectricity and strong ferromagnetism coexist would be a milestone for modern electrics and functionalized materials. [ 13 ] Since large ferroelectric polarization is found in PbFe 12 O 19 ceramics [ 12 ] with hexagonal structure, it opens a new direction for potential multiferroic candidates to the conventional ferromagnetic oxides, such as BaFe 12 O 19 , which holds similar perovskite-like lattice units in its hexagonal structure.
As earlier studies have shown, [ 14 ] BaFe 12 O 19 is a prospective Pb-free multiferroic material. A large spontaneous polarization is observed in the BaFe 12 O 19 ceramics at room temperature, revealing a clear ferroelectric hysteresis loop. The maximum remanent polarization is estimated to be approximately 11.8 μC/cm 2 . The FeO 6 octahedron in its perovskite-like hexagonal unit cell and the shift of Fe 3+ off the center of the octahedron are suggested to be the origin of the polarization in BaFe 12 O 19 . The magnetic field induced electric polarization has also been observed in the doped BaFe 12− x − δ Sc x M δ O 19 ( δ = 0.05) at 10 K. [ 15 ]
The presence of a magnetically ordered state and ferroelectric properties open the wide practical application of hexaferrites. The key point for such applications is controlling the magnetic properties of these materials. The analysis of experimental data of multicomponent oxides shows that their physical properties are directly dependent on the concentration of the diamagnetic substitution, [ 16 ] the type of crystal structure, the crystalline size, [ 17 ] and the even anion stoichiometry. [ 18 , 19 ] The detailed study on the crystal structure and magnetic properties for the BaFe 12− x Al x O 19 ( x = 0.1–1.2) solid solutions are presented and discussed in the present paper.
Section 2 describes the technique of synthesis of samples and methods of investigation of their structure and properties. In Section 3, experimental results of the crystal structure and magnetic properties of the BaFe 12− x Al x O 19 ( x = 0.1–1.2) solid solutions are discussed. Main findings are summarized in Section 4.
2. Experiment
The investigated BaFe 12− x Al x O 19 ( x = 0.1; 0.3; 0.6; 09 and 1.2) samples were obtained from high purity Fe 2 O 3 and Al 2 O 3 oxides and carbonate BaCO 3 using two-step topotactic reactions (the conventional solid reaction method). First, the oxides and carbonate were mixed with the design ratio. Then the prefiring was performed at 1200 °C in air for 6 h. The final synthesis was carried out at 1300 °C in air for 6 h. After synthesis, the sample was slowly cooled (100 °C·h − 1 ). The formation of BaFe 12− x Al x O 19 powder can be represented as follows:
The powder neutron investigations of the solid solutions were performed using the neutron time of flight method with a high resolution Fourier diffractometer (HRFD, Dubna) in a broad temperature range (4.2–730 K). The refining of crystal and magnetic structures was performed by Rietveld analysis [ 20 ] using the FullProf software program. The resolution of the diffractometer was Δ d / d ∼ 0.001% and the lattice parameters were defined more exactly at standard Al 2 O 3 (standard SRM-676 of NIST, USA). Field dependences of specific magnetization were measured at 300 K by using a liquid helium free high field measurement system (VSM). The Curie temperature was defined in the temperature range of 300–800 K and in a magnetic field of 0.86 T. The ferromagnetic–paramagnetic phase transition temperature for BaFe 12− x Al x O 19 is defined as the inflection point in the temperature dependence of the specific magnetization.
3. Results and discussion
3.1. Crystal structure
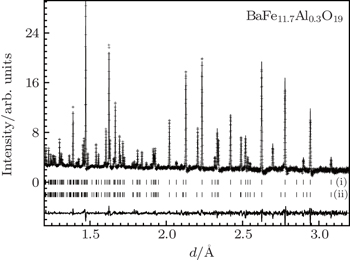
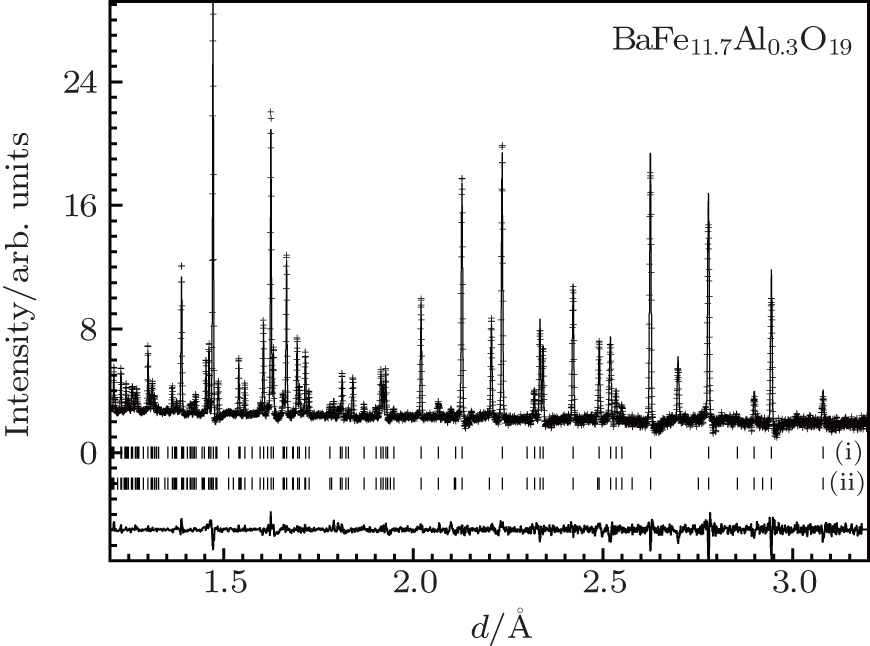
According to the neutron data, the investigated samples possess a hexagonal structure with space group P 6 3 / mmc and have two molecules in one unit cell ( Z = 2). The powder neutron diffraction pattern of BaFe 11 .7Al 0 .3O 19 is presented in Fig. 1 .
Fig. 1. Powder neutron diffraction pattern of BaFe 11 .7Al 0 .3O 19 measured at 300 K and calculated by Rietveld method. The experimental points (crosses), calculated values (curve), difference curve (lower curve), and diffraction peak positions (vertical bars) for the atomic (i) and the magnetic (ii) structures of BaFe 11 .7Al 0 .3O 19 are shown.
Table 1.
Table 1.
Table 1.
Crystal structure parameters obtained by powder neutron diffraction at 300 K for the BaFe 12− x Al x O 19 ( x = 0.1–1.2) solid solutions.
.
Parameters
0.1
0.3
0.6
0.9
1.2
a /Å
5.8899(2)
5.8854(1)
5.8846(1)
5.8809(2)
5.8700(2)
c /Å
23.1972(6)
23.1756(5)
23.1719(3)
23.1686(9)
23.1268(9)
V /Å 3
696.91(3)
695.21(2)
694.91(2)
693.93(5)
690.12(4)
Fe3/Al3 (4f IV )
z
0.02741(16)
0.02717(17)
0.02771(17)
0.02780(24)
0.02815(30)
Fe4/Al4 (4f VI )
z
0.18898(12)
0.18996(13)
0.19008(13)
0.18908(18)
0.19005(24)
Fe5/Al5 (12k)
x
0.16689(43)
0.16768(49)
0.16715(42)
0.16724(62)
0.16893(84)
z
–0.10829(5)
–0.10812(5)
–0.10805(6)
–0.10762(8)
–0.10727(12)
O1 (4e)
z
0.15016(17)
0.15050(18)
0.14930(19)
0.14871(31)
0.14882(38)
O2 (4f)
z
–0.05512(20)
–0.05586(22)
–0.05437(23)
–0.05481(33)
–0.05474(45)
O3 (6h)
x
0.18875(89)
0.18568(110)
0.18268(104)
0.18262(118)
0.18194(187)
O4 (12k)
x
0.15559(70)
0.15385(76)
0.15384(69)
0.15407(109)
0.15050(125)
z
0.05182(11)
0.05139(11)
0.05152(11)
0.05230(19)
0.05178(24)
O5 (12k)
x
0.50339(92)
0.50423(100)
0.50556(89)
0.50557(151)
0.50839(164)
z
0.14909(8)
0.14891(8)
0.14848(9)
0.14801(14)
0.14784(19)
R wp /%
9.08
8.55
11.1
15.2
23.5
R exp /%
5.54
6.79
8.81
11.05
16.21
R B /%
4.24
4.51
4.15
6.87
9.82
R Mag /%
6.24
5.10
8.87
10.2
17.7
χ 2
2.69
1.59
1.60
1.88
2.11
Table 1.
Crystal structure parameters obtained by powder neutron diffraction at 300 K for the BaFe 12− x Al x O 19 ( x = 0.1–1.2) solid solutions.
.
An impurity hematite phase Fe 2 O 3 with space group R -3 c and six molecules in one unit cell ( Z = 6) is also observed, similar to the finding in Refs. [ 21 ] and [ 22 ]. This is the result of slight dissolution of BaO·Fe 2 O 3 (tetragonal lattice) in the M-type hexaferrite. The impurity phase can be eliminated by introducing the synthesis of a small amount (0.4 mol%) of BaO.
The R wp (weighted profile R value), R exp (expected R value), R B (Bragg R factor), R Mag (magnetic R factor), and χ 2 (goodness-of-fit quality factor) [ 23 ] obtained after refinement are presented in Table 1 . The low values of the fitting parameters suggest that the studied sample is of better quality and the refinements of neutron data are effective.
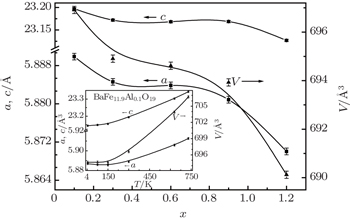
The dependence of the lattice parameters on the composition is shown in Fig. 2 . The volume of the unit cell of the Al-doped barium hexaferrite is smaller than that of pure BaFe 12 O 19 . [ 24 , 25 ] When the aluminum ion concentration increases, the volume of the unit cell decreases. It is due to the smaller ionic radius of the Al 3+ ions (0.535 Å), unlike that of the Fe 3+ (0.645 Å) ions. [ 26 ]
Fig. 2. The concentration dependence of the refined lattice parameters a , c and unit cell volume V obtained by powder neutron diffraction at 300 K for the BaFe 12− x Al x O 19 ( x = 0.1–1.2) solid solutions. Insert demonstrates the temperature dependence of the refined lattice parameters a , c and unit cell volume V .
The quantitative phase analysis is performed with the Rietveld refinement date using the following equation: [ 27 ]
where S j is the Rietveld scale factor, Z j is the number of formula units per unit cell, M j is the formula unit molecular weight, V j is the unit cell volume of the j -th phase, and the summation is over all phases included in the model. According to our calculation, the weight percentage of the secondary phase is nearly 0.97%–1.4%.
The unit cell volume as well as the lattice parameters a , c decreases with decreasing temperature (insert of Fig. 2 ). For a typical ferrite, the coefficient of linear thermal expansion is calculated as
where L and L 0 are the lengths at temperature T and reference temperature T 0 , respectively. The high anisotropy of the crystal structure leads to different coefficients of linear thermal expansion for a ( α a ∼ 9.32 × 10 − 6 K − 1 ) and c ( α c ∼ 1.5 × 10 − 5 K − 1 ) axes.
In low temperature range from 4.2 K to 150 K, the invar effect (zero thermal expansion coefficient) is observed for all compositions. In this range, decreasing temperature leads to a small decrease of cell volume and c axis, whereas a axis increases. The insert in Fig. 2 shows that decreasing temperature leads to the decrease of the cell volume by 0.002 Å 3 , the decrease of the c axis by 0.01 Å, and the increase of the a axis by 0.001 Å. Similar dependences of the lattice parameters on temperature were observed in steels, [ 28 ] metallic oxides, [ 29 ] and invar alloys. [ 30 ] It is well known that the thermal extension is defined by lattice, electron, and magnetic contributions. The lattice contribution gives the main contribution at high temperature. The electron and magnetic contributions exceed the lattice contribution in the low temperature region. The analysis of low temperature neutron reflexes denotes the absence of changes in magnetic structure as distinct from invar alloys near the phase transition temperature. In our opinion, the most credible explanation of the thermal expansion behavior in the temperature range from 4.2 K to 150 K for BaFe 12− x Al x O 19 is the anharmonicity of low energy phonon modes, as proposed in Ref. [ 31 ].
3.2. Microstructure
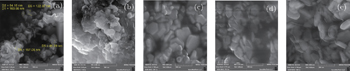
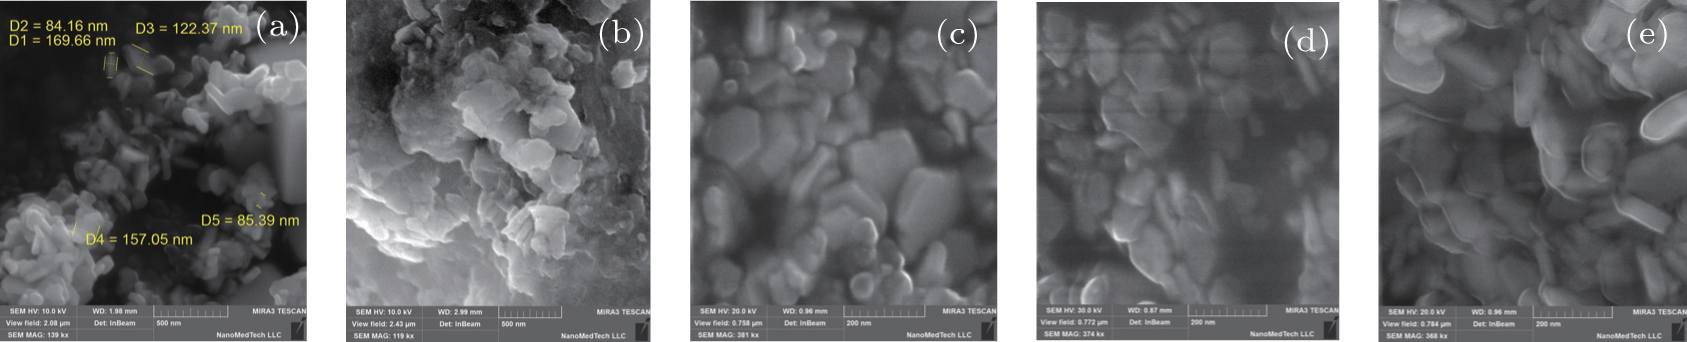
Figure 3 demonstrates electron microscopy images of the BaFe 12− x Al x O 19 ceramics. The samples are densely packed polycrystals (> 95%) with an average crystallite size of 200 nm. The variation in grain size is significant. The grains have an identifiable manner with hexagonal plate cut.
Fig. 3. Microstructure images obtained by scanning electron microscopy for the BaFe 12− x Al x O 19 ( x = 0.1–1.2) solid solutions: (a) x = 0.1, (b) x = 0.3, (c) x = 0.6, (d) x = 0.9, (e) x = 1.2.
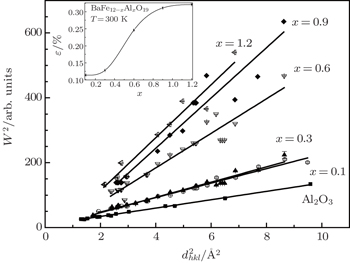
The information about microstrain is obtained from the diffraction line broadening. The reflection-half-width square W 2 versus interplanar spacing square d 2 for BaFe 12− x Al x O 19 is shown at Fig. 4 .
Fig. 4. The dependence of the full-width-at-half-maximum square of diffraction peaks on interplanar distance square at 300 K for the BaFe 12− x Al x O 19 ( x = 0.1–1.2) solid solutions. Insert demonstrates the concentration dependence of microstrain.
The line broadening in the powder neutron diffraction pattern of Al-doped barium hexaferrites increases with increasing Al 3+ ion concentration. The full width at half maximum of neutron peak is described by [ 28 , 31 ]
where C 1 , C 2 , C 3 , C 4 are refining constants; W is the full width at half maximum of diffraction peak; ( C 1 + C 2 d 2 ) is the resolution function of HRFD obtained from standard Al 2 O 3 (SRM-676 of NIST, USA); C 3 d 2 is the contribution by the size effect; and C 4 d 4 is the contribution by the microstrain effect.
The true physical line broadening of powder neutron peaks for BaFe 12− x Al x O 19 is calculated by FullProf software as the difference of width between experimental samples and standard Al 2 O 3 . The line broadening is connected only with the microstresses factor. In ferrimagnetic crystals, the separate sublattices give different contributions to general deformation. Besides, the local environment symmetry of magnetic ions in ferrimagnetic crystals differs from the macroscopic symmetry. This leads to an increase of the microscopic parameter number in comparison with the microscopic one. The slope of the approximated function increases with increasing diamagnetic ion concentration. This behavior indicates that the microstrain increases in crystallites. It is shown in Fig. 4 that the experimental points correspond to different combinations of Miller indices, which indicates the absence of explicit anisotropic effects in the broadening of the diffraction peaks.
The dependence of the microstrain value on the composition for BaFe 12− x Al x O 19 is shown in the insert of Fig. 4 . The calculation of the microstrain value is performed with isotropic approximation, i.e., the size effect is absent ( L > 3000 Å). The minimum microstrain is observed in the sample of x = 0.1. The increase in the microscopic microstrain with increasing aluminum ion concentration is associated with the increase of the system disorder, as a result of the statistical distribution of aluminum ions on magnetic sublattices, which can make different contributions to the total deformation.
3.3. Magnetic properties
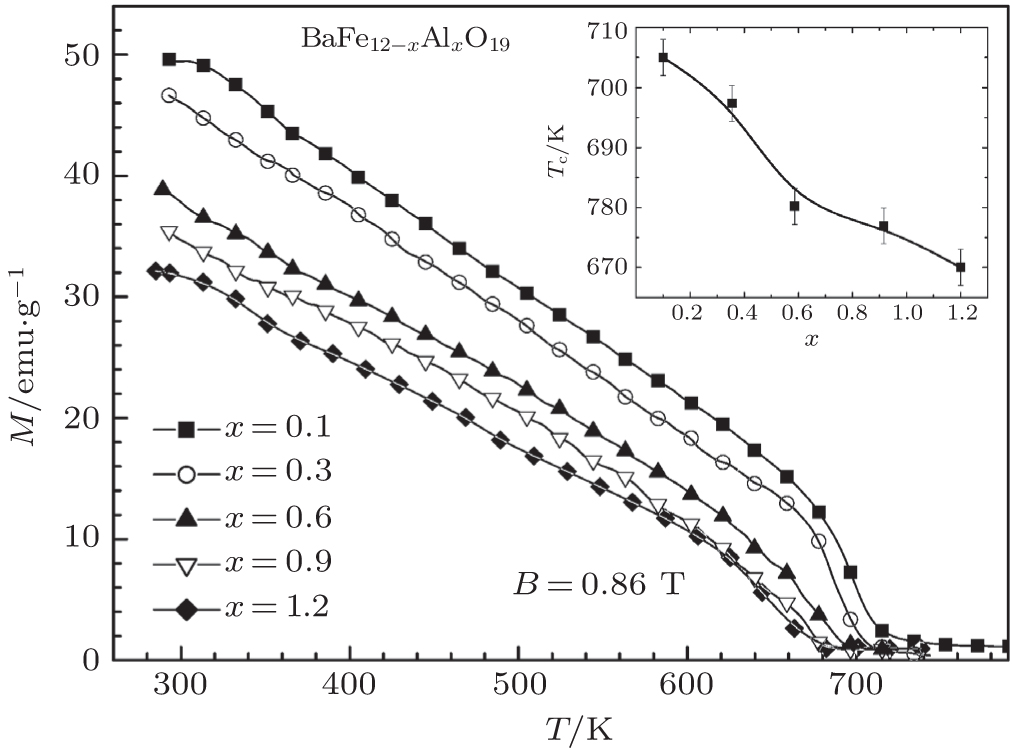
Figure 5 demonstrates the temperature dependence of the specific magnetization for BaFe 12− x Al x O 19 obtained by VSM. The insert demonstrates T c for each composition. According to the magnetic investigations, the paramagnetic–ferrimagnetic phase transition temperature T c for BaFe 12− x Al O 19 is at temperature range 705–670 K, whereas for pure BaFe 12 O 19 , the Curie temperature is 740 K. [ 32 , 33 ]
Fig. 5. The temperature dependence of the specific magnetization for the BaFe 12− x Al x O 19 ( x = 0.1–1.2) solid solutions. Insert demonstrates T c for each composition.
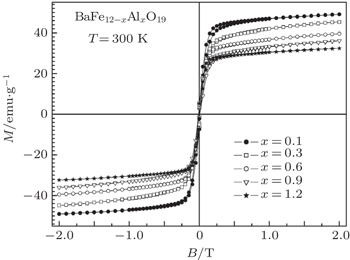
Fig. 6. The field dependence of the specific magnetization at 300 K for the BaFe 12− x Al x O 19 ( x = 0.1–1.2) solid solutions.
The increase in the concentration of aluminum ions leads to a reduction of the specific magnetization from 49.6 emu/g ( x = 0.1) to 32 emu/g ( x = 1.2) at room temperature. As the diamagnetic Al ion concentration increases in the solid solution, the number of neighbor magnetic iron ions is reduced, so the magnetic order is destroyed at lower temperature. [ 34 ]
Such behavior of the specific magnetization (magnetization decreases with increasing concentration of aluminum ions) is observed on the field dependence of the specific magnetization (Fig. 6 ). Almost all the samples go into saturation in external magnetic fields up to 2 T. [ 35 ]
3.4. Magnetic structure
In hexaferrites, the magnetic Fe 3+ ions are located in positions which have octahedral (Fe1-2a, Fe4-4f VI , and Fe5-12k), tetrahedral (Fe3-4f IV ), and bipyramidal (Fe2-2b) oxygen environments. As a result of the partial replacement of iron ions by diamagnetic aluminum ions which are distributed statistically equivalent at all positions of the magnetic lattice, it can be expected to observe the change in the magnetic moments at the corresponding positions. The data are collected at room temperature, well below the phase transition temperature for ferrimagnetic–paramagnetic appropriate formulations. Its description in the concentration range from x = 0.1 to 1.2 fully satisfies the model proposed by Gorter, [ 36 ] according to which all the magnetic moments of Fe 3+ are oriented along the easy axis which coincides with the hexagonal c axis (Fig. 7 ).
The magnetic structure of BaFe 12− x Al x O 19 (Gorter model) at room temperature. Fe 3+ ions (magnetic moment) and Ba 2+ ions (without magnetic moment) are depicted.
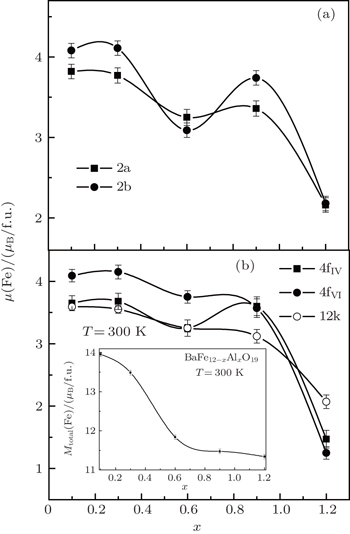
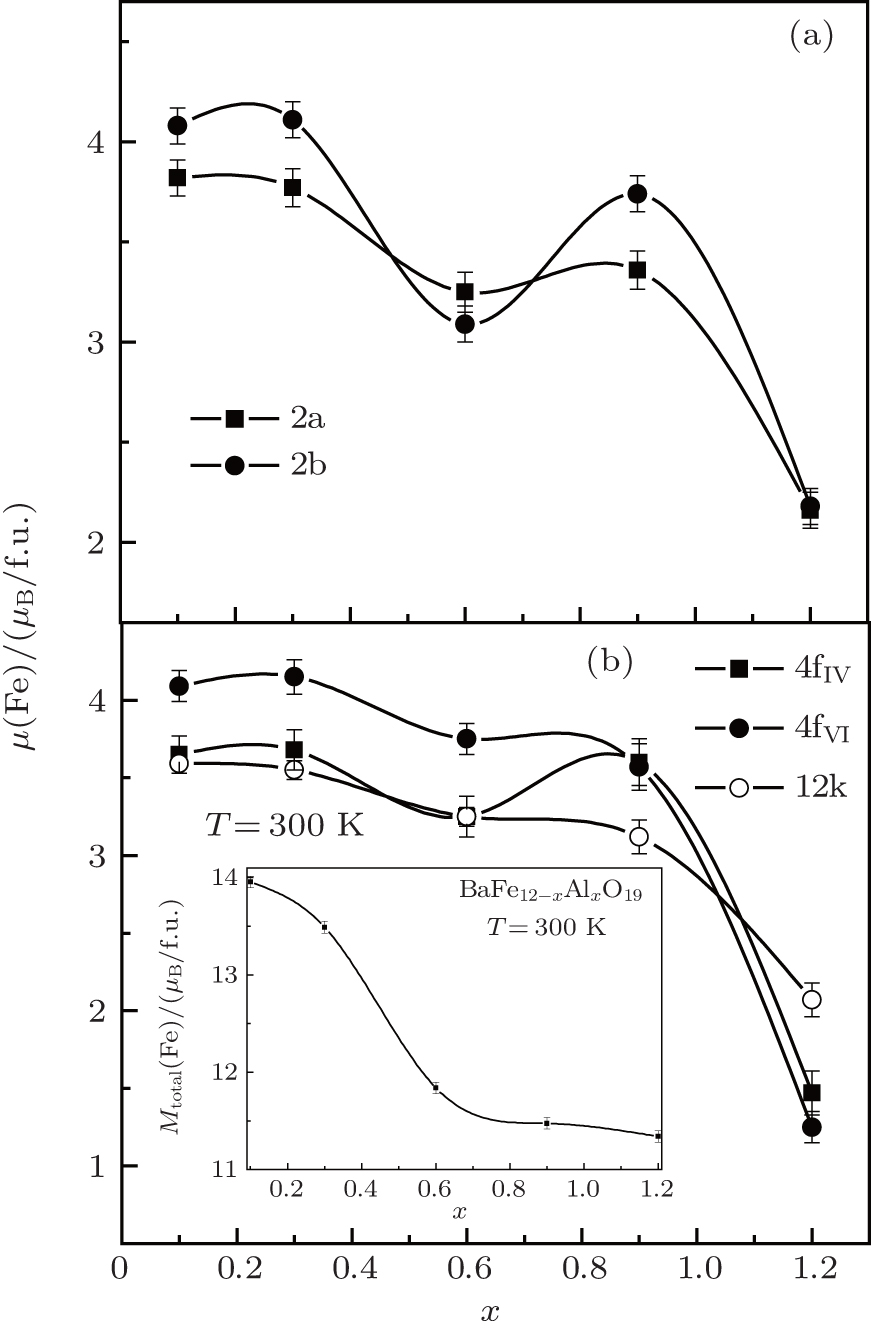
Figure 8 and Table 2 show the concentration dependence of the magnetic moments of the Fe 3+ ions at different crystallographic positions: 2a, 2b, 4f IV , 4f VI , and 12k.
Fig. 8. The concentration dependence of the magnetic moment per iron ion at different positions obtained by powder neutron diffraction at 300 K for the BaFe 12− x Al x O 19 ( x = 0.1–1.2) solid solutions. Insert demonstrates the concentration dependence of the total magnetic moment per f.u.
Table 2.
Table 2.
Table 2.
The magnetic moment per iron ion at different positions obtained by powder neutron diffraction at 300 K for the BaFe 12− x Al x O 19 ( x = 0.1–1.2) solid solutions.
.
x
0.1
0.3
0.6
0.9
1.2
Fe1 (2a)
3.82
3.77
3.25(0.03)
3.36
2.16
Fe2 (2b)
4.08(0.13)
4.11(0.15)
3.09
3.74
2.18(0.19)
Fe3 (4f IV )
3.65(0.09)
3.68(0.10)
3.25(0.11)
3.60(0.18)
1.47(0.08)
Fe4 (4f VI )
4.09(0.09)
4.15(0.11)
3.75(0.03)
3.57(0.19)
1.25(0.09)
Fe5 (12k)
3.59
3.55(0.05)
3.25(0.03)
3.12(0.08)
2.07
Table 2.
The magnetic moment per iron ion at different positions obtained by powder neutron diffraction at 300 K for the BaFe 12− x Al x O 19 ( x = 0.1–1.2) solid solutions.
.
With the substitution of iron ions by aluminum ions, the exchange interaction between the magnetic sublattices is broken, which leads to a decrease in their magnetic moments. A slight change in the magnetic moment (reducing the sublattice magnetic moments of the formed iron ions located at positions 2a and 2b) for composition x = 0.6 appears, which may be due to inhomogeneities in the distribution of aluminum ions on crystallographic positions in the preparation of the sample.
It can be assumed that at a low concentration of aluminum ions in the compound, they should be distributed statistically throughout nonequivalent positions in the magnetic hexagonal ferrite lattice. However in our case, to reduce the discrepancy between the experimental data and the performed calculations of the magnetic and crystal lattices for the Al-doped barium hexaferrites, the aluminum ions in a greater degree prefer to substitute into the 2a, 2b, and 12k positions, while in a lesser degree into 4f IV and 4f VI . Since the Al ion distribution is largely influenced by the method of sample preparation, the confirmation of the correctness of our judgments on their distribution in the corresponding crystallographic positions is planned to be found in the course of further research.
Resulting total magnetic moment per formula unit for the barium hexaferrite (BaFe 12 O 19 ) at temperature T can be calculated according to the formula
If the magnetic moment of the Fe 3+ ion at 0 K is equal to 5 μ B , then the magnetic moment of pure BaFe 12 O 19 ferrite will be equal to 20 μ B per formula unit. The total magnetic moment ( M total ) for the BaFe 12− x Al x O 19 solid solutions is shown in the insert of Fig. 8 . Such low values are explained by the influence of diamagnetic Al ions and the thermal factor causing the disorientation of the magnetic moments in space due to the increase of the thermal fluctuations of the ions forming the crystal lattice.
4. Conclusion
By using high resolution neutron diffraction, we investigated the crystal and magnetic structures of the BaFe 12− x Al x O 19 solid solutions. The temperature and field dependences of the specific magnetization were investigated by VSM. Decrease of T c from 705 K ( x = 0.1) to 670 K ( x = 1.2) and reduction of the specific magnetization from 49.6 emu/g ( x = 0.1) to 32 emu/g ( x = 1.2) at room temperature were observed. It was shown that the magnetic structures of the samples over the entire range of concentrations are in good agreement with Gorter’s model, according to which the magnetic moments of the Fe 3+ ions are oriented along the hexagonal axis, which is the axis of easy magnetization. The observed decrease in the Curie temperature with increasing diamagnetic ion concentration is due to the weakening of the Me–O–Me exchange interaction, i.e., the number of neighboring magnetic iron ions is reduced so that the magnetic order is destroyed at lower temperature. This causes the decrease of T c and the reduction of the specific magnetization at room temperature with increasing concentration of aluminum ions. When the concentration of aluminum ions increases in the crystallite, the microstrain increases, this can be attributed to the increase of the system disorder as a result of the statistical distribution of the aluminum ions in the magnetic sublattices.


 , Panina Larisa 1 , Trukhanov Sergei 2 , Turchenko Vitalii 3 , Salem Mohamed 1 ]